READWHAL

vip
Active for: 1.3y
Peak Tier 5
No content yet
Bitcoin is about to jump off the cliff — and I'm looking forward to it ! 👀
😨 While most people are scared of another new low, I'm waiting for it!
Those who've been following me for a while will remember: in 2022 I started buying at $30k, kept buying all the way down to $15k, and averaged my entry to around $ 20k+. 🔥
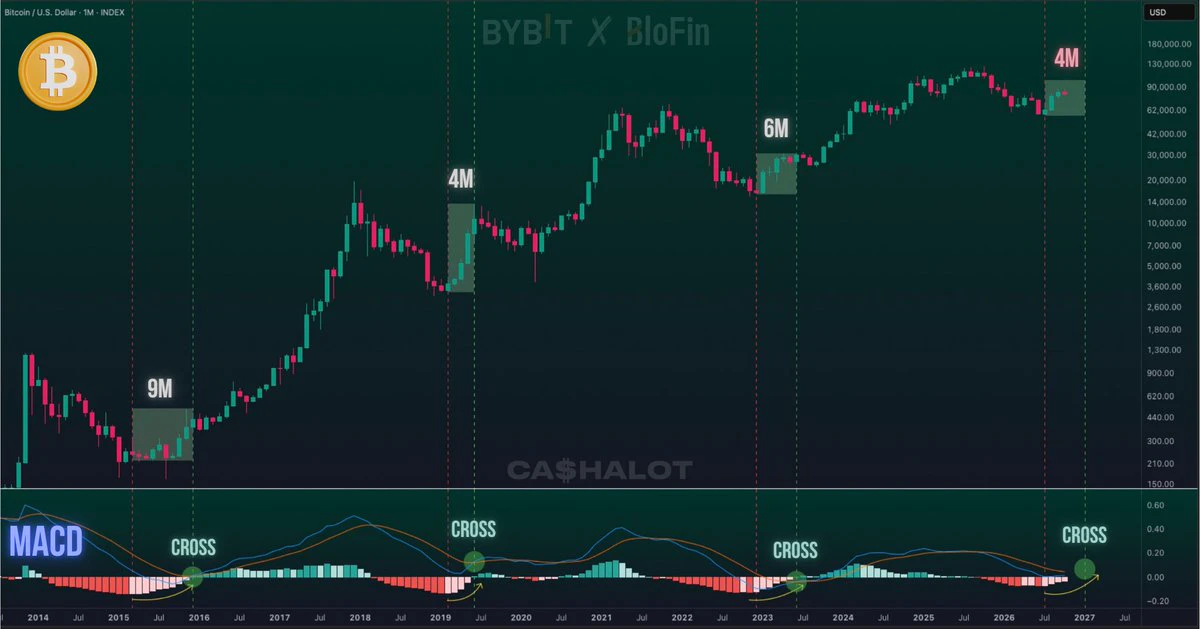
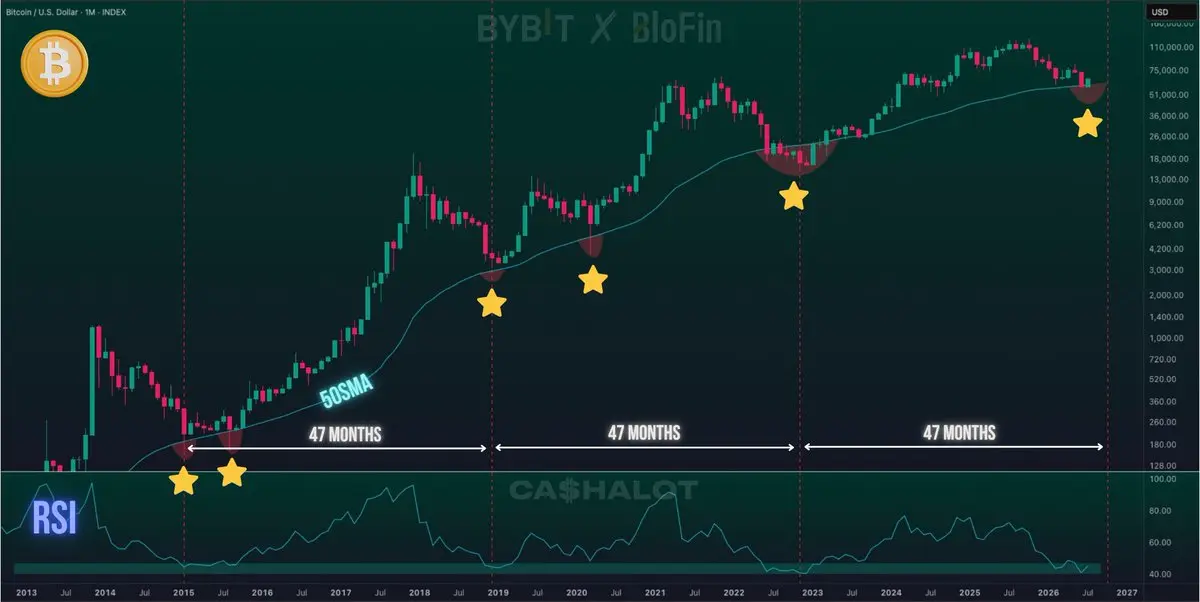
🤔 Why am I telling you this? Because every single time $BTC broke below the 50SMA on the monthly chart — It was the best opportunity. That's exactly where the capital for the next cycle gets built.
Look at the chart yourself. Based on the cycle pattern — you have roughly 2 mont
BTC-0.64%
post-image
  • Reward
  • Comment
  • Repost
  • Share
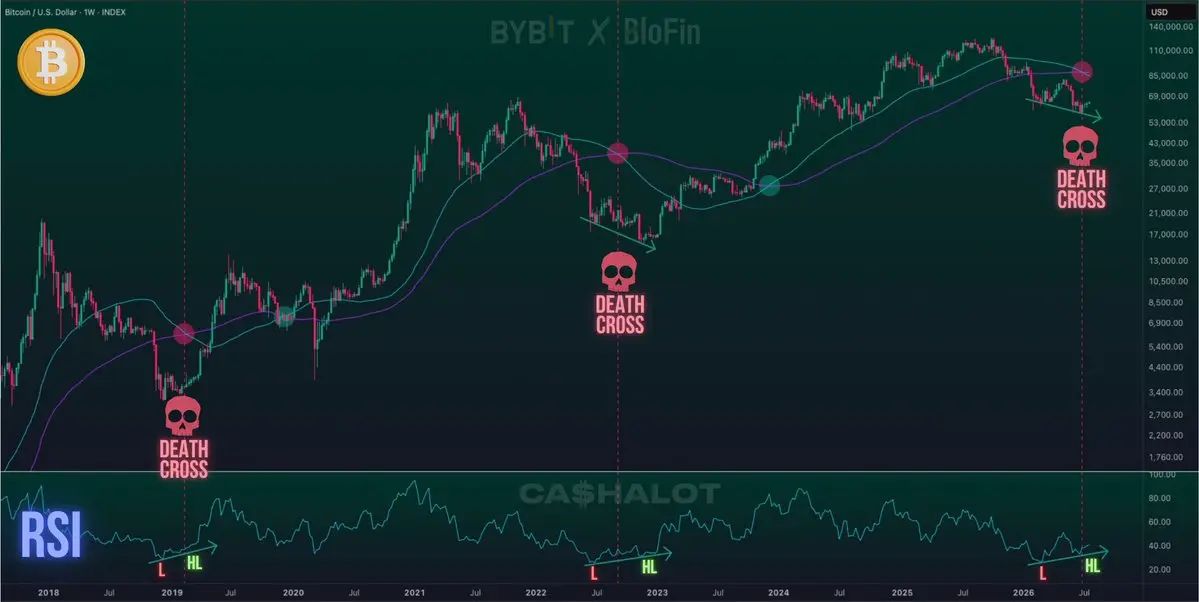
☠️ The Death Cross is confirmed!
❌ And no — this doesn't mean the worst is "just getting started."
Historically, Death Crosses tend to appear on the chart when the price is already close to its bottom.
🔴 In 2019, after the Death Cross, the price never went lower.
🔴 In 2022, the FTX collapse and mass panic pushed it down another 25%.
The RSI - just like in both previous cases - is printing higher lows after touching the extreme oversold zone.
And once again, it's forming a Bullish Divergence. Same picture. Third time in a row.
The conclusion is simple:
📉 Those buying the overheated AI market
BTC-0.64%
post-image
  • Reward
  • Comment
  • Repost
  • Share
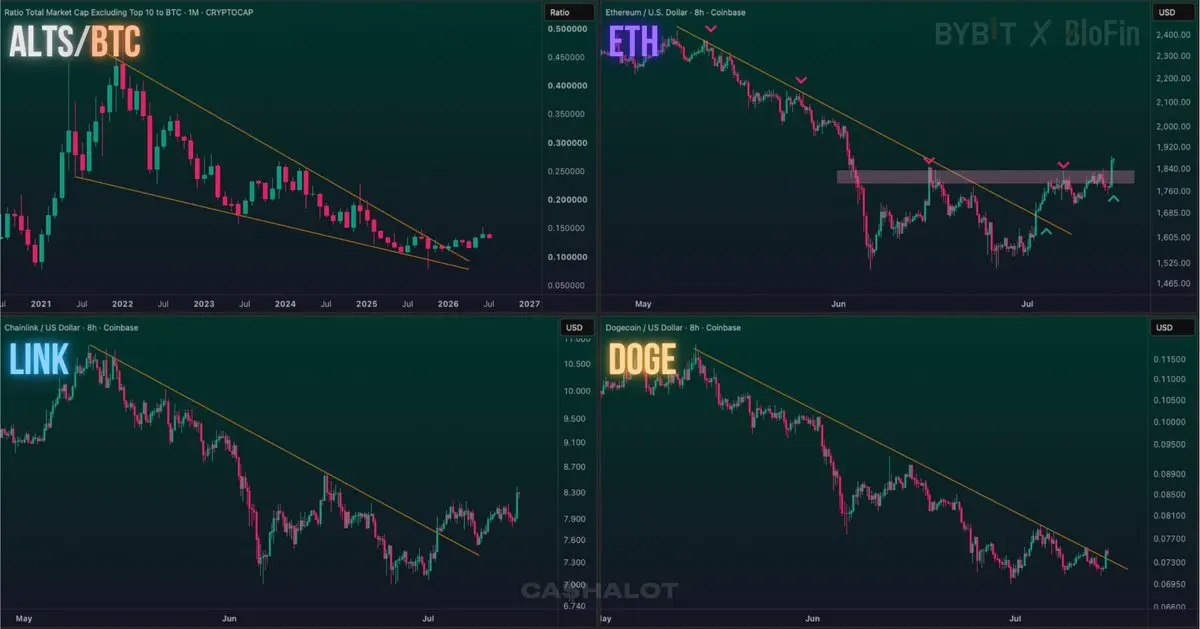
🇺🇸 Core CPI came in below expectations, and crypto ripped higher.
💪 It’s been a strong day for the market.
On the monthly chart, ALTS/BTC has been trending up for six months since the breakout.
✅ And today Ethereum delivered a second major break on the LTF: not only through the descending trendline, but also a firm reclaim above the key horizontal level at $1,800, which had been the main barrier for the past two months.
The rest of the altcoin board is following - slowly but surely.
Ethereum is the pathfinder here. If it can hold this reclaim with conviction, the others should follow. The b
BTC-0.64%
ETH-0.04%
DOGE-0.04%
post-image
  • Reward
  • Comment
  • Repost
  • Share
The 4th chance in a decade - and most will miss it again... 😢
👀 On the monthly chart, $BTC is back in the lower zone of the Logarithmic Regression + Fibonacci Deviation Bands.
Historically, accumulation in this zone marked cycle‑deep value: 2015, 2020, 2022.
🚀 Subsequent cycle moves were large (x124, x16, x8 to peak, per the chart) - diminishing but still asymmetric. 👌
This zone won’t give you the exact bottom, but it has offered the best long‑term risk‑adjusted entries for investors who could stomach volatility.
Trading right now is brutal - chop, stop‑hunts, thin liquidity. Investing via
BTC-0.64%
post-image
  • Reward
  • Comment
  • Repost
  • Share
Does history rhyme? 🤔
🔙 Exactly 4 years ago we saw the same picture — similar correction after ATH, Bullish Divergence forming deep in oversold territory. What followed was one of the greatest bull runs in crypto history. 📈
👀 Today? The Weekly chart is printing that exact same setup. Same structure. Same RSI divergence. Same MACD positioning.
🐻 Bears are pointing to "lack of buyer interest" — which, by the way, has never existed at any major market bottom. Ever. They're also scared of Saylor dumping his BTC stack. Meanwhile, I'm looking at the broader picture:
🫧 The entire global economy
BTC-0.64%
post-image
  • Reward
  • Comment
  • Repost
  • Share
The ultimate exit liquidity? 💸
📁Obama’s disclosure was 8 pages. Biden’s was 11.
Trump’s 2025 financial disclosure? A massive 927 pages. 🗂
💰 Total revenue: $2.2 BILLION.
💰 Out of which $1.4 BILLION came straight from crypto ventures:
✅ $635.1M → $TRUMP memecoin royalties (CIC Digital)
✅ $526.0M → $WLFI token sales
✅ $196.9M → Stablecoin Holdco venture
✅ $65.0M → WLFI equity & stake sales
📉 While retail investors are staring at -82% and -87% charts (literally down bad), the "Crypto President" just printed history’s biggest legal rug pull.
Once again, we get the promises, they get the liqui
TRUMP3.22%
WLFI8.85%
post-image
  • Reward
  • Comment
  • Repost
  • Share
📆 November 1, 2026. Set a reminder. ⏰
If you truly believe the cycle is that reliable, would you go all-in on $BTC that day?
〰️ Bitcoin cycle theory says you buy 500 days before the Halving and sell 500 days after. According to that model, the next major decision point arrives on November 1, 2026.
🤔nI'm sceptical. Every cycle is different, Bitcoin is maturing, returns are shrinking, and historical patterns become less reliable as the market evolves.
What I do believe is that the best opportunities usually appear when fear is extreme, and the market is historically oversold. That's when I pre
BTC-0.64%
post-image
  • Reward
  • Comment
  • Repost
  • Share
Third time's a charm? 🤔
👀 Over the last 6 months, this is already the 3rd identical signal on $BTC Daily chart:
✅ RSI breakout after hitting a strong oversold zone
✅ Bullish MACD cross, also deep in negative territory
The first two times? We got relatively small bounces that eventually led to the continuation of the correction. 📉
But this time feels different. Weekly RSI Bullish Divergence is forming. Price is holding above the 200WMA. And a Middle East peace deal just hit the tape. 🤞
The odds of this one actually meaning something are significantly higher.
Are you calling the end of the b
BTC-0.64%
post-image
  • Reward
  • Comment
  • Repost
  • Share
⚠️ CMO (Chande Momentum Oscillator) is one of the most underrated cycle indicators for #Bitcoin.
⚖️ It measures the balance between buying and selling pressure over a selected period and oscillates between -100 and +100.
👀 On Bitcoin's monthly chart, an interesting pattern has emerged:
🟠 2015 — CMO reached extreme oversold levels → cycle bottom
🟠 2019 — similar signal → end of the crypto winter
🟠 2022 — another extreme reading → market capitulation
Now, the indicator is once again approaching a zone that has historically coincided with major long-term accumulation opportunities. 📈
Importa
BTC-0.64%
post-image
  • Reward
  • Comment
  • Repost
  • Share
😱 Bitcoin is repeating the previous cycle and heading for a new low!
That's what all the so-called experts are screaming now - the same people who were promising $100K "within days" back at $82 K. Now that we're at the lows, they're suddenly flipping bearish again. 🤡
But these bedroom traders forgot one critical thing:
Comparing these two cycles is completely pointless. 🤷
🖐 At this exact same Point 5 in the previous cycle, the entire market was nuked by a black swan event. The FTX collapse triggered a chain reaction that wiped out TerraUSD, Celsius, Voyager Digital, Three Arrows Capital a
BTC-0.64%
post-image
  • Reward
  • Comment
  • Repost
  • Share
🍕 Happy Bitcoin Pizza Day!
🔙 16 years ago today — on May 22, 2010, Laszlo Hanyecz made the first real-world Bitcoin transaction by buying 2 Papa John's pizzas for 10,000 $BTC .
Back then, it was worth just $40. Today, those same 10k BTC would be worth over $ 775m. 😅
❗️ But here’s the real takeaway:
This wasn’t just a funny moment in crypto history. It’s a reminder of how easy it is to sell too early. 🤦‍♂️
BTC-0.64%
  • Reward
  • Comment
  • Repost
  • Share
Bitcoin vs Gold - The Same Pattern Playing Out Again ? 🤔
👀 This chart tells a story that gold bugs don't want to see.
Every time $BTC / $XAU ratio drops ~14 months after a peak - it bottoms and reverses hard. We've seen this exact cycle play out in 2014, 2018, and 2022.
And right now? We're sitting at another 13-14 month correction.
History doesn't repeat - but it rhymes. And this chart has been rhyming for over a decade. 💯
BTC-0.64%
XAU-0.38%
post-image
  • Reward
  • Comment
  • Repost
  • Share
Daily breakdown. Time to worry? 😱
🫨 Everyone finally woke up after the trend broke, yet I’ve been analyzing bullish signals here for months. Now, late FOMO buyers are about to get nervous - they’re effectively becoming the exit liquidity for a correction I’ve been anticipating for a while...
👀 Bitcoin on a Daily :
📉Trendline support broken on the Daily ;
📉RSI breakdown and a confirmed Bearish MACD cross.
$BTC is up ~35% in 3 months; this pullback is mandatory to cool the market and regroup. 🌡❄️
I expect a test of $70,000 as a classic R/S flip. However, we’ll likely wick lower to flush ou
post-image
  • Reward
  • Comment
  • Repost
  • Share
Anyone still waiting for $ 40K — are you still in the room? 👀
🔙 For the past few months, I was convincing you that this level would be a great $BTC entry point regardless. Just look at this chart. 6+ months of correction and you thought we'd drop another 50%? 🤔
Even if that had happened - if you listened, you're sitting on a solid +25% in 2 months. I personally entered at $ 70K, which I showed on my social media. 📲
🧠 Sometimes you need to use your brain instead of listening to hype merchants who know nothing beyond fractals.
Go back and read through the posts from the past few months and
BTC-0.64%
post-image
  • Reward
  • Comment
  • Repost
  • Share
$BTC HOLDING STRUCTURE ABOVE KEY RESISTANCE 🔑
Another weekly close above trend resistance for Bitcoin - structurally constructive.
✅ RSI is following through after extreme oversold conditions, pushing higher in a controlled recovery.
✅ MACD just printed its fourth consecutive green histogram after a Bullish Crossover - momentum is building, not fading.
💪 Price is holding firmly at the 80K range, with no clear bearish divergence or breakdown signals. As long as this structure holds, the bias remains continuation rather than reversal.
Do you see any real bearish signals here… or is the market
BTC-0.64%
post-image
  • Reward
  • Comment
  • Repost
  • Share
❗️$BTC WEEKLY CLOSE IN 7 DAYS. AND THE MONTHLY IS PRINTING A BULLISH ENGULFING.
Every major Bitcoin bottom had a candle pattern before the move:
📈 2016 — Double Bottom → $20K
📈 2019 — Inverted Hammer → $69K
📈 2023 — Bullish Engulfing → $109K
👀 Right now? Same setup forming on the monthly.
I've gone through every indicator I track.
Not a single bearish signal pointing to continuation. Zero.
The chart is speaking. I'm listening. 👂
What's your read — bottom in, or one more leg down? 🙃
BTC-0.64%
post-image
  • Reward
  • Comment
  • Repost
  • Share
🗣 They’re calling this a fakeout. Saying $BTC is going lower.
Most people think that. I don’t. ❌
⬇️ Drop a comment “BULL” and I’ll send you the full breakdown I prepared - detailed, data-driven, and straight to the point. This might be your last clean entry before the move.
🤓 A few weeks ago, I mapped out these exact scenarios. What you’re seeing now is not random - it’s playing out step by step. 📃
📉 This correction? One of the sharpest in history.
And if you’re expecting another leg down of the same magnitude - take a closer look at the charts. 🔍
I won’t over-explain it here.
Read the r
BTC-0.64%
post-image
  • Reward
  • Comment
  • Repost
  • Share
⚡ #Ethereum is Leading the Charge of the Next Rally!
🔙 Yesterday, we broke down the total altcoin market cap. Today, let's zoom in on the asset that's quietly setting up for something massive.
$ETH / $BTC on the weekly chart has just completed BOTH phases of Elliott Wave Theory:
📈 A clean 5-wave impulsive structure (waves 1→5) to the upside
📉 A full ABC corrective pullback - textbook execution
And here's where it gets interesting 👇
After both RSI and MACD hit their most oversold levels in history (April 2025), we're now seeing:
✅ Confirmed RSI breakout
✅ Bullish MACD cross
The correction is
ETH-0.04%
BTC-0.64%
post-image
  • Reward
  • Comment
  • Repost
  • Share
🛡 BITCOIN - THE ULTIMATE SAFE HEAVEN ?
While traditional "risk-off" assets are faltering under geopolitical pressure, Bitcoin is rewriting the playbook. ✍️
💥 Since the escalation of the US-Iran conflict on February 28th, we have witnessed a historic decoupling. Market skeptics were calling for a retracement to the $40k level, yet the data tells a completely different story. $BTC isn't just surviving the crisis; it is dominating it.
👀 Bitcoin +17% 📈 S&P500 +1.5% 📈 Gold -10% 📉 Silver -17% 📉
If this conflict doesn't cool down soon, brace yourselves: inflation is about to hit high gear. The
BTC-0.64%
post-image
  • Reward
  • Comment
  • Repost
  • Share
❗️ANOTHER $BTC SIGNAL YOU CAN’T IGNORE
First an RSI breakout, and now... a Weekly MACD Bullish Cross has officially confirmed. ✅
This is only the 6th time in over 5 years.
👀 Look at the chart: we’ve never seen the MACD cross from such a deep, oversold level in this entire period.
🔙 Yes, in 2021 and 2022 (FTX crash), the immediate reaction was shaky. But MACD is a lagging indicator - by the time it crosses, the "local bottom" is usually already behind us.
We are entering a high-probability zone. 📈
BTC-0.64%
post-image
  • Reward
  • Comment
  • Repost
  • Share
  • Pinned