Share your thoughts
placeholder
Article
#NEARSurgesOver21Breaking3
#ShareWeekly #WeekendMarketBullishOrBearish #Gate广场中秋团圆局 $NEAR
Forget the Price Chart for a Second — Here's What NEAR's Tokenomics Are Actually Doing
NEAR is trading around $3.684 today, up 5.41%, after pulling back somewhat from a 24-hour high near $3.914. Last week's move briefly pushed the token from around $3.25 into a 21% single-day surge.
But honestly, the price action is the less interesting part of this story right now.
What's actually worth understanding is how NEAR's token economics have been changing over the past year, because that structural shift cou
NEAR+4.70%
#日股地产电力半导体板块走强 #JapanRealEstatePowerChipStocksRise
Japan stock market delivered a powerful session on Sep 18, but looking only at the Nikkei 225 does not tell the full story.
The Nikkei 225 closed at 65,018.95, gaining 882.70 points, or 1.38%, after briefly surging more than 1,300 points during the session. Reclaiming the 65,000 level is technically and psychologically important.
But there was an interesting contrast.
The TOPIX finished at 4,091.14, down 3.05 points, or approximately 0.07%.
That tells me the Japanese market was not moving uniformly. Capital was concentrating in particular com
JPN225+0.23%
TAO is range-bound daily, but the 1h setup says otherwise.

$TAO /USDT - SHORT

Trade Plan:
Entry: 254.3 – 256.3
SL: 267.8
TP1: 245.9
TP2: 239.6
TP3: 230.2

Why this setup?
Why now? The daily trend is a range, yet the 1h price at 255.3 sits at the entry_ref, the 15m RSI reading 55.55 shows neutral momentum, the 1h ATR of 4.014913 flags volatility expansion, and the entry zone between 254.3 and 256.3 validates the trigger. The target TP1 at 245.9 marks the first reward level, TP2 at 239.6 extends the move, and TP3 at 230.2 defines the ultimate objective. The invalidation level at 238.8 is th
TAO+2.89%
$XRP is showing signs of recovery, trading around $1.41 after dropping to $1.27 earlier this week.
The market can switch narratives fast.
Memecoins get attention, gold starts moving, then forex suddenly has its own story.
Even $BTC can go quiet while another market takes the spotlight.
$XRP ‌#JapanRealEstatePowerChipStocksRise
post-image
XRP+6.38%
Long $ZEC
is recovering quite well after the shakeout; if it holds the short-term EMA cluster, it may continue retesting the Weak High around 1,585–1,590. Expected target: 2k. Entry 1: 1,549–1,552 USDT (current price range) Entry 2: 1,539–1,542 USDT (EMA retest/nearby support) Entry 3: 1,525–1,529 USDT (deep support) Take Profit: TP1: 1,588 USDT TP2: 1,660 USDT TP3: 1,739 USDT Stop Loss: 1,516 USDT The 1,585–1,590 range is an important resistance level. If ZEC breaks through and holds this range, the bullish structure may extend strongly toward TP2–TP3. Allocate positions evenly across all en
post-image
ZEC+5.06%
$SNDK Sandisk’s sharp surge at the U.S. market open over the past two days has trapped quite a few retail investors. Judging from the 24-hour liquidation data, $9.1 million in retail funds has been liquidated. As for Sandisk’s weekend trend, Meiqi will discuss it with everyone.
Sandisk’s weekend trend is already very clear: it won’t let short sellers get out of their losing positions so easily. The weekend market movement is quite obvious, mainly driven by catch-up gains and designed to lure in shorts.
#Gate广场中秋团圆局
SNDK+7.90%
#GateMeme狂欢季
#Gate广场中秋团圆局
#每周来晒
Doubled in 24 hours: Is Fatcoin a “dead cat bounce” or a reversal?
Robinhood Chain’s recent popularity can be said to have fallen from heaven to hell, and Fatcoin’s price action is the truest reflection of this situation. It recently fell from a high of 0.038 to a low of 0.0008, nearly reaching zero, before staging a strong rebound today, gaining over 150% intraday. Today, let’s take a closer look at this coin and use it as a window into how RH Chain and Meme tokens may develop going forward.
I. Token Overview: The “Fat” Themed Meme on Robinhood Chain
FATCOIN
post-image
LittleGodOfWealthPlutus
#GateMeme狂欢季
#Gate广场中秋团圆局
#每周来晒
Doubling in 24 hours: Is Fatcoin a “dead-cat bounce” or a reversal?
Recently, the hype surrounding Robinhood Chain has fallen from heaven to hell, and Fatcoin’s price action can be said to be the most accurate reflection of this situation. It recently fell from a high of 0.038 to a low of 0.0008, nearly reaching zero, before rebounding strongly today, gaining over 150% intraday. Today, let’s take a closer look at this token and, by extension, discuss how to approach RH Chain and Meme tokens going forward.
I. Token Overview: A “Fat”-Themed Meme on Robinhood Chain
FATCOIN is a community-driven internet meme token deployed on Robinhood Chain. It entered the public spotlight in 2026 as the Robinhood Chain mainnet ecosystem exploded.
Basic parameters:
Token symbol: FATCOIN
Issuing blockchain: Robinhood Chain
Total supply: 1 billion tokens (fixed, with no issuance mechanism)
Token type: Community-driven Meme Coin
Exchanges: Gate and others. On September 5, 2026, Gate simultaneously launched the FATCOIN/USDT perpetual contract in the Robinhood and Meme zones
Project characteristics: FATCOIN has all the typical elements of a Meme coin — a humorous “fat” themed brand image, viral social-media spread, and community-led governance, with no traditional product roadmap or technical white paper. Community content revolves around jokes about being “fat,” attracting retail participation through a lighthearted and entertaining approach.
Its rise is inseparable from the ecosystem benefits of Robinhood Chain. Robinhood itself has 28.5 million paying users and $355 billion in platform assets, with its brand DNA closely tied to retail speculation culture. Just two months after the chain launched, DeFi total value locked surged from less than $5 million to $750 million, while daily trading volume surpassed $1.8 billion. Meme coin trading accounted for an overwhelming share of on-chain activity. FATCOIN was pushed into the spotlight by the community amid this wave.
II. Price Action: From Heaven to Hell in Two Weeks
1. Pumping phase (around September 3): A typical FOMO-driven move The 4.5-fold gain on September 3 was not driven by fundamental catalysts, but resulted from the resonance between community hype and Robinhood Chain’s traffic incentives. At the time, the Robinhood Chain Meme ecosystem was at the center of widespread attention, and FATCOIN, as one of the chain’s representative Memes, was quickly pushed higher by speculative capital.
2. Top signal: The perpetual contract launched at the peak One noteworthy detail is that Gate launched the FATCOIN perpetual contract on September 5, while the price happened to peak on September 4. This was no coincidence: the launch of the perpetual contract provided the market with legitimate short-selling channels and high-leverage tools. Early profit-takers could hedge or even open short positions through futures, while attracting a large number of bears and directly changing the balance between bulls and bears.
3. Crash phase: A liquidity-drain decline From its ATH of $0.03836 to approximately $0.00079 on September 17, the cumulative decline exceeded 97.9%. More importantly, trading volume contracted simultaneously — falling from a peak of $6.3 million to $1.1 million. This indicates that buyers were rapidly disappearing and that there was insufficient effective support during the decline, making it a typical “liquidity-drain decline.”
4. Current status: Oversold, but no bottom signal The market sentiment indicator shows Bearish, while the Fear and Greed Index is 56 (Greed). However, this is a broad market indicator and does not represent FATCOIN’s own sentiment. From a technical perspective, the price continues to make new lows, with no stabilization signals such as a high-volume rebound or bullish divergence.
III. Token Distribution
Overall token distribution characteristics of Robinhood Chain
A complete analysis of the 63.5 million transactions conducted during the first 13 days after Robinhood Chain’s launch revealed an extremely concentrated trading structure:
Five addresses submitted the vast majority of all on-chain transactions, with one address alone accounting for 25%
Just 1.1% of active wallets (9,003) contributed 37.3% of trading volume
Meme coin trading accounted for an overwhelming majority of total on-chain transactions
This means that the tokens and trading volume of Meme coins on Robinhood Chain, including FATCOIN, are highly concentrated in the hands of a small number of “scientists” and market-making addresses. Ordinary retail traders are more often price takers than price setters.
Analysis of FATCOIN’s token distribution
Based on the general patterns of Meme coins and FATCOIN’s price action, it is reasonable to infer:
1. Early token holdings were highly concentrated: Before the September 3 pump, low-cost tokens were inevitably concentrated in the hands of a small number of early participants and core community addresses. A 450% single-day gain requires enormous buying pressure, but even more importantly, light selling pressure overhead — something possible only when token holdings are highly concentrated.
2. The pump was also distribution: The continued collapse after the ATH indicates that early holders systematically distributed their tokens at high prices. After Gate launched the perpetual contract, these addresses could sell on the spot market while also establishing short positions in the futures market for hedging, creating a dual-profit model of “spot dumping + futures shorting.”
3. Retail bagholding is clearly evident: The gradual contraction in trading volume during the crash indicates that retail traders who bought at high prices are currently deeply underwater and choosing to “lie flat” rather than cut their losses. This leaves a large amount of trapped supply overhead, meaning any future rebound will face heavy selling pressure from holders seeking to break even.
4. Market makers may have already withdrawn: For a token whose market capitalization has shrunk to the level of several million dollars, professional market makers have little incentive to maintain liquidity. CryptoSlate data shows that FATCOIN’s trading activity rating is only 35/100 (Thin), indicating low reliability of price signals
IV. Fund Flows: The Relationship Between Fatcoin’s Rise and Fall and Sector Rotation
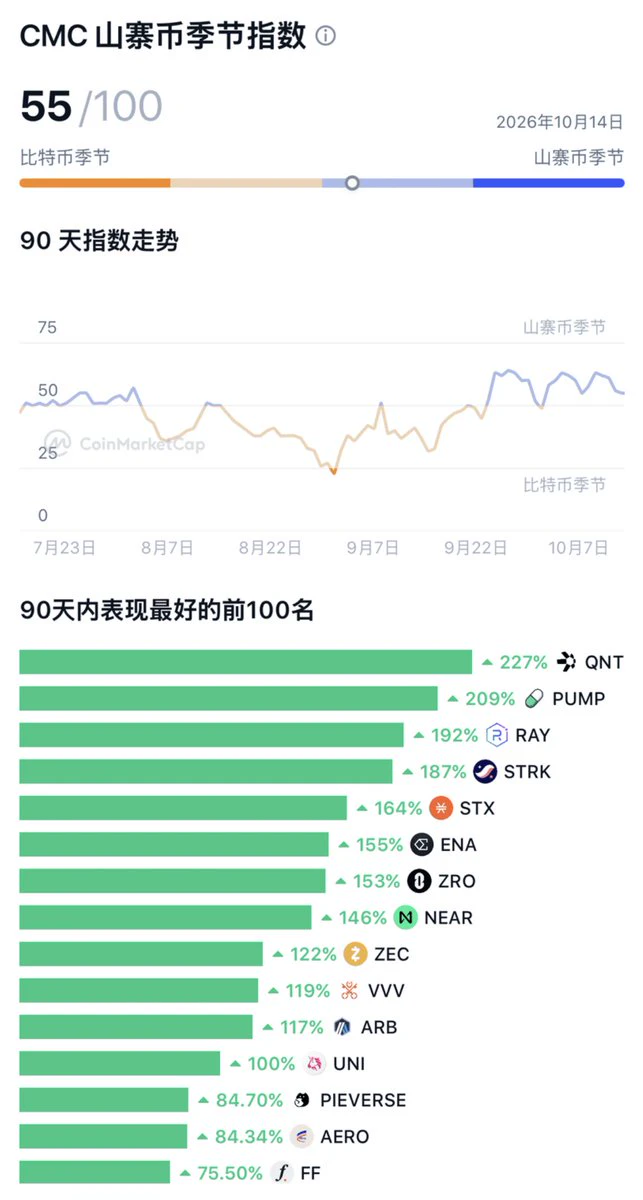
It is worth noting that FATCOIN’s peak on September 4 coincided closely with the starting point of this round of sector rotation in the crypto market. Since mid-September, capital has shifted from the high-risk Meme coin sector toward narrative-backed sectors such as privacy coins (ZEC up 56% in one week) and established public blockchains (NEAR up 46% in one day). FATCOIN’s crash was not an isolated event, but rather a microcosm of the broader retreat from the Meme sector.
V. Taking a Calm Look at RH Chain
FATCOIN is a typical example of a Meme coin’s lifecycle:
It leveraged Robinhood Chain’s ecosystem momentum and the community’s FOMO sentiment to complete a 4.5-fold surge in just one day
It quickly peaked after perpetual contracts were listed on exchanges and short-selling tools became more developed
It completed a drawdown of more than 97% within two weeks, while trading volume contracted by 80% and capital continued to exit
Its price action can also be viewed as a history of Robinhood’s rise and fall. As a “pig flying on the wind,” RH Chain’s explosive popularity under the Meme coin banner was inseparable from the deep involvement of capital rotation. But as speculative enthusiasm ebbs like a tide, it is inevitable that the excitement will fade and people will move on. For tokens on RH Chain, those who want to attempt short-term oversold rebounds can give it a try; they might even catch a major gain like Fatcoin’s intraday doubling. However, those looking to hold long term are advised to stay away. Even if you want to speculate on Memes, it is better to choose established tokens with greater stability and mature communities. After all, Meme coins are all about popularity; once a new coin loses its community support, it may truly be finished. Finally, wishing everyone wealth every day! $FATCOIN
repost-content-media
FATCOIN-23.29%
HOOD+9.10%
RH-0.13%
MEME+2.51%
  • 2
Many traders equate “a big drop” with “cheap,” rushing to buy the dip when $LSK fell 6.75% in 24 hours, while ignoring one premise: a low in a downtrend is not support, but merely the starting point for the next low.
First, look at the structure. $LSK is currently at 0.4188, with MA5=0.42556 having crossed below MA20=0.444805, forming a bearish moving-average alignment; the MACD histogram at -0.001018 remains below the zero line, while RSI=37.6 is approaching oversold but has not entered the extreme zone. The lower Bollinger Band at 0.411448 is currently the only short-term defense worth ref
post-image
LSK-3.46%
INJ+22.13%
SKY+15.18%
$BTC
Summary:
Following the previous text, a strong rally after a period of consolidation following the decline.
Price projection:
Oscillate between 80710-81235, first break above 81200, then break above 81313, and after the spike breaks above, return to oscillating between 80710-81235, before building strength for an extreme breakout near 83100.
Previous review:
Oscillated near 78030, broke above 78700, encountered resistance near 78900, and then returned to oscillating near 78000.
Actual movement:
Over the past few days, the price first broke above 79577, then fell to a low of 74919, before
post-image
BTC+4.13%
  • 1
My Unmanned Ji - AI
is truly great at interpreting the market
A market summary and review at 8 a.m. and 8 p.m.
is all it takes to know the market sentiment
and identify the leaders in capital flows
saving me so much time and energy
It’s really amazing👏
Next up is the battle over Bitcoin’s 80k level.
Against the backdrop of broad gains among major coins, $BNCB bucked the trend and closed down 2.2%, but its structure remains intact. It falls into the category of “passive pullback, active accumulation” within the sector and is worth watching.
The comparison is clear: $BN rose 1.11% today, holding above MA5/MA20, with an RSI of 60.3 and a 30-candle amplitude of just 4.14%, showing the steady climbing pattern of a large-cap asset; $PEPE rose 2.46% but remains below MA5, with an RSI of 48.7, representing a weak rebound. Meanwhile, $BNCB has an amplitude as high as 18.97%, with far greater v
post-image
PEPE+1.95%
BNB+0.59%
I was in a mediocre mood today, but checking my account made me feel a little better. While everyone was still waiting and watching, I saw clear resistance overhead. Every upward push fell just short, suggesting a short bias—don’t rush to flip long.
$SCRT Entry at 0.02694, current price 0.00785, +1737.64%. The answer is right here—this profit feels great.
Take 80% off first, and protect the remaining 20% at the entry price. Don’t panic on a rebound; the entry price is the protection level. Put the bulk in your pocket first—don’t get greedy for the last bite.
Panic comes from having no plan, an
post-image
SCRT-1.64%
ADA+3.55%
DOGE+2.82%
The image provided displays market overview data for various cryptocurrencies, precious metals, stocks, and assets:
* $ETH ETHUSDT (Ethereum): $2,625.46 (+5.41%)
*$BTC BTCUSDT (Bitcoin): $81,048.00 (+4.38%)
* $SOL SOLUSDT (Solana): $111.85 (+5.67%)
*$XAU USDT (Gold): $4,382.58 (-0.36%)
* $SNDK USDT (SanDisk Corporation): $1,781.41 (+7.92%)
* ZECUSDT (ZCash): $1,567.87 (+5.04%)
* XAGUSDT (Silver): $66.44 (-0.73%)
* XRPUSDT (XRP): $1.4179 (+6.97%)
If "shot tharling post" refers to a specific trading post, short-selling strategy, or social media caption, could you clarify what specific d
post-image
ETH+5.34%
BTC+4.13%
SOL+5.42%
XAU-0.43%
SNDK+7.90%
A whale holding a ZEC short position for nearly half a month was forced to close it, suffering a los
live-cover
LIVE2,223
Black Friday is surging against the trend—be cautious about chasing! A great opportunity to short for the long term! September 19 Bitcoin and Ethereum outlook
On Black Friday, Bitcoin once again broke above the 81000 level, while Ethereum fell below 2600, but there is no positive news in the market. It seems to be driven solely by capital, namely 🐶 market makers jointly squeezing shorts. Under these circumstances, chasing longs is definitely inappropriate. Although yesterday’s short position was unfortunately stopped out, the firm bearish outlook remains unchanged. Continue lying in wait for
NVDA+1.23%
  • 1
$ZEN $AERO $aave $pha
#राधाष्टमी #tera portfolio
post-image
ZEN0.00%
AERO+4.89%
AAVE+6.05%
PHA+4.37%
The feeling of having no pressure is simply great. The entire crypto market has been weighed down by rate hikes for nearly half a year, and now that pressure has finally been removed and reversed, the rebound feels completely effortless. At night, $BTC , watch the resistance around 82000-83000. If it cannot reach that level tonight, it will also push higher over the weekend, so there is little suspense. Breaking through this level will set the next targets at 85000-88000-90000.
$ETH At night, watch 2600-2660. If it cannot reach that level tonight, continue buying on a weekend pullback, with t
post-image
BTC+4.17%
ETH+5.36%
Guys, today is day 37 of earning living expenses through trading, and my total assets are 126.4U
It's Saturday, so I left the positions open and took the day off
Holding on is victory ✌️
Continuing to build positions
post-image
🔥SNDK SanDisk surges 11%—don't rush in!
Guys, stay calm! SanDisk surged nearly 11% yesterday,
with trading volume reaching $30 billion and the volume ratio jumping to 5.97 as front-running funds rushed in📈
It will officially be added to the S&P 100 on the 21st, forcing all passive index funds to buy in—this buying pressure is already clear.
But seasoned players know this classic pattern:
Early investors get in ahead of time, waiting for passive funds to enter so they can unload their holdings!
After so many index-inclusion rallies, the script has barely changed: a sharp run-up during the ant
post-image
SNDK+11.05%
BTC+4.17%
ZEC+5.03%
NVDA+1.23%
MU+3.80%
Load More

Join 40 M users in our growing community

⚡️ Join 40 M users in the crypto craze discussion

💬 Engage with your favorite top creators

👍 See what interests you

Trending Topics

JapanRealEstatePowerChipStocksRise

59.26k Views4.07k Discussing

Japan's Nikkei extended gains on Sept 18, with real estate, power, and semiconductor sectors leading. Gate covers over 12,800 global stocks and ETFs, offering one-stop USDT trading across US, HK, Korean, and Japanese markets. [👉 Read more](https://www.odaily.news/en/newsflash/518749)

USAIConceptStocksRally

33.96k Views783 Discussing

GateTopsStockPerpetualCoverage

38.07k Views2.47k Discussing

View More