Square
Following
Hot
News
Profile
Share your thoughts
placeholder
Article
🔹AI Stocks Take Off Ahead of the Fed Decision! The Semiconductor Index Jumps 3.6 and CoreWeave Surg
live-cover
LIVE1,975
Intraday trades
④ Shorted at 4043, exited at 4038, +570 bucks
⑤ Shorted at 4036, exited at 4029, +716 bucks
Today’s short trades are on a four-win streak; after the spike, the big short paid off!
$XAU #BTC争夺8万美元关口 #黄金 ‌
XAU+0.38%
Trenches
TTWO
T
bade
b
TTWO
TTWo...FbKo
Market Cap
$.
Change
.
24h Vol
$.
Holders
.
BNCB
B
bade
b
BNCB
0x49...ec3f
Market Cap
$.
Change
.
24h Vol
$.
Holders
.
DJT
D
bade
b
DJT
DJTu...xvoF
Market Cap
$.
Change
.
24h Vol
$.
Holders
.
ZIG
Z
bade
b
ZIG
0x8c...1145
Market Cap
$.
Change
.
24h Vol
$.
Holders
.
STONK
S
bade
b
STONK
6GmA...UNgx
Market Cap
$.
Change
.
24h Vol
$.
Holders
.
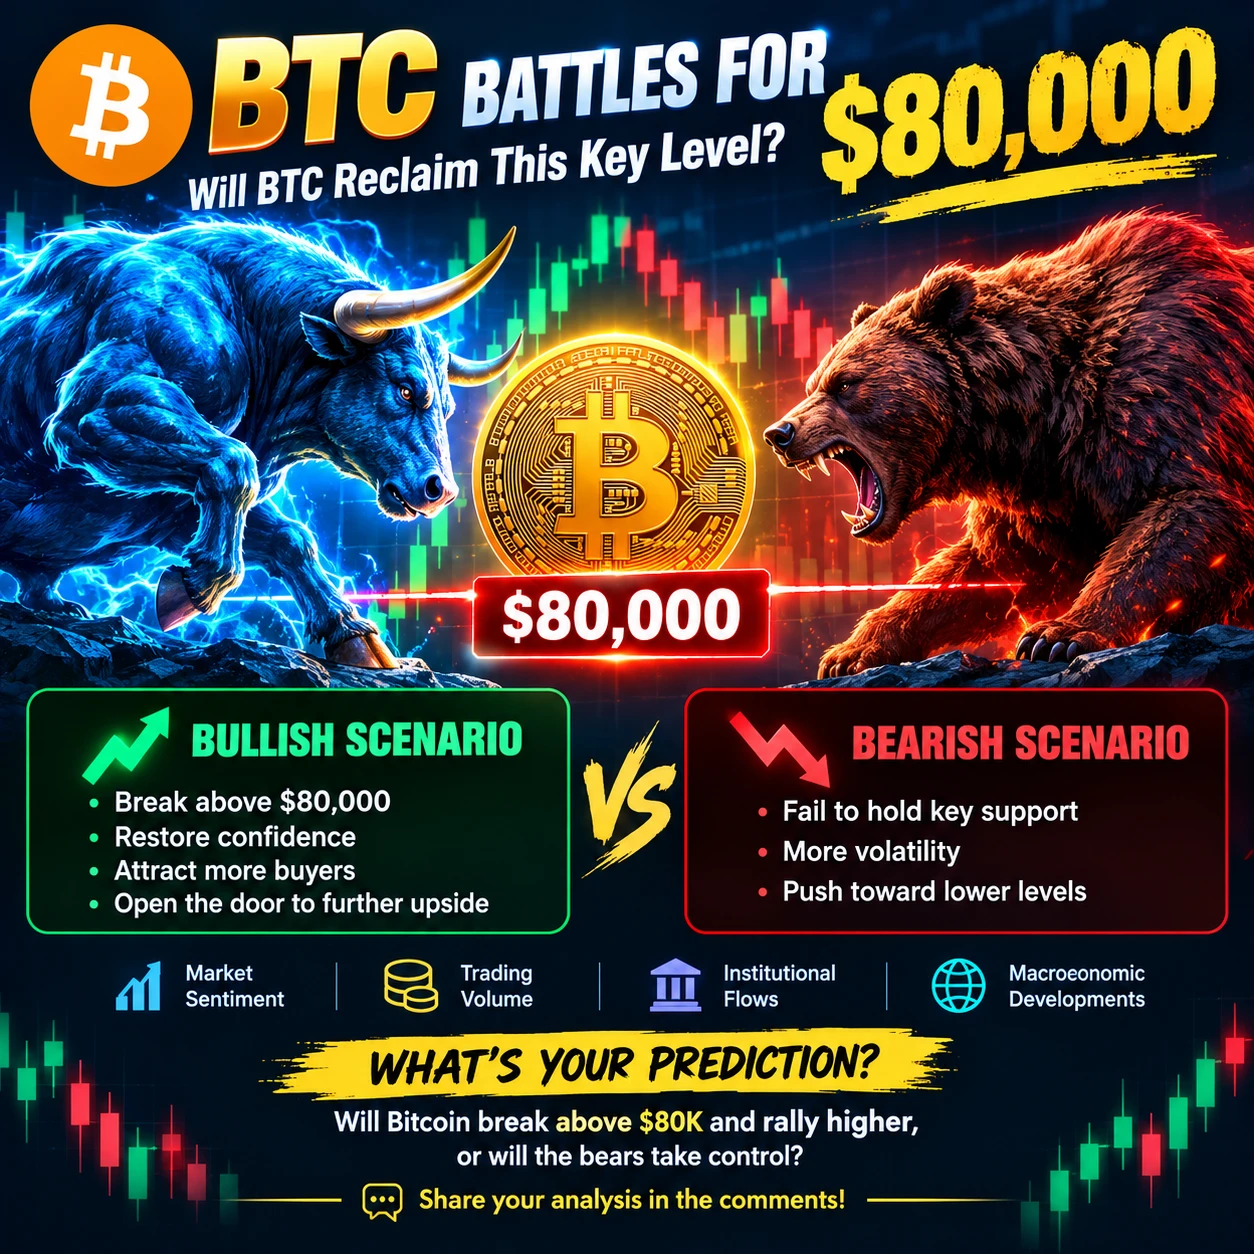
#BTCBattlesFor80000 📊 Bitcoin Battles for $80,000: Will BTC Reclaim This Key Level? 🚀
Bitcoin is facing a critical battle around the $80,000 mark as bulls and bears compete for market control. Traders are watching closely to see whether BTC can reclaim and hold this important psychological level or face another wave of selling pressure.
🐂 Bullish Scenario: A strong breakout above $80,000 could restore confidence, attract buyers, and open the door to further upside.
🐻 Bearish Scenario: Failure to hold key support could trigger additional volatility and push Bitcoin toward lower price levels
post-image
BTC-0.67%
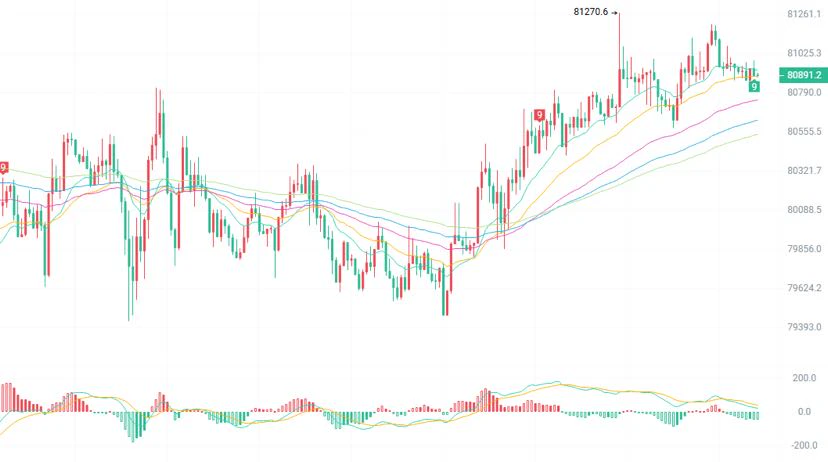
$BTC Bitcoin is at 80928 today, stuck in no man's land
On the 2-hour chart, after climbing out of the 79178 hole, the price has moved back above the EMA15, EMA30, and EMA60 moving averages. The MACD red bars have expanded to 220, and the bulls are recovering. But overhead, EMA90 at 80960 and EMA120 at 81189 form a double wall that remains intact.
The 15-minute chart shows more detail: the moving averages are all aligned bullishly, but the MACD has turned green. Short-term traders who bought the rally from 79178 to 81270 are taking profits. The Bollinger Bands have tightened to less than 300 b
post-image
BTC-0.65%
I probably shouldn't be revealing this, but f*ck it.
If you're serious about making money online with AI, this is the best video that I've ever made.
This will make the right person rich.
Watch now 👉
post-image
#SKHynixQ3RevenueHitsRecordHig
h #SKHynixQ3RevenueHitsRecordHigh 📈💾
SK Hynix Q3 Revenue Hits Record High: The AI Memory Boom Continues!
The global technology industry is witnessing a major transformation as demand for artificial intelligence continues to grow. SK Hynix is attracting significant attention after its third-quarter revenue reached a record high, highlighting the growing importance of advanced memory chips in today's technology market.
Artificial intelligence is changing how companies build data centers, develop software, and process enormous amounts of information. Behind these
SK Hynix+10.88%
  • 3
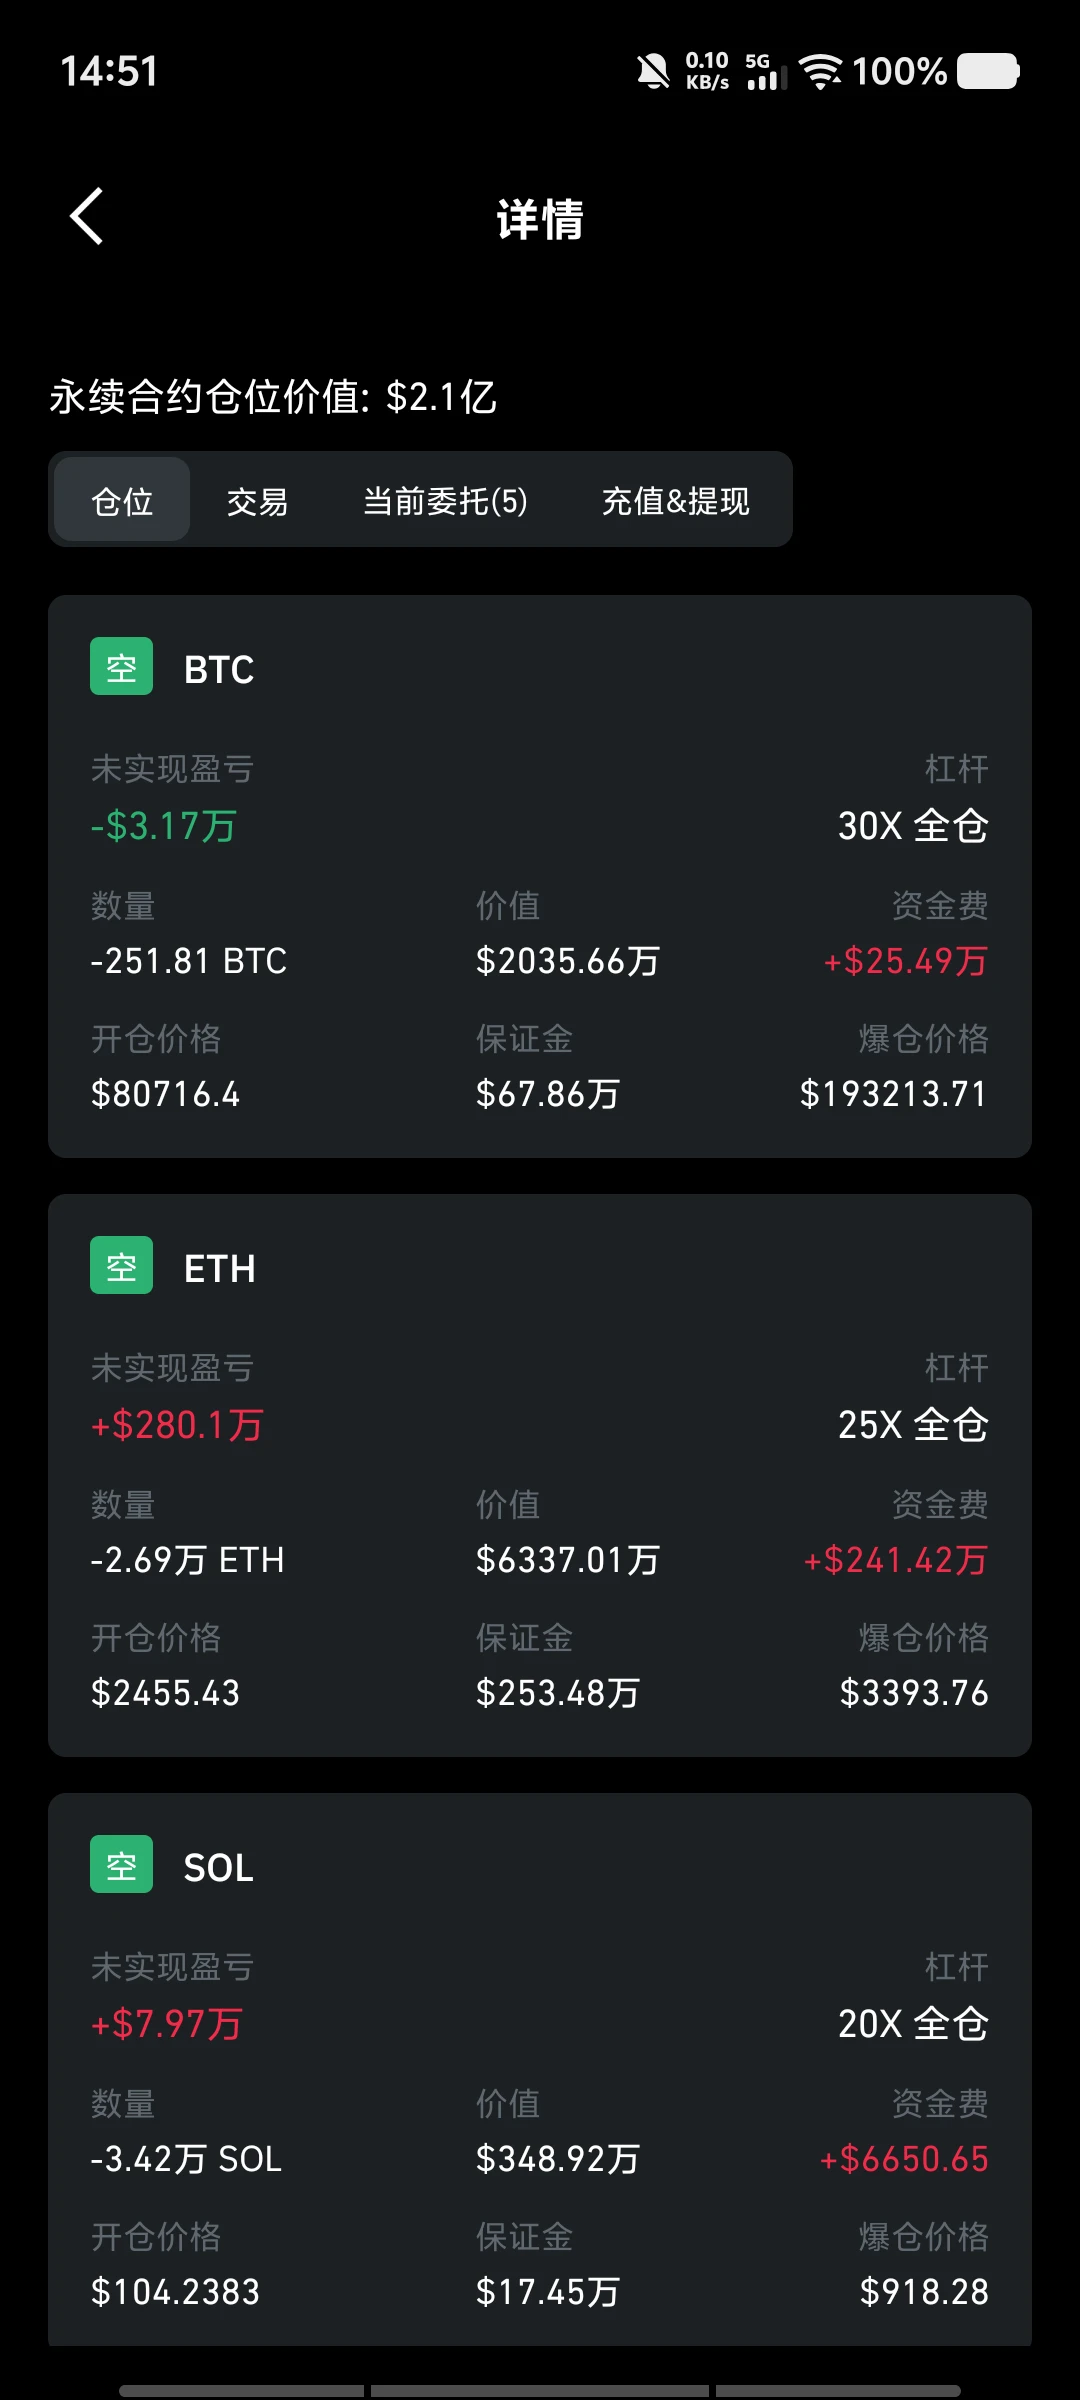
The short-selling whale’s largest position is currently a $ETH short, holding approximately 26,900 ETH worth about $63.37 million, with 25x leverage and an average entry price of about $2,455. The position is currently up approximately $2.8 million, accounting for over 60% of the whale’s total unrealized profits. The ETH short uses cross margin, with a liquidation price of approximately $3,393.
#SK海力士Q3营收创历史新高
post-image
ETH-1.23%
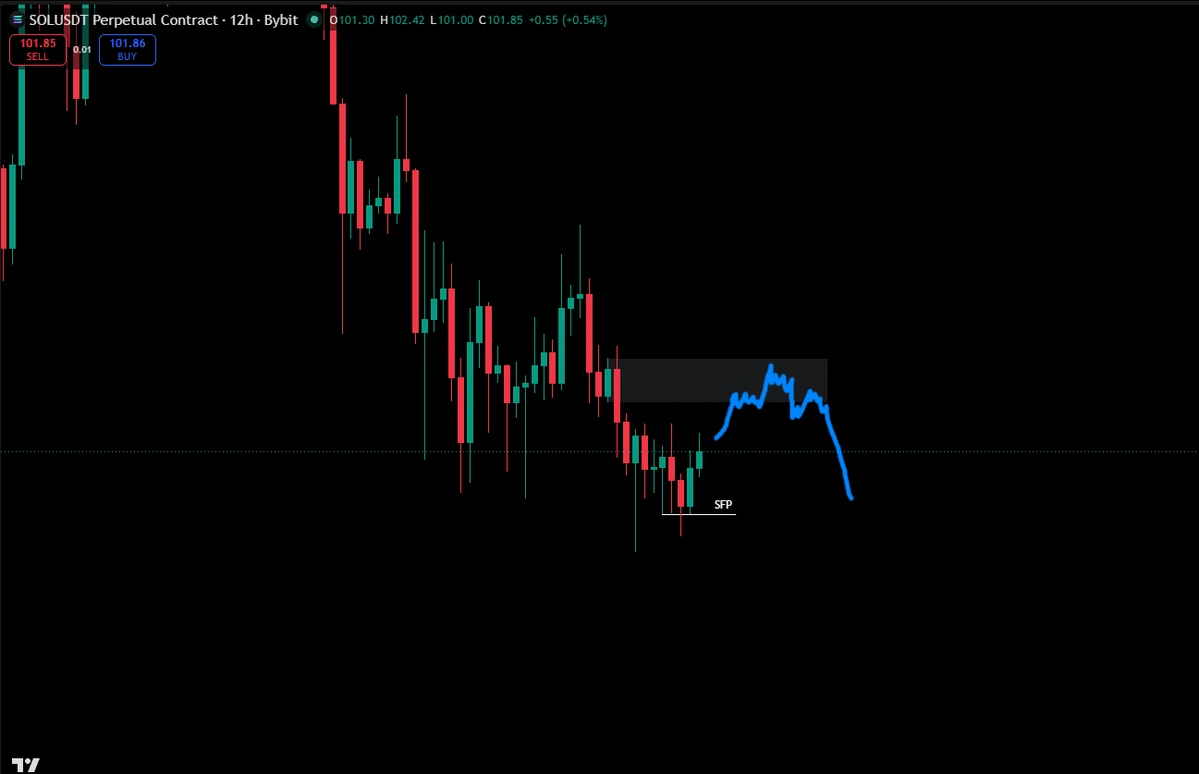
solana:So11111111111111111111111111111111111111112 has swept the lows and is now moving up.
Unfortunately, I missed the long.
I think the draw is now up into resistance at $103.40-$104.90.
post-image
SOL-0.77%
BTC Market Update
live-cover
LIVE1,831
gm web2 🔥
what would you do if you had a wayback machine?
post-image
All the wages I worked so hard to earn went into blind boxes.
POP MART is still going strong. Its market cap of over 170 billion is built on consumption downgrading, somewhat like the lipstick effect during World War II. People can’t afford big-ticket luxury goods, but most can still afford a blind box costing tens or hundreds of yuan. Spending a little to buy emotional value is a pretty good business.
post-image
POP MART-0.83%
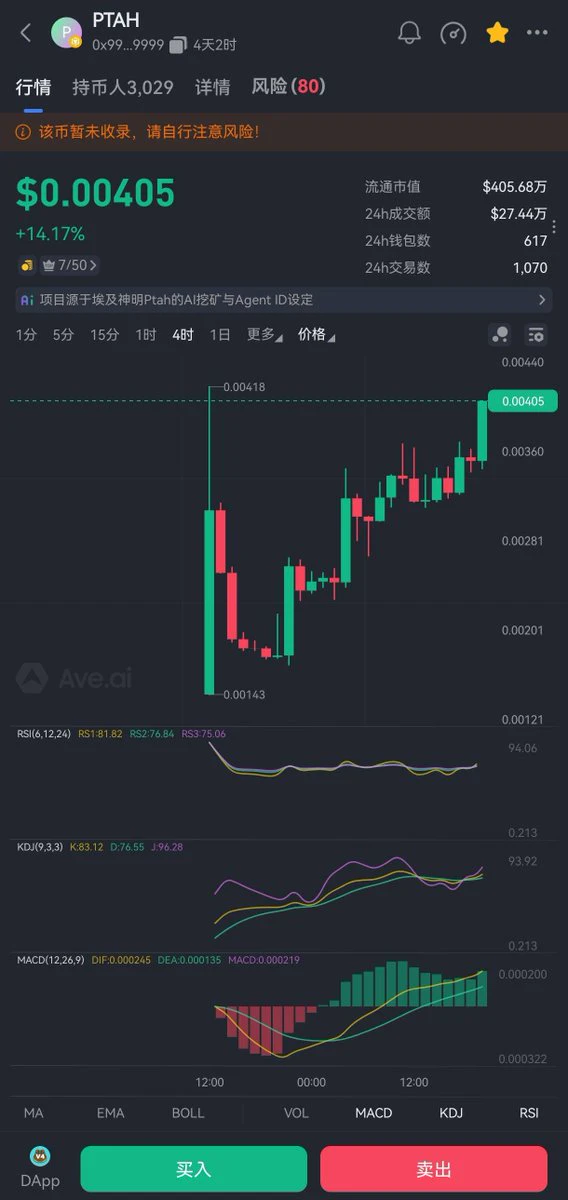
$PATH It hit a new high—what world problem did it solve?
@Ptahtrade
post-image
PATH-1.57%
Yesterday, Old Zhang said to go long on a pullback to 11.2$KORU , while those of you trapped after shorting at 10.5 are being held over a fire by the big players! How do you get out?
Yesterday, when KORU spiked to 11.88 and pulled back, with the whole internet lamenting, Old Zhang said: “The big players used the positive circuit-breaker news to distribute into the euphoria, shake out retail traders chasing the highs, and lure people into shorts.
Whale shorts are heavily loaded with 60 million, and the liquidation chart is packed with accumulated short positions overhead. The big players’ plan:
KORU-1.22%
BTC-0.65%
#GateSquareHalloween
#Gate广场万圣节
THE CHART WENT DARK, BUT THE THOUGHTS DIDN’T.
There is a kind of fear that makes no noise.
It does not appear as a red candle on a screen. It does not flash a warning or announce that something is about to go wrong. It arrives quietly, after a decision has already been made, when the market keeps moving and your mind refuses to move on.
I know what it feels like to close a trade, believing that protecting a profit is the sensible thing to do, only to watch the price continue higher.
At first, I tried to convince myself that I had made the right decision. Afte
  • 3
Those trapped in ETH above are waiting to break even at 2400 to 2440—the very level others are shorting. The biggest fear is a rebound that still falls short of getting them out.
Among the traders I’m watching, Yan Chi moved his BTC short zone down a notch: short from 812 to 823, stop above 833; if stopped out, short again at 845. A couple of days ago, he said it couldn’t close above 82000, and every rebound was a short.
I checked: on October 22, it plunged from 84377 to 80940 and hasn’t risen above 82300 since. The high over five days was 81300. The lower bound is 300 points from the current
post-image
ETH-1.26%
BTC-0.67%
Shill me your Trending #100XGem 💎 ready for Take-off #____🚀
post-image
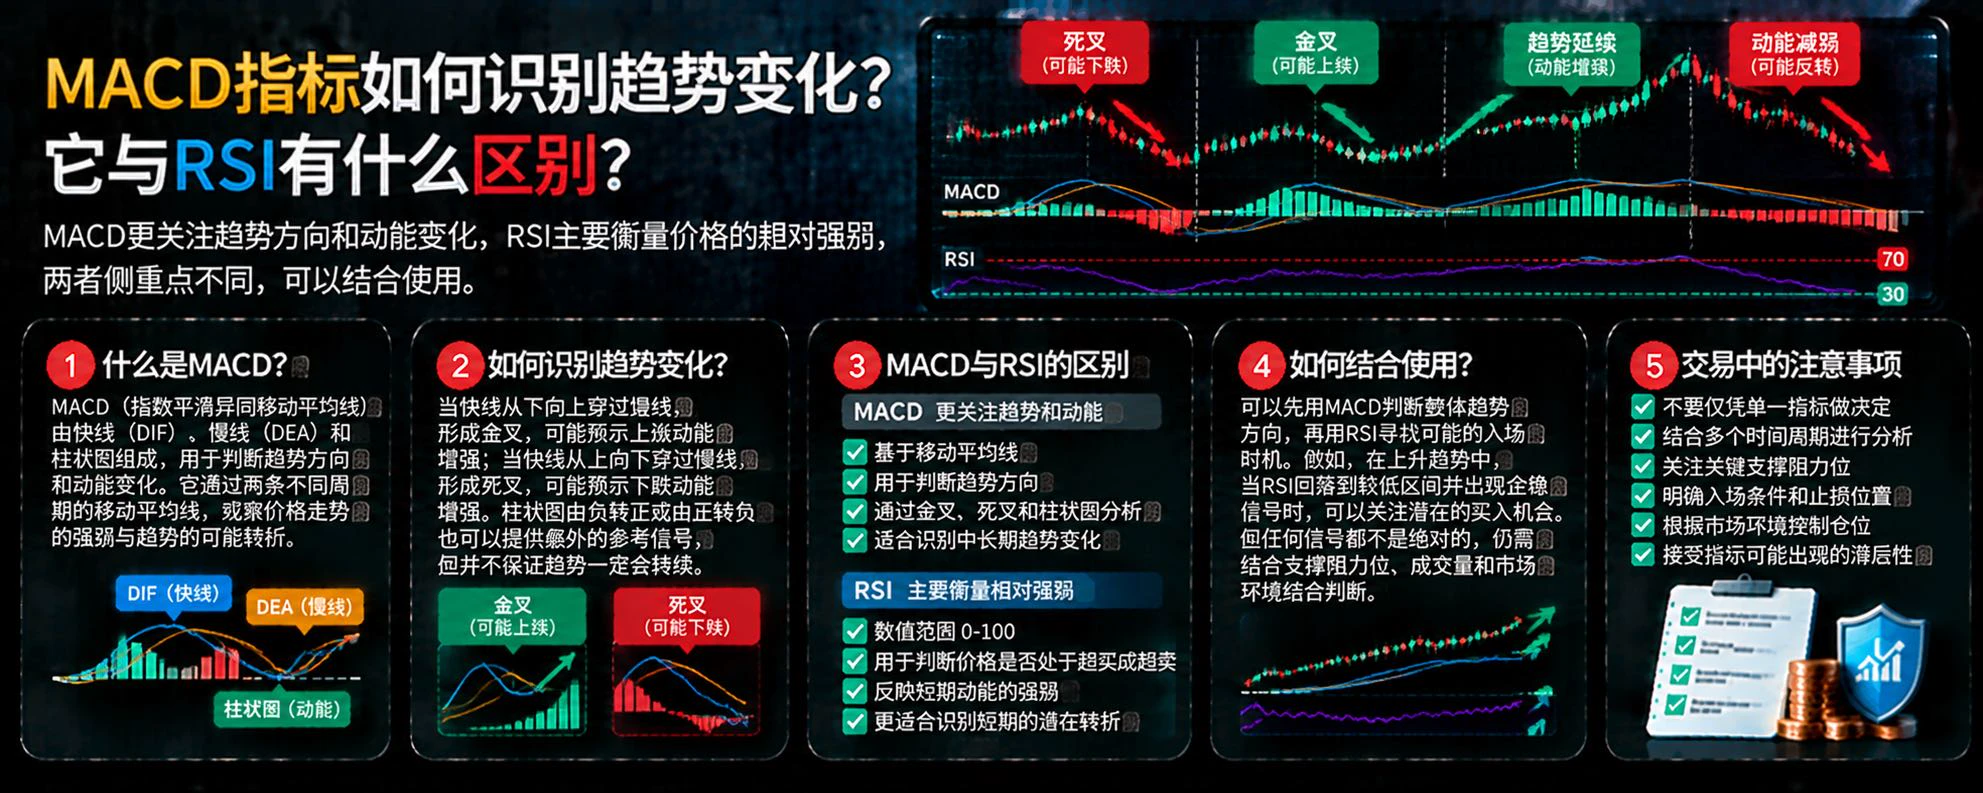
How Can the MACD Indicator Identify Trend Changes? How Is It Different from RSI?
In the crypto market, MACD and RSI are both common technical analysis tools, but they focus on different things. Understanding the differences between them can help traders get a more comprehensive view of trends and price momentum, rather than relying on a single indicator to make decisions.
First, what is MACD?
MACD examines the relationship between exponential moving averages over different periods to track price trends and changes in momentum. It usually consists of the DIF line, the DEA line, and a histogram,
post-image
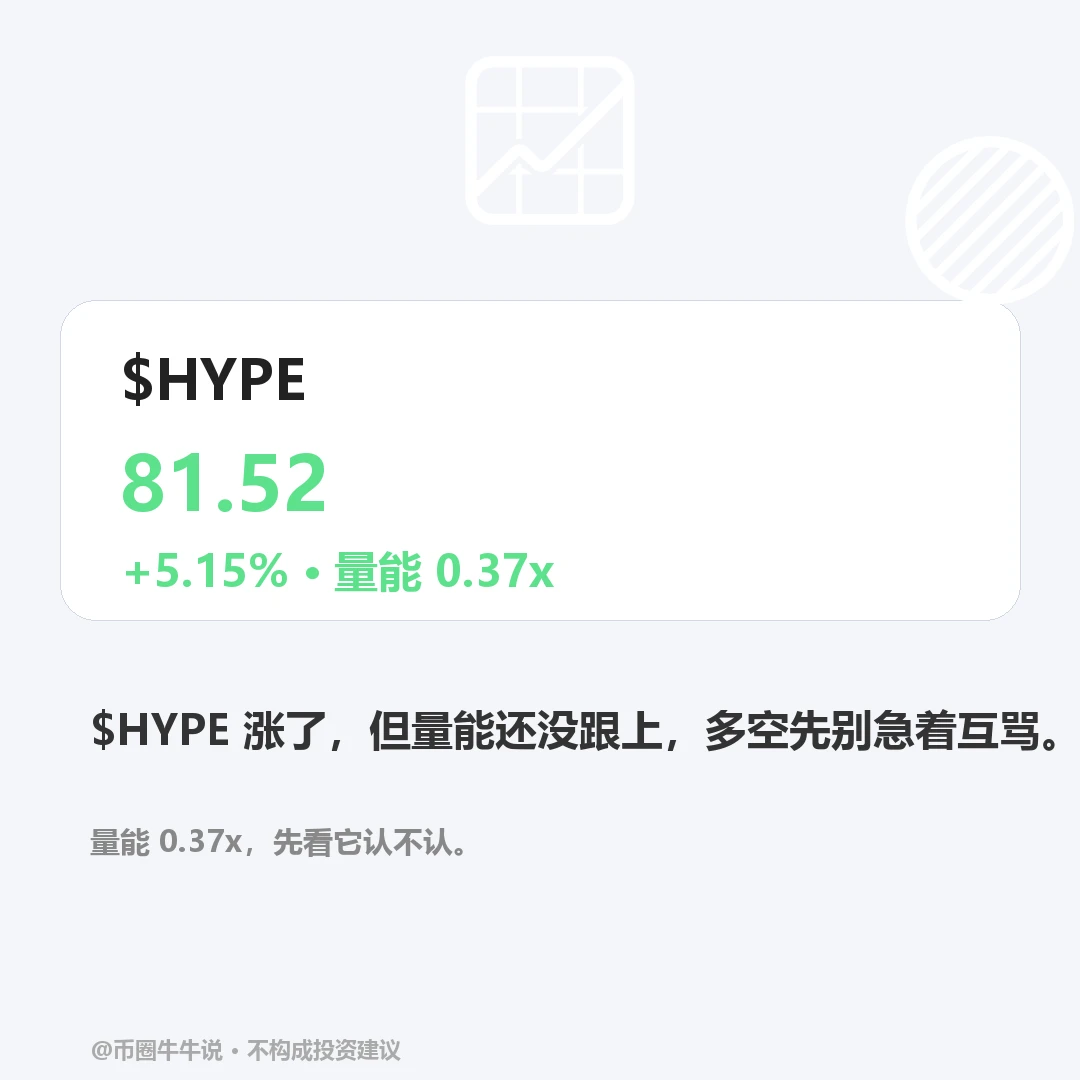
$HYPE After a 5.15% gain in 24 hours, the current price is 81.52, just one step away from the 1-hour resistance at 82.14. But 1-hour trading volume has shrunk to 37% of normal levels. The simultaneous strength and quietness create a divergence that makes the current price especially sensitive.
Trend momentum is bullish across both timeframes (1-hour EMA 80.76/4-hour EMA 78.94), but a breakout above key resistance on declining volume calls for caution. If the price holds above 82.14 with rising volume, it could open up more upside; if it falls below the 77.17 support, short-term strength will b
post-image
HYPE+0.24%
Shill me your 2️⃣0️⃣2️⃣6️⃣ #Altcoin that's ready to Lambo ___? 🚀💼⚡💎
post-image
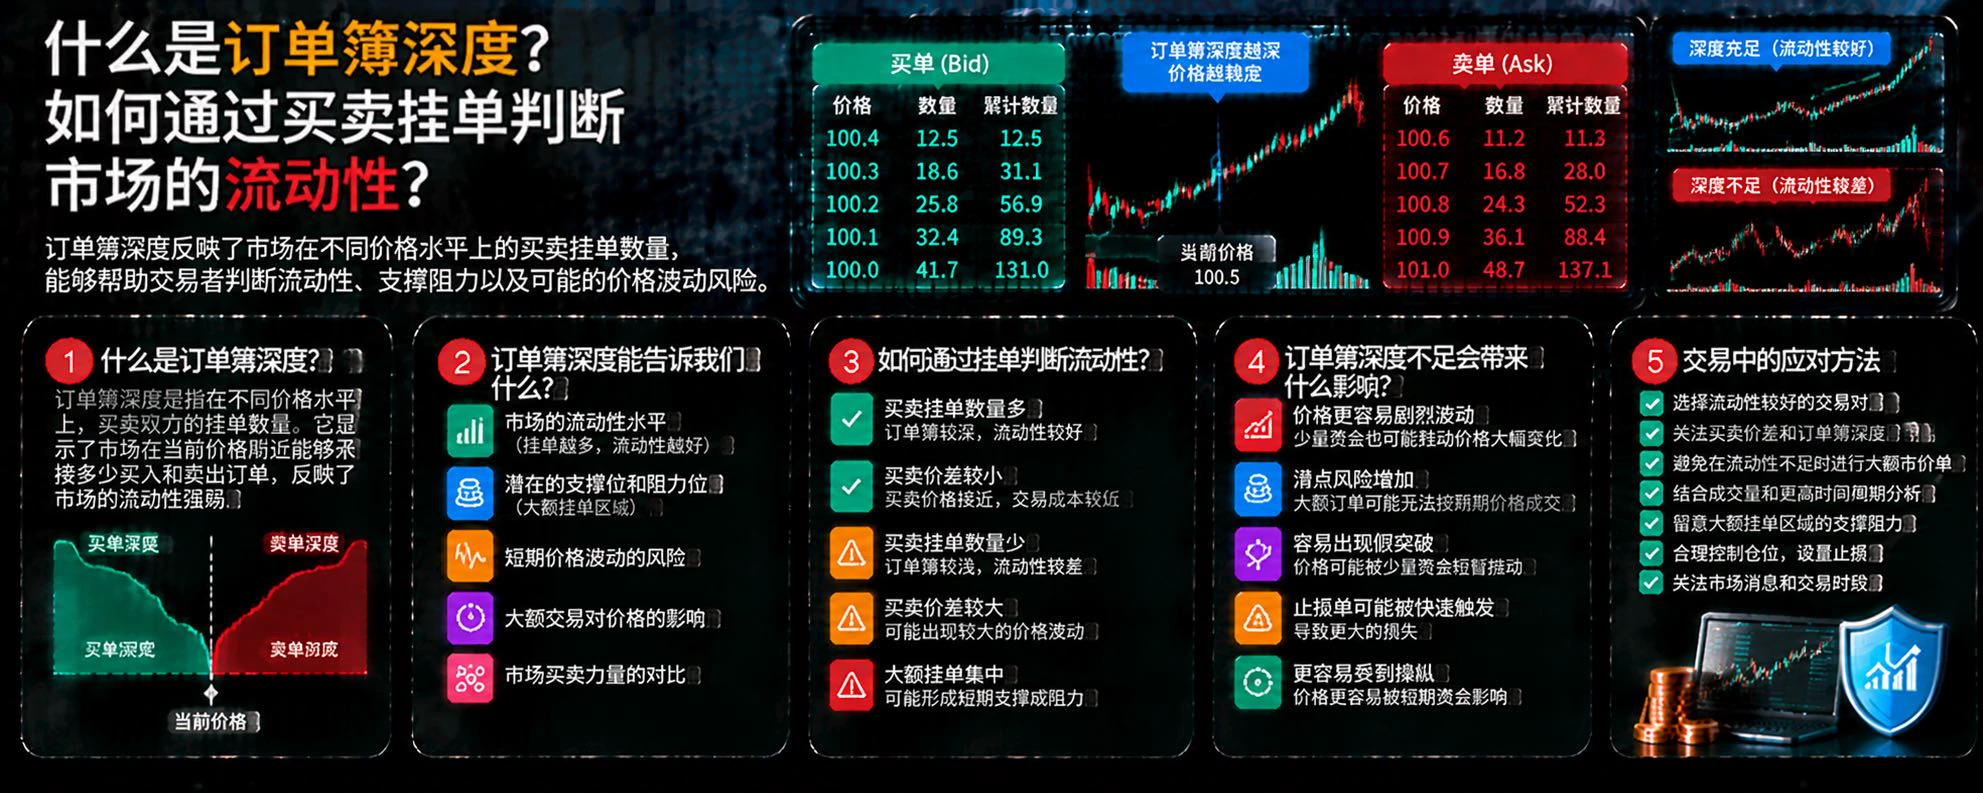
What Is Order Book Depth? How Can Buy and Sell Orders Help Assess Market Liquidity?
In cryptocurrency trading, determining whether an asset can be traded easily requires looking beyond price and trading volume to the order book. The order book shows buy and sell orders at different price levels, helping traders understand market liquidity and the potential price impact of large orders.
First, what is order book depth?
Order book depth reflects the quantity and size of buy and sell orders at different price levels. Typically, buy orders cluster below the current price, while sell orders cluster
post-image
Load More

Join 40 M users in our growing community

⚡️ Join 40 M users in the crypto craze discussion

💬 Engage with your favorite top creators

👍 See what interests you

Trending Topics

FedDecisionCountdown

26.27k Views1.22k Discussing

The Fed will announce its rate decision on October 28 at 18:00 (UTC), followed by a press conference at 18:30 (UTC). Markets widely expect rates to remain unchanged, with attention turning to future policy signals. Could this decision break crypto out of its trading range? What signals are you watching?

GateFirstToLaunchGoldCFD7X23Trading

37.41k Views6.34k Discussing

SKHynixQ3RevenueHitsRecordHigh

2.31k Views2.62k Discussing

View More