Square
Following
Hot
News
Profile
Share your thoughts
placeholder
Article
$SNDK
Rejected from 1,408.95, now holding 1,214.16 support. Price is below all three MAs—bearish structure after a heavy sell-off. Break above 1,272.26 triggers a bounce; failure retests 1,214.16. Momentum fading—wait for confirmation.
Entry Zone: 1,250 – 1,260
TP1: 1,272
TP2: 1,303
TP3: 1,311
Stop-Loss: 1,200
#SNDK #ShareWeekly #USSeptemberPPIBeatsExpectations #GateWCTCS9GlobalTradingCompetition #GateBTCAndETHFuturesVolumeRanksTop3
post-image
SNDK-2.82%
  • 2
🌙⚡ GATE.IO ⚡ HOT TRADER LIVE | BTCS NEXT PRICE SHIFT? ₿🔥 | WHO MAKES THE MOVE? 🐂🐻
live-cover
LIVE1,738
Trenches
AGT
A
bade
b
AGT
0x5d...e274
Market Cap
$.
Change
.
24h Vol
$.
Holders
.
CNPY
C
bade
b
CNPY
0xc6...ddd2
Market Cap
$.
Change
.
24h Vol
$.
Holders
.
TSI
T
bade
b
TSI
0xa8...1c1e
Market Cap
$.
Change
.
24h Vol
$.
Holders
.
Gato
G
bade
b
Gato
55A3...pump
Market Cap
$.
Change
.
24h Vol
$.
Holders
.
hi
h
bade
b
hi
0x8a...a7f7
Market Cap
$.
Change
.
24h Vol
$.
Holders
.
#WCTCS9 #每周来晒
PAPER at $0.02743: a 129% jump from launch, and what every trader should understand before touching it
PAPER, the token of Papertrade, has been one of the loudest small-cap stories today. It briefly broke above $0.035 and was quoted at $0.02743 at 9:40 a.m. ET on Sunday. Here is a clear breakdown of the numbers and the mechanics behind them.
What happened today
The sequence is simple. HIP-3 market deployer Paragon paid 570.98 HYPE, about $45,000, to win the PAPER ticker, and then launched the PAPER perpetual contract on Hyperliquid's HIP-3 market with up to 3x leverage. It trade
HYPE-1.62%
BTC-0.35%
ETH-1.64%
  • 2
  • 2
The easiest mistake in trading is to mistake a “low-volume recovery” for the “start of a reversal.”

Reviewing today’s ETH trade: entered short at 2425-2445, with the high precisely touching 2428 before price fell all the way to the current low of 2366, delivering the expected 62-point move.
Why short at this level? Because the chart was clear: yesterday’s nearly 100-point dump was followed only by an oversold recovery after the sharp drop, with no fresh capital coming in to drive it higher. And with BTC failing to make a move, 2425-2445 was a solid resistance zone above ETH.

Those who trad
BTC-0.35%
ETH-1.64%
SOL-1.67%
Sunday’s Top Posted #Altcoins 🎗️
1️⃣ $PENGU
2️⃣ $QTC
3️⃣ $Q
4️⃣ $APT
5️⃣ $PROPS
6️⃣ $TAO
7️⃣ $SUI
8️⃣ $SOL
9️⃣ $PRL
🔟 $BTW
1️⃣1️⃣ $UNI
1️⃣2️⃣ $MON
Runner ups: $PONS, $MON, $LIT, $PUMP, $HBAR
#Altseason2026 #Altcoins $DDY
post-image
PENGU-2.84%
QTC+2.77%
APT-3.93%
PROPS-2.59%
TAO-3.06%
#BTC跌破8.2万 Technical read at $81,668: what the chart says about 81K and 80K
BTC is trading near $81,668, and the question on everyone's screen is whether 81K can hold or 80K gets tested next. Here is the technical picture, level by level, with no guesswork.
Where we came from
Early October looked bullish. BTC ran toward $87,000, then was rejected near that level on October 5, which triggered a cascade of leveraged long liquidations. The week's high was $84,323.70 on October 12, and the low was $79,841.60 on October 15, right after the hot CPI (3.7% year over year, core 2.6%). That is a 5.6% we
post-image
BTC-0.34%
$ZEC is trading at 1,096.96 USDT, down 6.27% over 24 hours, while 1-hour trading activity reached 1.61x. That figure looks active, but the price failed to break through the 1-hour resistance at 1,165.04. The current price is already near the 1-hour support at 1,088.69, but resistance still lies ahead.
This makes me more inclined to believe ZEC's decline is only a temporary correction, as it has entered oversold territory. But being oversold is not the same as having bottomed, and one piece of evidence is still needed to confirm the decline has halted. If the price can stop making new lows, the
post-image
ZEC-5.38%
litecoin:native is pressing into the $57.3 – $54.9 support area at the bottom of the falling wedge.
A direct reaction from here or one more dip into the box could set up the breakout above the wedge, aiming back toward 62.
post-image
LTC-1.20%
$APR Down 33% in a day, from 0.042 straight to 0.0275—this isn’t a pullback; it’s a guillotine. The 24h low of 0.0228 was tested once. Trading volume surged to 92M as the price fell, a classic cascade of long liquidations. Technically, 0.0228 is the only needle-point support today, but the high-volume bearish candle closed near the low, and the rebound structure is already broken. Don’t catch a falling knife. Wait for two signals: first, if price stabilizes in the 0.0228–0.0230 range on lower volume and forms a lower wick, consider a small long position, no more than 20% of your portfolio; sec
APR-33.77%
Humanity is truly powerless in the face of time.
The ABSOLUTE worst day in ALL history to buy the Nasdaq $Q was March 27, 2000.
$117.75 a share. The very top of the dot com bubble.
By October 2002 it was $20.06. Down 82%.
It took about 15 years just to get back to even... & that's WITH dividends reinvested.
But if you bought that exact day & did nothing, today it's around $740. About 7x your money with dividends.
Now the person who bought in October 2002 at $20... that's about 37x on price alone.
Same fund. The only thing that changed was the price paid.
That's why I don't buy just because something is going up. I want great companies/ETFs t
post-image
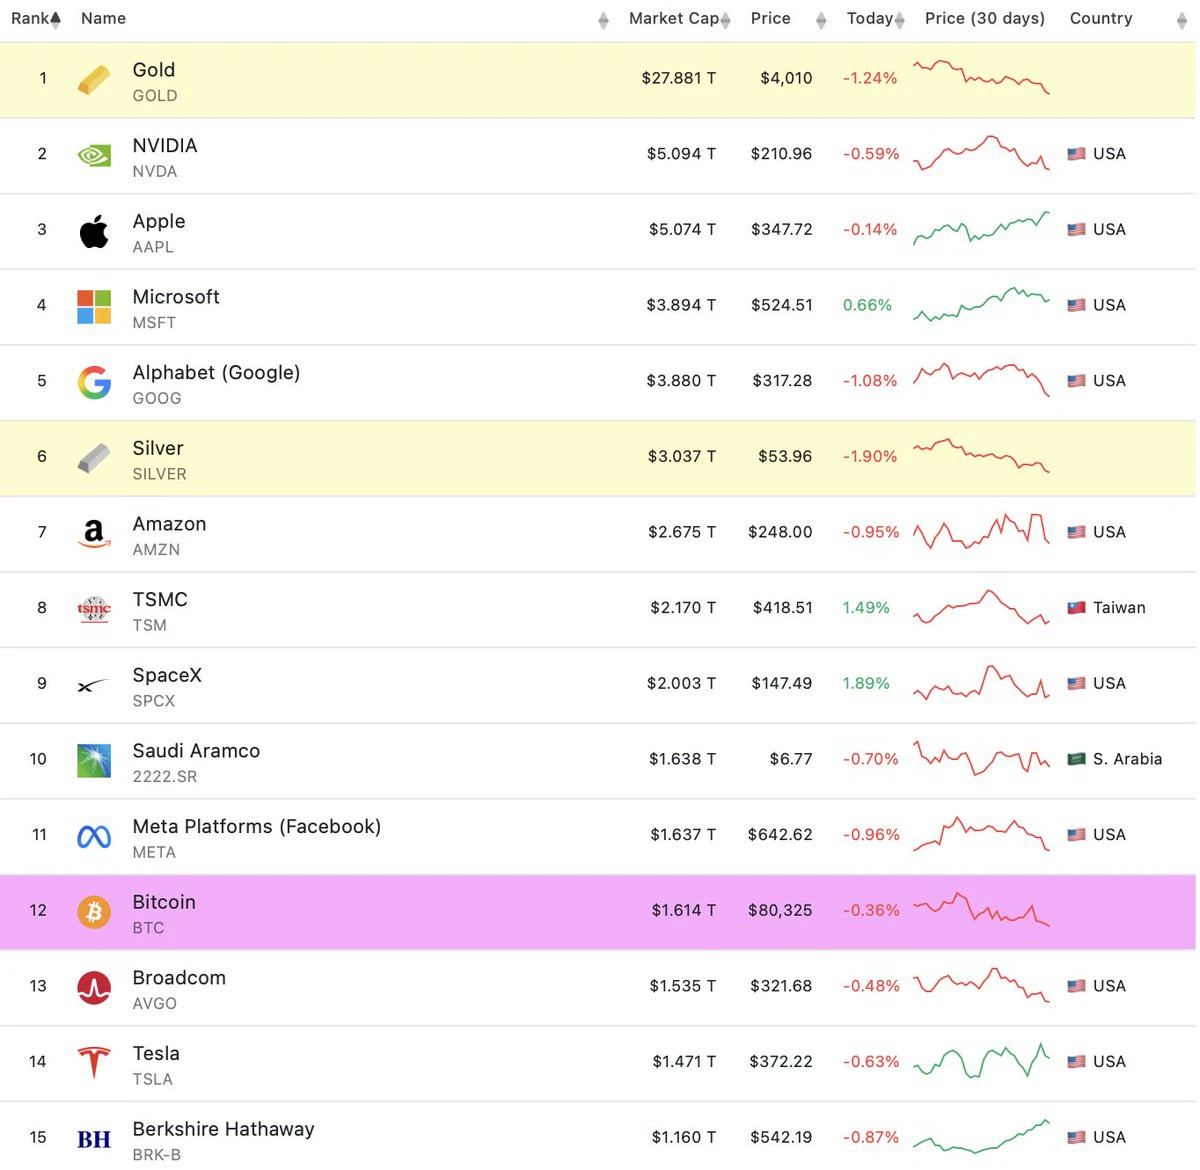
Starlink Mobile could challenge $AAPL (NASDAQ) iPhone sales model by disrupting US carrier subsidies, although the near-term earnings impact appears limited, according to Bank of America.
how $SPCX expansion into mobile connectivity could affect Apple’s pricing power and premium smartphone sales.
AAPL+0.43%
SPCX-1.74%
This whale on Hyperliquid is short BTC ETH GOLD and more with $647 mm
What does he know?
post-image
BTC-0.35%
ETH-1.64%
XAU-0.22%
#aidoge I’ve already launched my infinite grid bot on aidoge
post-image
AIDOGE-4.03%
Is just matter of time when war will start..getting pretty close at this point of time
post-image
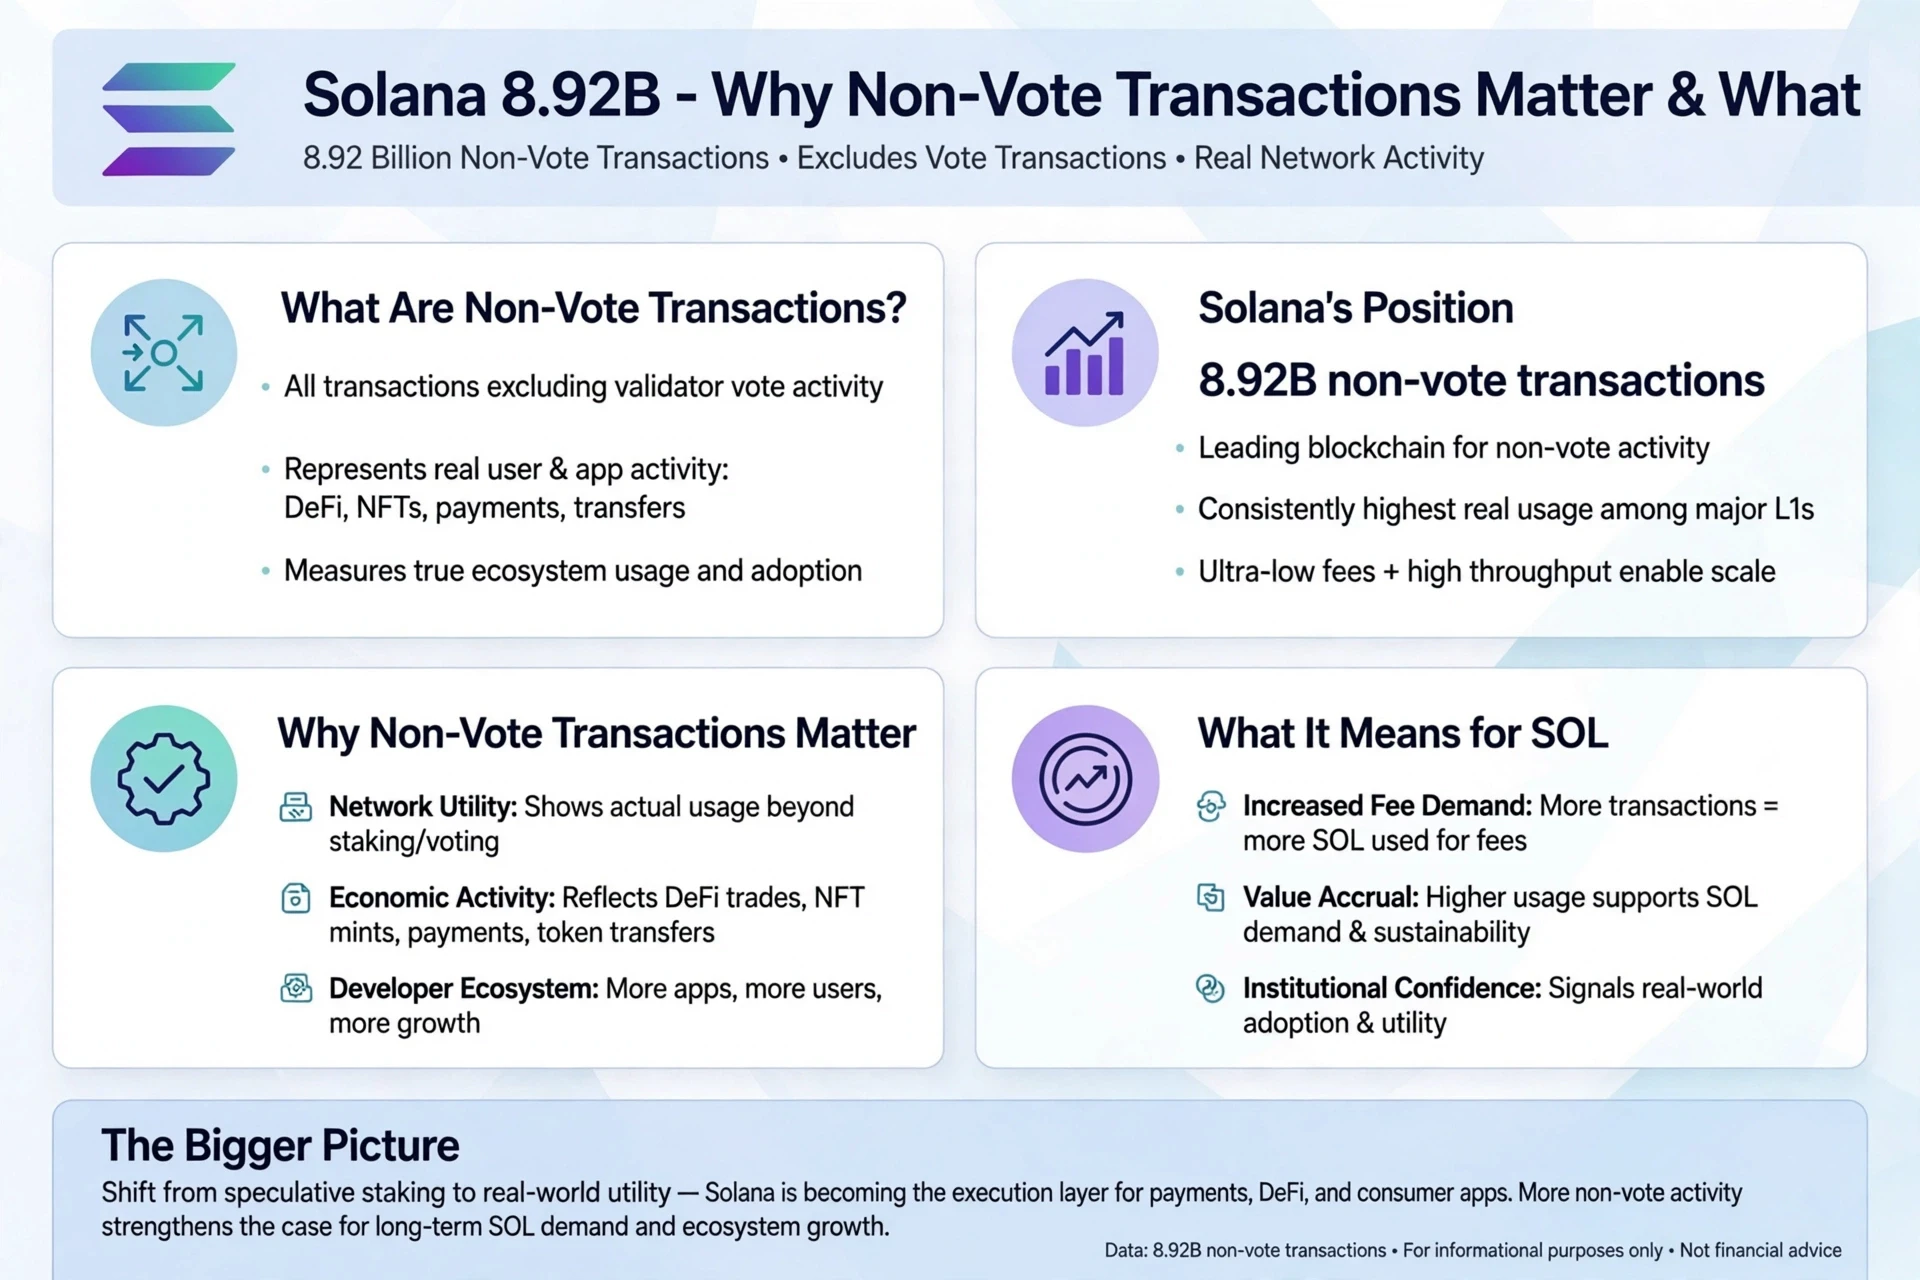
Would you dare buy SOL at $102?
It fell from 125 to 100, ETFs have seen net outflows for 10 straight days, and everyone online is shouting “SOL is over”—but on October 21, an upgrade that can cut confirmation times from 12.8 seconds to 150 milliseconds is set to launch. Is this a dump by market makers using ETFs as cover, or one last shakeout before the upgrade?
First, the surface picture: fundamentals are solid, but money is flowing out.
Down 1-2% in 24 hours, and back from 125 to 100-102 over 30 days. It has fallen from its ATH of 293 to just a third of that. Market cap is about $60 billion,
post-image
BTC-0.34%
ETH-1.64%
SOL-1.66%
A good Sunday short
Run $ZEC to the ground
ZEC-5.30%
Been building a game 🎮
Kathiyawad: No Limits, an open-world game set on the streets of Una & Diu, Gujarat.
So far:
🛺 Drive a chhakdo
🚌 Bus to Diu
🏰 Diu Tourist destinations in 3D
🦁 Gir lions on the farmland
👊 Street fights
More soon 👇
ethereum:native Get your self ready for the deeper correction if the weekly close below the market level in yellow line.
ETH-1.64%
Load More

Join 40 M users in our growing community

⚡️ Join 40 M users in the crypto craze discussion

💬 Engage with your favorite top creators

👍 See what interests you

Trending Topics

USSeptemberPPIBeatsExpectations

91.35k Views1.93k Discussing

US September PPI came in at 6.3% YoY, well above the 5.3% market expectation, pointing to renewed producer-side inflation pressure. Weekly jobless claims were 199K, broadly in line with forecasts. Could hotter inflation further reduce room for rate cuts, and what does it mean for $BTC, US stocks, and gold?

GateWCTCS9GlobalTradingCompetition

37.87k Views6.8k Discussing

GateBTCAndETHFuturesVolumeRanksTop3

53.8k Views1.91k Discussing

View More