
Square
Following
Hot
News
Notifications
Profile
Share your thoughts
placeholder
Article
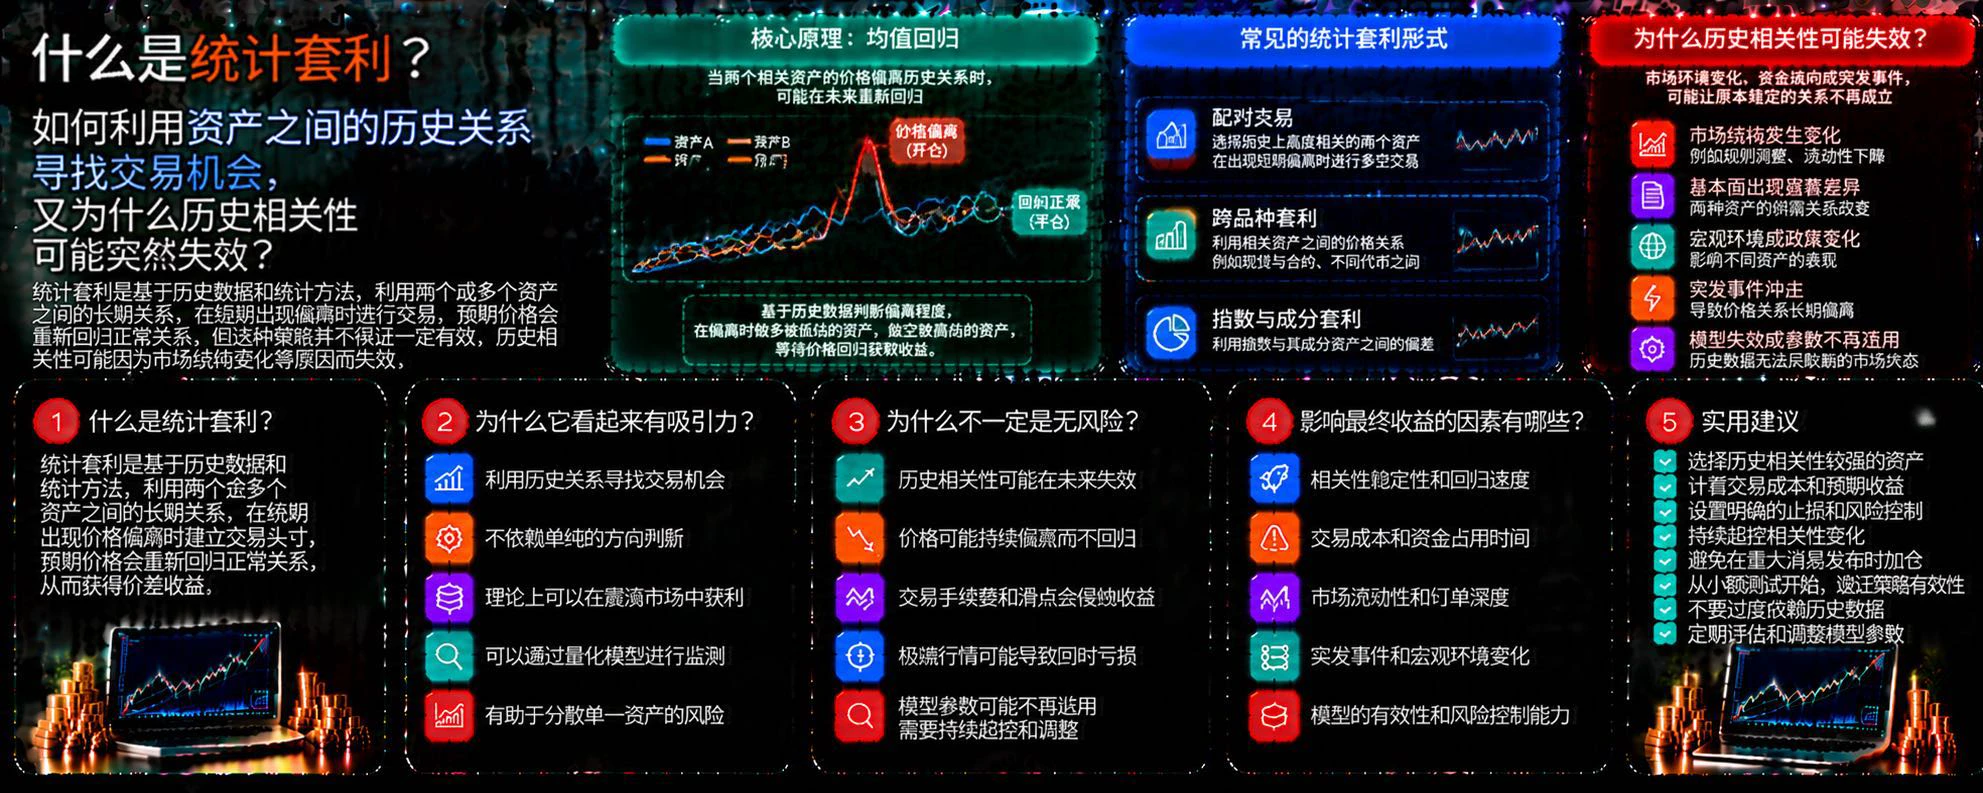
What is statistical arbitrage? How can historical relationships between assets be used to identify trading opportunities, and why might historical correlations suddenly break down?

In the cryptocurrency market, some assets have displayed similar price movements over long periods. When their historical relationship temporarily diverges, traders may try to capitalize on that divergence. This is the basic idea behind statistical arbitrage, but historical patterns do not guarantee future repetition.

First, what is statistical arbitrage?

Statistical arbitrage is a type of trading strategy that u
post-image
$NVDA DCA now, go heavily long again. When you’re in profit later, remember to thank me. Stop-loss: $159 Take-profit: $170 - 180
post-image
NVDA-0.35%
Trenches
mihao
m
bade
b
mihao
4Cxj...pump
Market Cap
$.
Change
.
24h Vol
$.
Holders
.
AGT
A
bade
b
AGT
0x5d...e274
Market Cap
$.
Change
.
24h Vol
$.
Holders
.
FOOD
F
bade
b
FOOD
FTu5...pump
Market Cap
$.
Change
.
24h Vol
$.
Holders
.
IDOL
I
bade
b
IDOL
0x3b...ab07
Market Cap
$.
Change
.
24h Vol
$.
Holders
.
AI
A
bade
b
AI
2T56...pump
Market Cap
$.
Change
.
24h Vol
$.
Holders
.
For the subscribed trade short from 3920, reduce the position and set a breakeven stop-loss
post-image
  • 2
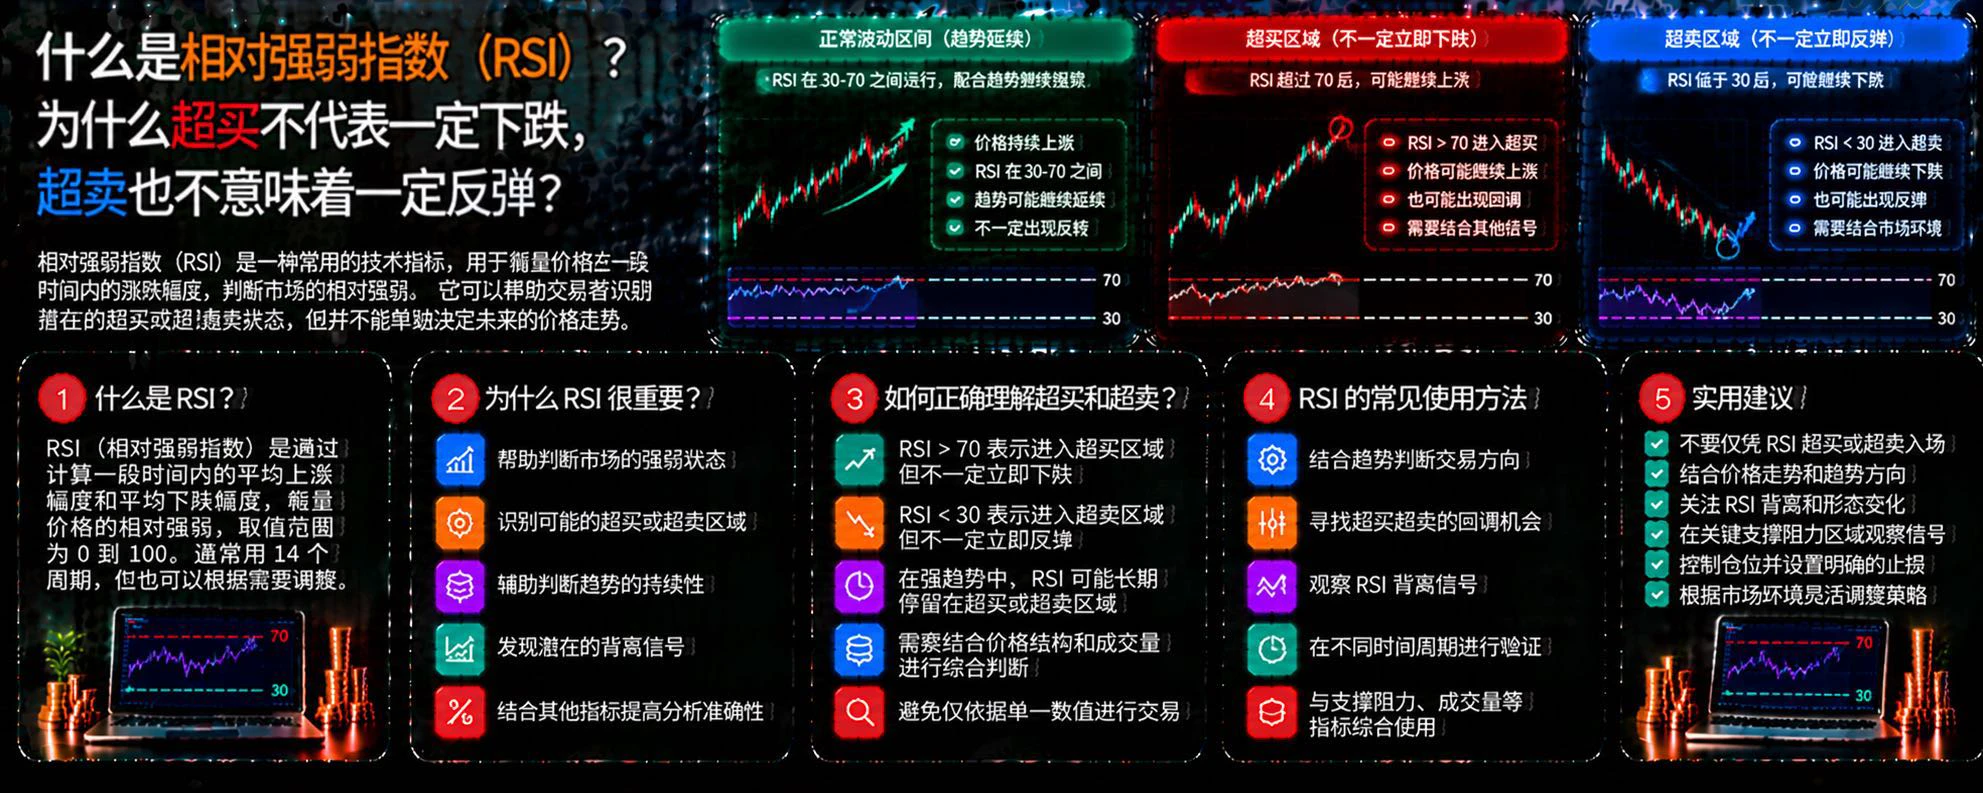
What Is the Relative Strength Index (RSI)? Why Don’t Overbought Conditions Guarantee a Drop, or Oversold Conditions Guarantee a Rebound?

In cryptocurrency trading, RSI is a common technical analysis indicator that can help traders observe price momentum. But many people see RSI above 70 and immediately go short, or below 30 and rush to buy the dip, only to see the opposite of what they expected. The problem is that an indicator reflects market conditions, not an inevitable price reversal.

First, what is RSI?

The Relative Strength Index (RSI) typically ranges from 0 to 100 and measures the r
post-image
Market summary in one post 1️⃣
#BTC
#البتكوين
It has reached reversal zones 💎
Strong ones. So far, it has hit all correction targets; the reversal remains
and targets reach up to 98,000, God willing. Then I’ll update
#ETH
#الاثيريوم
It has also reached reversal zones; a very good opportunity
The next target is $3400
Then I’ll update
#TOTAL
Altcoin liquidity has also reached key levels, and some are at definite, clear bottoms. An opportunity for anyone with cash 💰. The next bounce for some coins will erase the drop so far; in fact 🔄 some coins will gain around 400%_500%
on the next bounce
BTC-0.67%
ETH-1.26%
BTC falls below $70k; can tonight’s 21:30 PPI print a long wick on the weekly candle?

Could a sharp rebound play out over the weekend? US PPI tonight could be an important catalyst.

BTC has fallen to $69,199, down 6.02% in 24 hours, with a low of $67,568, about 5.4% below the 200-day moving average at $73,137.
#美国10月PPI即将出炉
First, the US October PPI release at 21:30 tonight, with four key data points:

Strongly bullish: Headline ≤0.2%, core ≤0.2%. If inflation comes in clearly below expectations and the dollar and Treasury yields fall in tandem, BTC could quickly reclaim $70,500–$71,500 and
post-image
BTC-0.65%
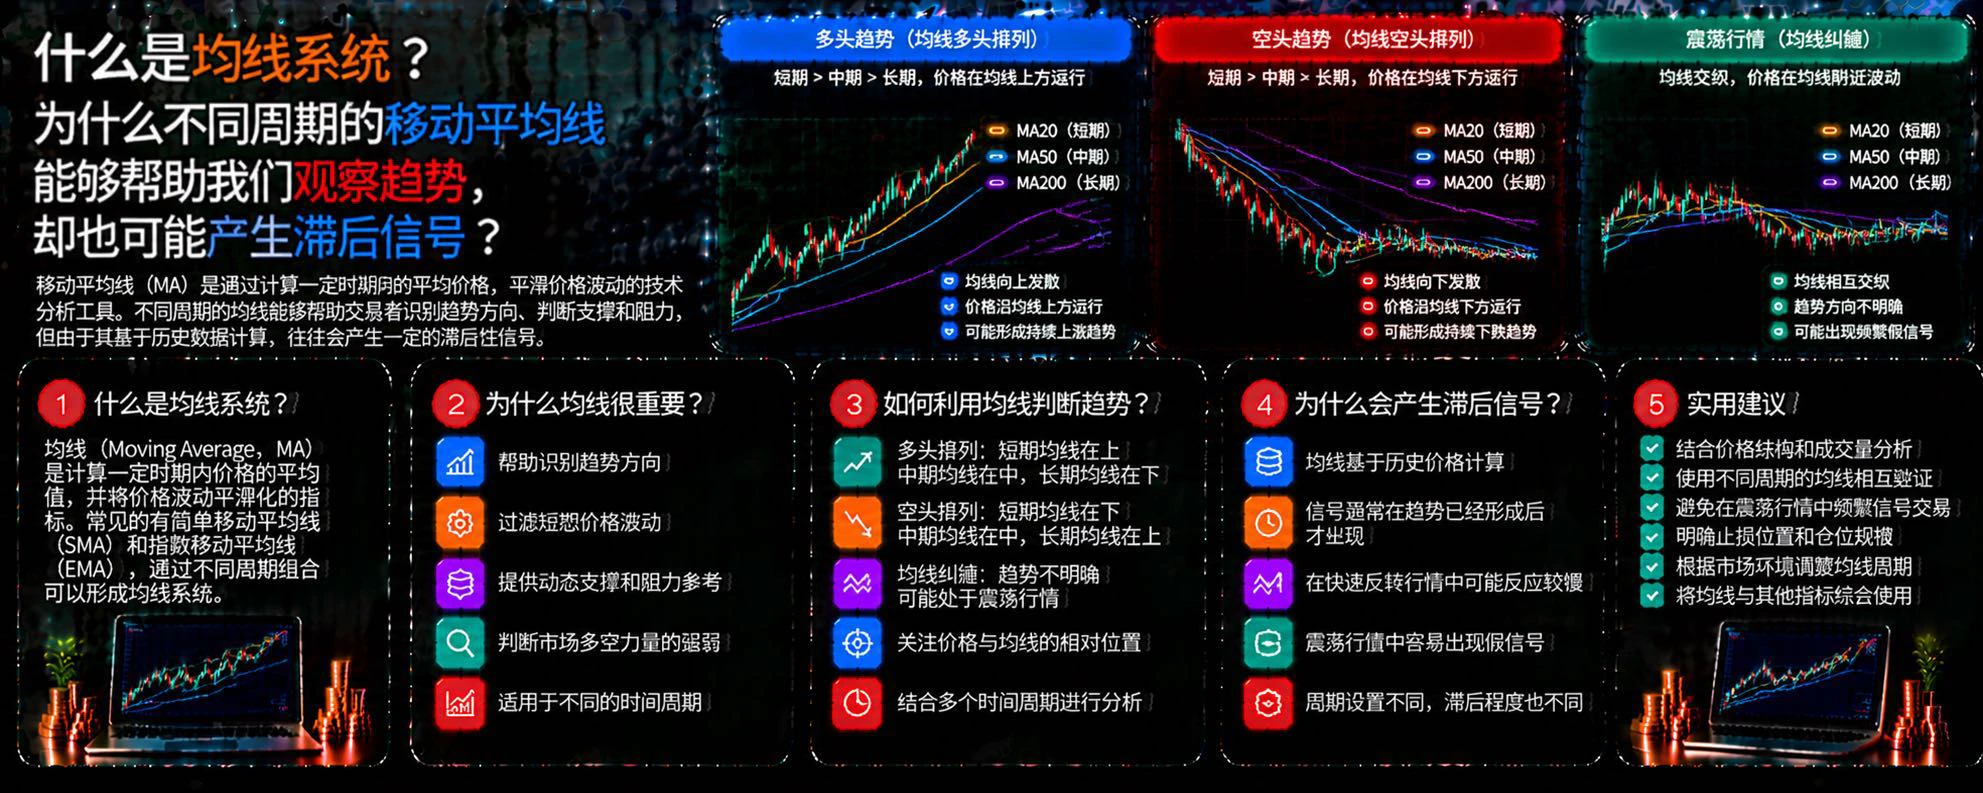
What is a moving average system? Why can moving averages of different periods help us observe trends, yet also produce lagging signals?

In cryptocurrency trading, prices fluctuate every day, and short-term rises and falls can easily cloud our judgment. Moving averages calculate the average price over a set period to help traders observe market direction. But because moving averages are calculated from historical prices, they are better suited to helping identify trends than to accurately predicting the future.

First, what is a moving average system?

A moving average (MA) is a curve formed b
post-image
#SOL
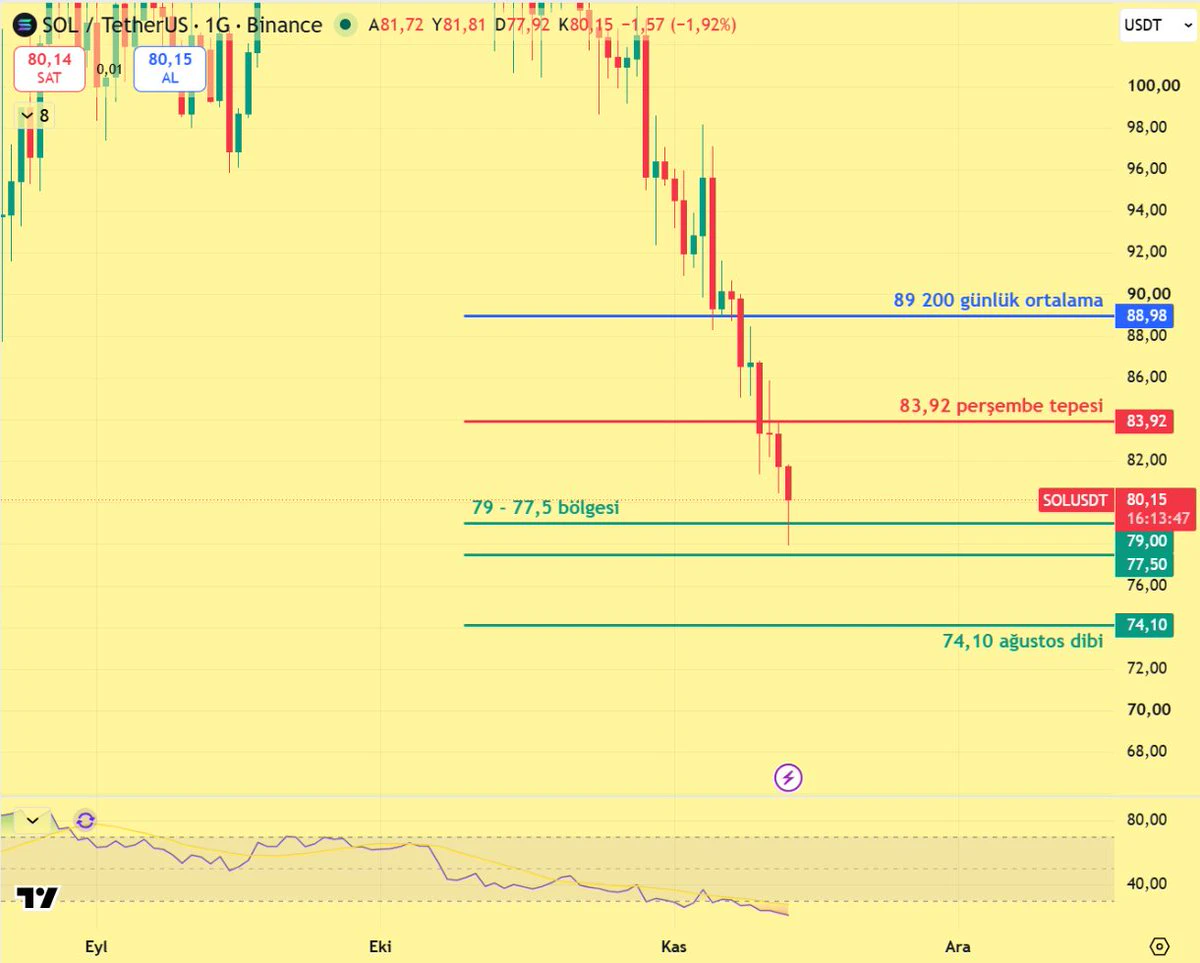
The price fell into the 79 - 77.5 zone.
Guys, Solana $SOL fell to 77.92 on Friday morning, then returned to around 80. Daily RSI is 21. The 79 - 77.5 zone I mentioned earlier held on the first test.
If the zone is lost on a daily close, the 74.10 level I marked on the chart will be the target. This is the August 16 low.
The first rebound level is 83.92. Above that is the 200-day moving average at 89.
Continuing to monitor.
Not investment advice.
post-image
SOL-0.77%
What Can Futures Premiums and Discounts Really Reveal About the Market?

In the crypto market, when looking at Bitcoin or Ethereum futures prices, you may notice that futures prices are sometimes higher than spot prices and sometimes lower. This difference is known as a premium or discount, and it is an important starting point for understanding the derivatives market.

But note that a premium does not mean the market is bullish, and a discount does not mean it is bearish. What really matters is understanding why the spread forms and how it changes with market conditions.

First, what is a pre
post-image
BTC-0.65%
ETH-1.23%
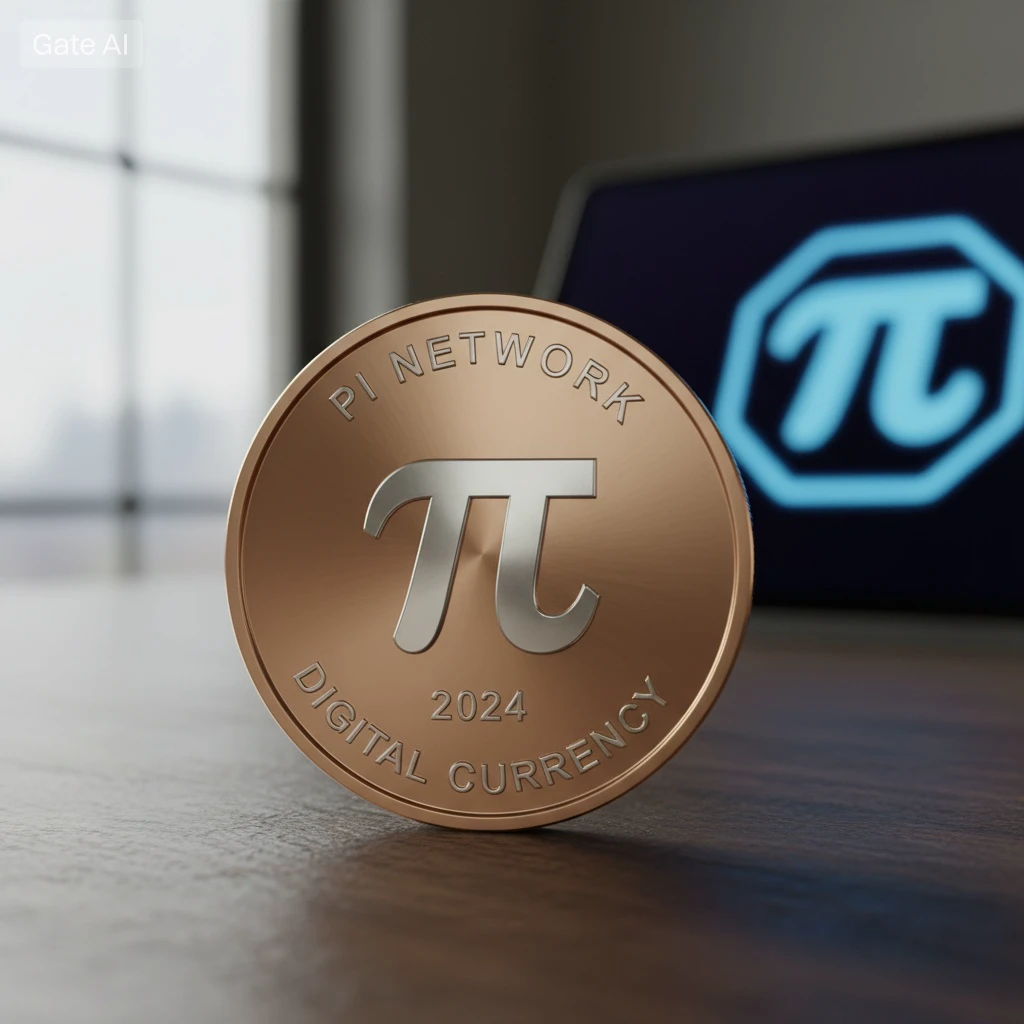
My friend has 200 Pi, brags daily. I have 5000 Pi, I stay quiet. Loud people have little, quiet people have a lot. Are you loud or quiet about your Pi? How much you got really?
#PiNetwork
#ShareWeekly
#GateSquare
#WCTCS9
post-image
PI-0.60%
  • 1
$SPACEHOOD What the hell? It automatically closed my position. I didn't do anything, and dozens of U are gone
post-image
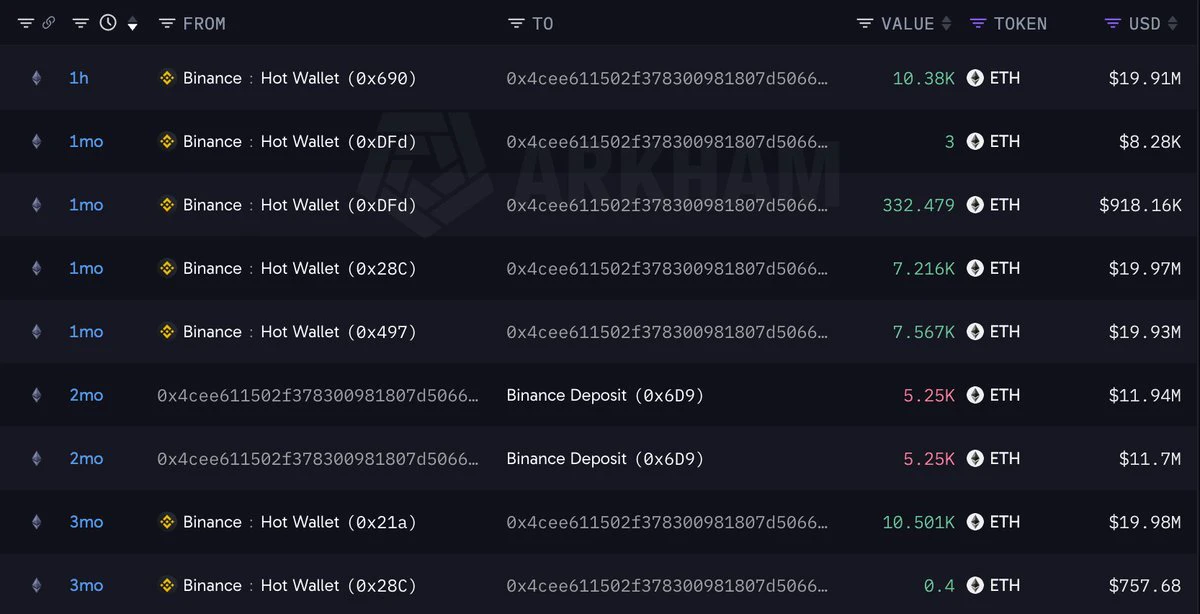
Whale 0x4cee, who made $3.66M buying low and selling high on 10,500 $ETH ($23.64M) 2 months ago, bought another 10,380 $ETH ($19.91M) just 1 hour ago.
The whale has now accumulated 25,498 $ETH ($49.44M) at an average price of $2,382 and is sitting on $11.3M in unrealized losses.
post-image
ETH-1.26%
Today Market update
live-cover
LIVE2,153
$BTC will never go below $70k
Cho Cho Cho 🤣😀🤣
Where is their tears 😂
post-image
BTC-0.67%
$ETH is showing signs of recovery after a sharp sell-off. On the 1-hour chart, bearish pressure remains heavy, with the price at one point pushed down to the support zone near $1,900. However, the latest bullish candles suggest buyers are tentatively stepping in. The key is whether the price can decisively move above $1,960—only a breakout above this level would truly open up the rebound structure.

Reference trading range: entry at $1,935–$1,945, target at $1,980, with defense at $1,910.
Position for the $ETH contract based on this setup, but wait for confirmation before acting.
Risk warnin
post-image
ETH-1.23%
A storm is brewing.

The morning strategy was firmly bearish, and the order book broke down as expected. Bollinger Bands are opening and diverging downward, while the Wyckoff distribution structure has entered an acceleration phase. On top of CPI coming in above expectations and driving Treasury yields higher, a stronger U.S. Dollar Index is weighing on risk assets. With multiple forces converging, the bearish trend is now firmly established.

Don’t try to call the bottom against the trend; stay within the boundaries of the structure. The market always rewards those who are prepared. $BTC
BTC-0.65%
What Is Overfitting? Why Can More Perfect Parameters Make a Strategy More Fragile?

A trading strategy performs almost perfectly in historical backtests, with a high win rate, a smooth equity curve, and a small maximum drawdown. It seems to have found a market pattern. But once it enters the real market, it may suffer frequent losses. One important reason behind this is overfitting.

First, what is overfitting?

Simply put, it means a strategy has adapted too closely to specific fluctuations and random events in historical data, without actually extracting patterns that can continue to work ov
post-image
Nvidias Valuation Falls to a 14-Year Low as Shares Retreat Over 30 From Their Record High! Is This a
live-cover
LIVE2,143
What is arbitrage trading? Why doesn’t a price difference for the same crypto asset across different markets necessarily mean there is risk-free profit?

In crypto markets, the same asset may have different quotes on different exchanges, and spreads may also exist between spot and futures markets. Arbitrage trading seeks to profit from these differences, but in practice, fees, slippage, transfer delays, and market volatility can all make seemingly certain profits disappear.

First, what is arbitrage trading?

Arbitrage trading is a strategy that seeks to profit from price differences between d
post-image
Load More

Join 40 M users in our growing community

⚡️ Join 40 M users in the crypto craze discussion

💬 Engage with your favorite top creators

👍 See what interests you

Trending Topics

JensenHuangResigns

510.8K Views7.9K Discussing

Jensen Huang has resigned as NVIDIA CEO and stepped down from the board. CFO Colette Kress will serve as interim CEO while NVIDIA considers internal and external successors. $NVDA fell more than 10% in premarket trading following the announcement. With one of AI’s most influential leaders stepping aside, markets are now reassessing NVIDIA’s leadership stability, AI strategy, and long-term valuation.

GateIPOAccessAnthropic

277.4K Views2.6K Discussing

Dr.HanOxfordUnionSpeech

144.1K Views427 Discussing

View More