Share your thoughts
placeholder
Article
A-Te is talking trash again. The nonfarm payrolls data gave the Fed a reason to raise rates.
A-Te wants to protect his votes by cutting rates. Whatever he’s trying to do.
I’m siding with A-Te this time—cut rates already, or else, you’re dead meat 😁
post-image
  • 10
  • 1
There is no need to fear occasional storms; the tides rise and fall in their own time
$BTC $ETH
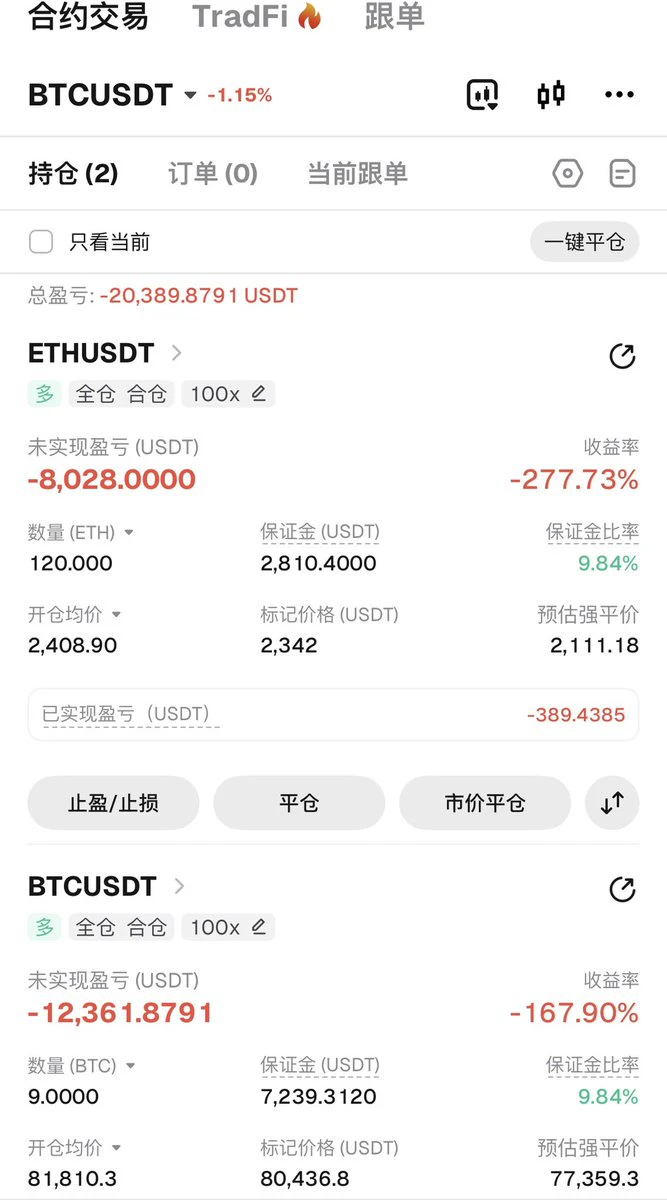
Many people should have had this experience: entering a long position after correctly reading the market, hoping for a breakout to the upside, only to be caught off guard by a sudden plunge and become trapped.
The expected rally never arrives, while the candlesticks instead turn downward, making it easy for one's mindset to become unsettled.
Remember, after a sharp drop, the worst thing to do is act blindly:
Don't panic and cut losses at a short-term low; nor should you stubbornly hold on and passi
post-image
BTC+0.46%
ETH+1.81%
Can holding these few get us to the other side?
post-image
Everyone’s watching DOGE bounce—but the 4h chart is quietly screaming something else.

DOGE/USDT - SHORT

Trade Plan:
Entry: 0.08966 – 0.09026
SL: 0.09284
TP1: 0.08780
TP2: 0.08636
TP3: 0.08420

Why this setup?
- Price is pinned at 0.08996, but the real story is the **range-bound 1D trend**—no momentum to break out.
- RSI (15m) at 41.85 says buyers are already exhausted, not reloading.
- The short setup is armed: entry 0.08996, TP1 at 0.08780 (−2.4%), TP2 at 0.08636 (−4%).
- Why now? The ATR (0.001199) is tight—this coil tends to snap downward when volume fades, not up.

Debate:
Are
DOGE+4.75%
Brb going to church
post-image
Hunting memecoins in the Age of AI seems... largely unchanged?
If you ask Grok to recommend memecoins to buy it will simply give tickers based on some past criteria (views, volumes, posts on X etc.)
I still believe that (organic) memecoin trading requires this human intuition on what can go viral.
Call it vibes or energy around it. The story that captivates degens. Or KOLs that suddenly to decide to shill it.
Being 24/7 online gives bigger advantage than casually asking AI what to buy once per day.
Or am I wrong and there are degens who print millions with AI but don't post on X not to dilute
post-image
GROK+1.22%
MEME-1.21%
SUSHI SushiSwap. Rotates with ARB and UNI in the DeFi rotation. DEX governance tokens will be bought up first when L2 sentiment recovers. Moderate volume, deeper than XAN and EPIC.
$SUSHI
post-image
SUSHI+19.28%
Afternoon Market Updates
live-cover
LIVE2,001
$FLOCK 24-hour surge of 49.92%, but smart money is voting with its feet—are you still chasing the pump to become exit liquidity?
Look closely: the current price is 0.0781, with a high of 0.0818, a low of 0.0508, and $179 million in trading volume. This kind of volume is lively for an altcoin, but the problem is that the pump is happening too fast. It took just one day to rise from 0.05 to 0.08—a classic tactic of coordinated buying to drive up the price before dumping. I’ve been monitoring on-chain data: the number of addresses making large transfers into exchanges has increased by 17% over th
FLOCK+40.69%
Most traders will fade this 95% confidence LONG on $HYPE /USDT — and that’s exactly why it prints.

$HYPE /USDT - LONG

Trade Plan:
Entry: 87.582 – 87.942
SL: 86.036
TP1: 89.056
TP2: 89.919
TP3: 91.213

Why this setup?
- 4h timeframe shows a bullish 1D trend, but the real edge is the 15m RSI at 67.96 — not overbought yet, just warming up.
- Entry zone 87.58–87.94 is tight, with ATR (1h) at 0.719 — momentum is coiled, not exhausted.
- Why now? TP1 at 89.056 is only 1.5% away, but the structure suggests this is the launchpad, not the ceiling.
- Invalid only below 82.588 — that’s a 6% bu
HYPE+3.71%
MARKET ALERT - BMNR
Chart Analysis
Timeframe 1 Hour (1H TF): The trend is undergoing a bullish recovery after a sharp correction. The current price at 25.82 is moving above EMA20 (25.51), EMA50 (25.28), and EMA200 (24.64). The upward-crossing EMA alignment indicates strong short-term momentum toward the local resistance area at 26.60.
Timeframe 4 Hour (4H TF): The main trend remains strongly bullish. The price is holding solidly well above EMA20 (25.16), EMA50 (24.69), and EMA200 (22.02). The previous correction was successfully supported at the EMA support area and formed a higher low, indica
BMNR+3.40%
  • 4
  • 2
FUN FACT: 15 years ago, Bitcoin was $8.
post-image
BTC+0.47%
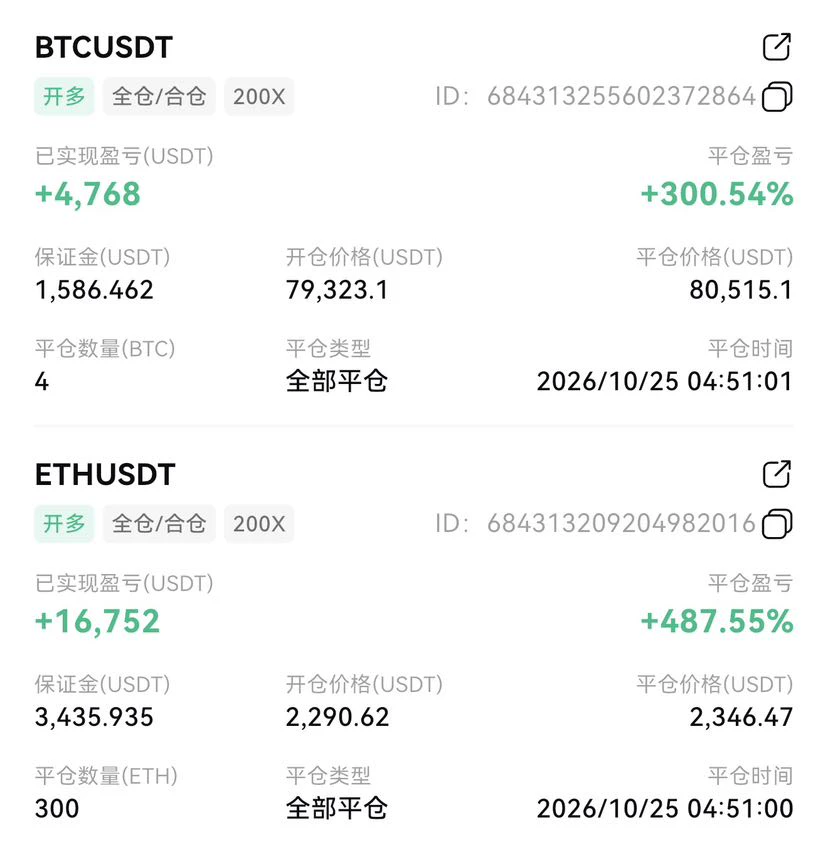
I had just switched the app to the background when it suddenly shot up—are you playing hide-and-seek with me? During the intraday plunge, $BTC was chopping around 77967.8. Once I saw it could no longer fall, I decisively went long. Hardly anyone dared to buy the dip at the time, but the market has a way of humbling anyone who refuses to accept reality.

Money earned is the monetization of your knowledge; money lost is the flaw in your knowledge.

When I switched back to check the chart, good grief—it had already reached 79933.4, with +437.59% secured. I’m not bragging; I just got the timing
post-image
BTC+0.46%
SOL+3.96%
SNDK+1.93%
$USELESS Give me some advice—should I run?
post-image
USELESS-3.10%
Gm say it back ⚡️
post-image
BTC is consolidating in a narrow range near the $80,000 mark, up 0.19% over the past 24 hours and +2.17% over the past 7 days. Spot ETFs saw net inflows of $3.8 billion over three weeks, while Thailand’s former prime minister publicly voiced support for a national Bitcoin strategic reserve, providing support at the bottom; meanwhile, concerns over the unwinding of yen carry trades are suppressing breakout momentum—the range-bound pattern may persist in the short term, with direction depending on subsequent events such as the Federal Reserve decision and the Senate CLARITY vote#美国8月非农超预期
post-image
BTC+0.47%
Most traders will ignore $LINK /USDT at 12.24—that’s exactly why this 95% confidence signal is dangerous.

$LINK /USDT - LONG

Trade Plan:
Entry: 12.212 – 12.274
SL: 11.943
TP1: 12.468
TP2: 12.618
TP3: 12.844

Why this setup?
- 4h timeframe says LONG, with a 1D trend still bullish—no fight between timeframes.
- RSI (15m) at 54.59 gives room to run before overbought, not exhaustion.
- Entry window is tight (12.212–12.274). TP1 at 12.468 is just 1.8% away—momentum is armed, not fading.
- Stop at 11.943 keeps risk defined below the invalid line (11.458).
- Why now? ATR (1h) of 0.125 sh
LINK+4.46%
ZEC/USDT Trade Setup
Current: ~$1,190
Bias: Bullish
Entry: $1,175–$1,200
TP1: $1,300
TP2: $1,400
Final Target: $1,500
Stop Loss: $1,115
Key resistance: $1,220–$1,225
A clean breakout and hold above $1,225 could open the way toward $1,300 and potentially $1,500.
Chart-based setup, not financial advice. DYOR.
$ZEC #
post-image
ZEC+17.42%
  • 7
  • 2
$XVS XVSUSDT – Accumulation Nearing Its End, Major Breakout?
The price is moving within a descending channel on the 1-hour timeframe and has reached the lower boundary. It is now poised for a bounce and is expected to retest this boundary.
The Relative Strength Index (RSI) indicates a downward trend, which is likely to continue given the overbought conditions.
There is a key support zone in green at 2.82, and the price has bounced off this zone several times, making it a strong support level.
The price is trending towards the 100-period moving average, which we are approaching. This trend supp
post-image
XVS-4.14%
CRYPTO MARKET UPDATE
live-cover
LIVE1,623
Load More

Join 40 M users in our growing community

⚡️ Join 40 M users in the crypto craze discussion

💬 Engage with your favorite top creators

👍 See what interests you

View More