
Share your thoughts
placeholder
Article
After 9 years in crypto, I’ve seen too many people lose money—not because they couldn’t understand the market, but because they couldn’t control themselves.
Chasing pumps and selling dips, going all in with oversized positions, holding on when trapped, and taking profits too quickly—I’ve made all these mistakes myself.
Later, I realized that different position sizes call for different strategies. Use small positions for quick in-and-out short-term trades, medium positions for switching between swing and medium- to long-term strategies, and large positions to lock in the trend and hold steadily
post-image
BTC-1.23%
Everyone’s long XRP at 1.40—but the 4H just whispered a secret the crowd missed.

$XRP /USDT - SHORT

Trade Plan:
Entry: 1.4019 – 1.4071
SL: 1.4291
TP1: 1.3860
TP2: 1.3737
TP3: 1.3552

Why this setup?
- 1D trend is **range**, not breakout—so chasing 1.40 upside is gambling.
- RSI 15m at 64 shows local heat; ATR 1h (0.0102) signals compression—breakouts fake out.
- Entry ref 1.4045 sits exactly at invalidation 1.4046—this is a knife-edge trap.
- Short targets: TP1 1.3860 (-1.3%), TP2 1.3737 (-2.2%)—reward:risk is 1:2.4 if you respect SL 1.4291.
- **Why now?** Price is rejecting the r
XRP-2.88%
Last night on the $ANSEM Live, @tania_paintings asked:
“Have you checked @alchemifydotfun yet?”
And Ansem’s answer was basically:
“Not yet… but I told you guys I will check it.” 👀
That might sound like a small statement, but for @alchemifydotfun , this is actually a 𝗕𝗜𝗚 𝗠𝗢𝗠𝗘𝗡𝗧.
Because just yesterday, we were talking about why Alchemify deserves a closer look from the wider $ANSEM ecosystem.
Now the conversation has reached the top.
No endorsement.
No guarantee.
No premature celebration.
Just one simple thing:
𝗧𝗛𝗘 𝗣𝗥𝗢𝗝𝗘𝗖𝗧 𝗜𝗦 𝗡𝗢𝗪 𝗢𝗡 𝗛𝗜𝗦 𝗥𝗔𝗗𝗔𝗥.
And that's exact
LAB+7.30%
WAL/USDT — A quiet recovery after a long downtrend
WAL is trading around 0.02619, up 4.22%, with price finally stabilizing after falling from the 0.12531 peak.
The bigger picture is still weak, but the recent structure is different: price has formed a base around 0.02001 and is slowly pushing higher.
Levels on my radar:
• 0.02646 — immediate resistance
• 0.03000 — key breakout area
• 0.04106 — major resistance
• 0.02001 — major support
• 0.02098 — SuperTrend level
MACD is improving and has moved back into positive territory, which supports the recovery idea. But the long-term performance is st
WAL+4.72%
  • 2
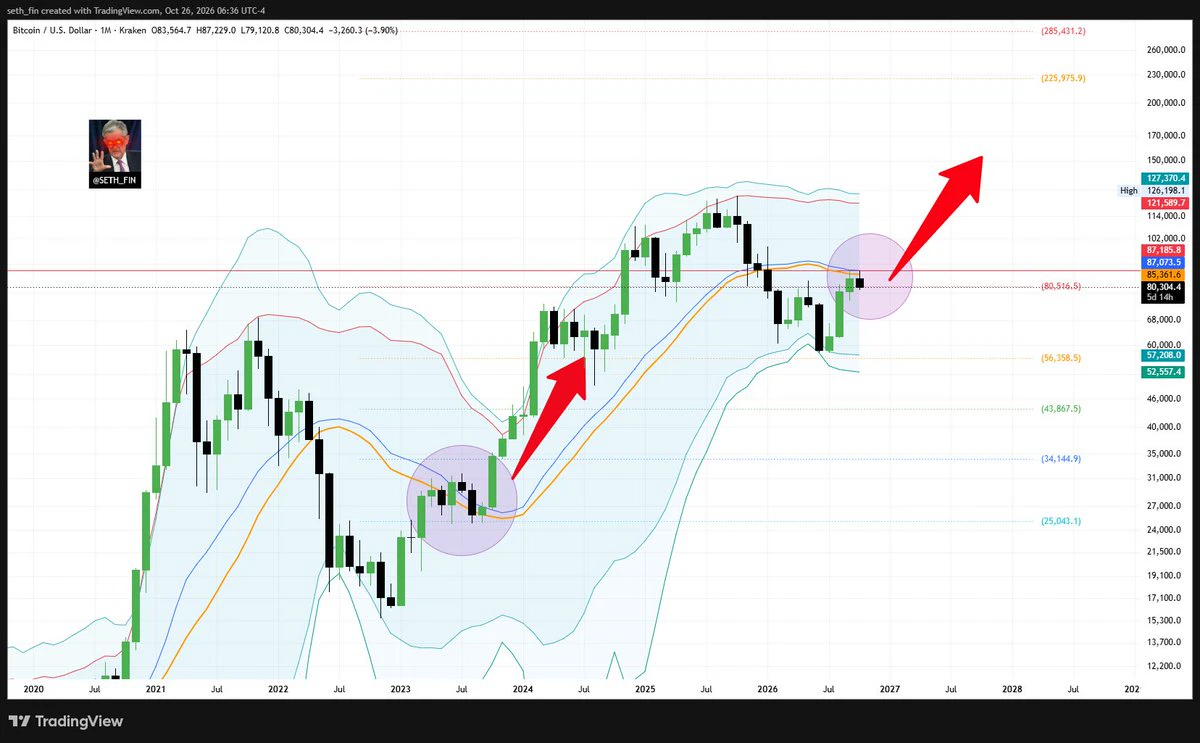
$BTC : It could be a quiet weekend. The key level to keep the white roadmap intact is $78,640.
A break below this level would shift the focus to $76,290.
One more high is still on the table, but keep in mind that a top could be near.
post-image
BTC-1.23%
Most traders are staring at XLM right now — but they’re reading the wrong timeframe.

$XLM /USDT - SHORT

Trade Plan:
Entry: 0.18267 – 0.18345
SL: 0.18679
TP1: 0.18026
TP2: 0.17840
TP3: 0.17560

Why this setup?
- 15-min RSI is scorching at 77.25 — overheated, not exhausted.
- Price is pinned at 0.18306, hugging the 4h range ceiling while 1D trend says “range,” not “rally.”
- ATR on 1h is tiny (0.001554) — volatility is coiled, and short targets sit 1.5% to 4% below.
- Why now? The 0.18156 invalidation is only 0.8% away — a break there kills the bear setup instantly.

Debate:
If 0.183
XLM-0.40%
What can one’s family of origin drive a person to become?
post-image
$RDDT /USDT Perp – "Illiquid Chop – Avoid"**
**Trading Plan Short $RDDT
Entry: 153.65
SL: 153.80
TP1: 153.54
TP2: 153.40
RDDT is extremely illiquid (volume 0.81) and completely flat. High slippage risk; enter only on a break below the 153.65 level, with a tight stop above the 153.80 resistance.
post-image
RDDT-2.21%
  • 7
  • 2
$NVDA is showing an interesting setup 👀
Nvidia has been making a strong recovery on the 1H chart after dropping toward the $215 area.
In the screenshot, NVDA is trading around $230.40, up 0.87%, after pushing as high as $234.75.
What caught my attention is the price action:
→ $215.10 acted as a recent low
→ Price recovered strongly toward $230+
→ $234.75 is the recent high and an important resistance area
→ After that spike, price pulled back and is now holding around $230
The key question now isn't simply whether NVDA can go higher.
It's whether buyers can defend the current levels and even
post-image
NVDA-0.13%
  • 4
  • 1
$ink is closer than ever
Don't fade $QUOTRONS
Coop's body will explode the day he gets to share TGE details
Quotrons wallets will explode the day the $ink token drops 🔥
@inkonchain
@inkfndhq
@cruelhandeth
post-image
market update BTC
live-cover
LIVE964
📅 Xueqiu Check-in | Day 53 #Opening Positions | Total Return: +81%
💰 Principal: 6000U | Current: 10700U
⚖️ Position: 40%
🪙 Holdings: Spot $ICP $LTC $ONDO
💡 Strategy: BTC -0.02%, overall gain ratio 74%, showing some profit-making effect; participate in batches
ICP+4.33%
LTC+4.97%
ONDO+2.41%
The bullish and bearish scenarios alternated in the lead during the early period, reflecting intense tug-of-war; after September 4, expectations of a surge to 2600 briefly pulled far ahead before quickly retreating; currently, the probabilities of 2600 and 2300 are very close, while expectations of an upside move to 2700 remain weak.
post-image
GM chat <3
Have a good weekend!
post-image
I'm still quite bullish on storage, so why go against the trend? A pullback to 1650-1680 is a long; let's target 1950 first.$SNDK
post-image
SNDK+11.17%
Today’s long trade went fairly smoothly, but looking back, what really deserves recording isn’t how much I made, but how close I came to being shaken out midway.
After $NEAR rebounded from its lows, I went long around 1.8725. My judgment was based on the price breaking above the previous minor consolidation zone with reasonably healthy volume and price action, while the moving averages on the daily timeframe also appeared to be converging before fanning upward. The market did move smoothly at first, and the unrealized profit quickly grew.
However, after a slight push higher, the price suddenly
post-image
NEAR+13.73%
ZEC+3.54%
BTC-1.27%
$BTC Slow is fast! Welcome to copy trading!
post-image
BTC-1.27%
  • 1
In the early period, the bullish and bearish curves alternately took the lead, with intense tug-of-war; after September 4, expectations of a rise to 2600 briefly gained a significant lead before quickly retreating; currently, the probabilities of 2600 and 2300 are very close, while upside expectations for 2700 remain weak.
post-image
Everyone’s chasing the 15m RSI bounce—but the 4h chart just whispered a secret about $LAB /USDT.

$LAB /USDT - SHORT

Trade Plan:
Entry: 0.07577 – 0.07641
SL: 0.08005
TP1: 0.07312
TP2: 0.07114
TP3: 0.06817

Why this setup?
- RSI on 15m is overheated at 68.35—that’s fuel for the next leg down, not up.
- 1D trend is bearish, and price is stalling at 0.07609—right at the 4h supply zone.
- My model’s 80.33 confidence says SHORT. Targets: TP1 0.07312, TP2 0.07114. Stop is tight at 0.08005.
- Why now? The bounce is losing steam exactly where shorts want to reload.

Debate:
Are you fading t
LAB+7.40%
U.S job report market impact
live-cover
LIVE1,493
Load More

Join 40 M users in our growing community

⚡️ Join 40 M users in the crypto craze discussion

💬 Engage with your favorite top creators

👍 See what interests you

View More