


Share your thoughts
placeholder
Article
Crypto narratives move fast.
Blockchain data moves differently.
So what happens when the story on social media disagrees with what is happening on-chain?
This is where on-chain analysis becomes powerful.
A Meme token may suddenly become the center of attention on social platforms. Posts multiply, communities become more active and traders begin discussing potential breakouts.
But blockchain activity can provide another perspective.
Wallet distribution, transaction activity, token movements and liquidity changes can help traders understand how participation is developing.
The important word is
post-image
xxx40xxx
A Meme token can have enormous attention and surprisingly little liquidity.
That combination can create explosive moves in both directions.
But how much of a rally is actually supported by real market depth?
Liquidity is one of the most overlooked concepts in speculative crypto markets.
When liquidity is deep, larger orders can often be absorbed with less price impact. When liquidity becomes thin, relatively small orders can move price much more aggressively.
This matters enormously for Meme assets.
A trader may see a rapid breakout and assume that strong demand is driving the market. But if available liquidity is limited, part of the move may simply reflect how little capital is required to shift the order book or available pools.
That does not automatically make the move invalid.
It changes the risk profile.
DeFi liquidity pools, centralized exchange order books, stablecoin flows and trading volume can all influence how efficiently a market functions. This is why liquidity should be viewed as infrastructure behind price—not just another technical indicator.
The same principle applies during pullbacks.
When sellers appear, a thin market can accelerate downward movement. A deeper market may absorb selling more efficiently. This difference can completely change execution, slippage and risk management.
The key lesson is simple: volatility is not only about sentiment.
It is also about market depth.
For GateSquare traders, this creates a useful discussion point. Instead of simply posting “bullish” or “bearish,” explain what you see in liquidity and why it changes your thesis.
The next question becomes even more interesting:
If liquidity is the market’s fuel, where is that fuel actually coming from?
This content is not investment advice. Always perform your own research before making financial decisions.
$ARC $ARGUS $GSTOCKBSC
#GateMemeCarnival #Gate广场中秋团圆局 #Arc生态热门代币波动加剧 #ArcEcosystemHotTokensSeeIncreasedVolatility
#GateSquareMidAutumnReunion
repost-content-media
BTC+5.52%
GT+6.53%
ETH+5.80%
  • 2
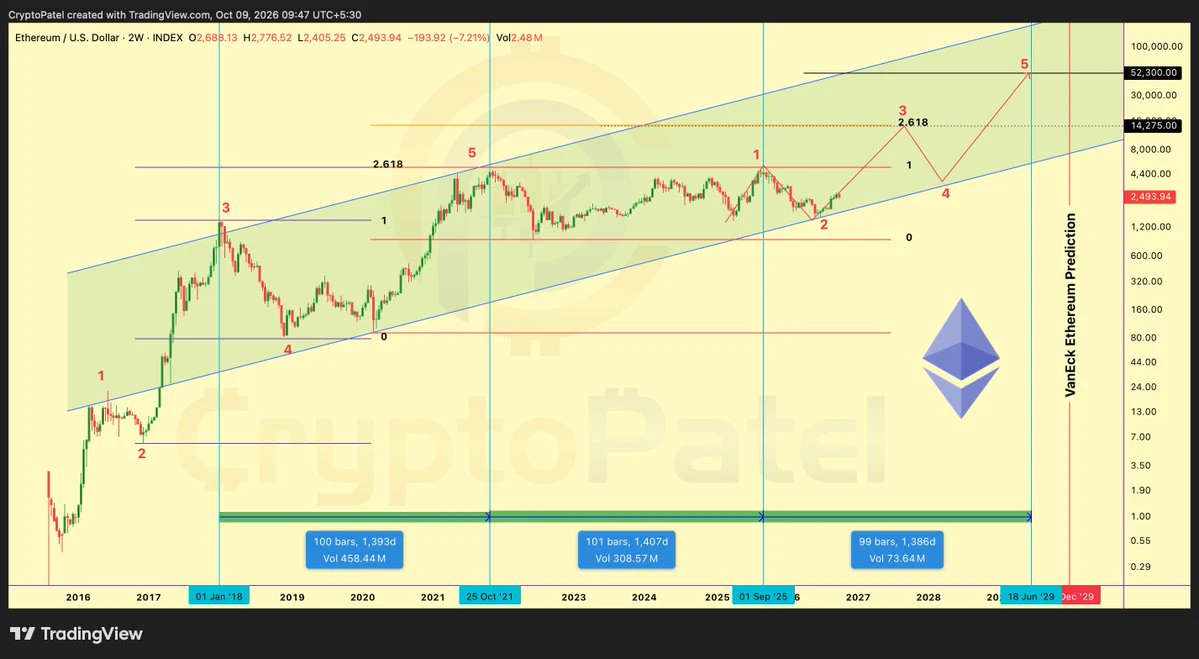
ETH’s key technical levels have now shifted: $2,400 has once again become an important support level, around $2,467 is the short-term strength/weakness dividing line, and $2,527–2,550 is the first key resistance zone. If $2,550 is decisively broken, the upside may open further; if ETH falls back below $2,440, it could retest $2,400.
The biggest change at present
The main idea I gave you two days ago was: short the rebound.
Now I will adjust it to: breakout longs > buy the pullback > short at resistance
The reason is that ETH has already shown a clear V-shaped recovery.
In addition, on Septembe
ETH+5.82%
Everyone watching BNB upside while this indicator screams short.

$BNB /USDT - SHORT

Trade Plan:
Entry: 760.34 – 763.16
SL: 779.40
TP1: 748.52
TP2: 739.69
TP3: 726.46

Why this setup?
Why now? The daily trend is bullish yet the 1h price sits at 761.75, exactly at our entry_ref, while the 15m RSI reads 64.19 showing room before overbought. With the 1h ATR at 5.655766, the current setup respects the entry zone between 760.34 and 763.16 for a short bias. The first target is 748.52 and the second sits at 739.69, both offering meaningful risk-to-reward against the invalidation level of 732.70.
post-image
BNB+4.46%
  • 1
A Meme token can have enormous attention and surprisingly little liquidity.
That combination can create explosive moves in both directions.
But how much of a rally is actually supported by real market depth?
Liquidity is one of the most overlooked concepts in speculative crypto markets.
When liquidity is deep, larger orders can often be absorbed with less price impact. When liquidity becomes thin, relatively small orders can move price much more aggressively.
This matters enormously for Meme assets.
A trader may see a rapid breakout and assume that strong demand is driving the market. But if a
post-image
xxx40xxx
A Meme token can fall while its underlying attention is rising.
It can also rise while liquidity underneath the move is getting weaker.
So what if the chart is telling only half of the story?
Price is the most visible part of crypto markets, but visibility does not equal information.
Imagine a Meme token suddenly gaining volume. The chart looks impressive, social mentions increase, and traders begin watching the breakout. The obvious conclusion is that momentum is strengthening.
But volume alone does not tell us who is trading, why they are trading, or whether the liquidity can absorb the next wave of buying or selling.
This is where market structure becomes important.
Liquidity determines how efficiently orders can move through a market. On-chain data can provide clues about wallet activity, transfers and changes in token distribution. Exchange volume can reveal where speculation is concentrating. Social attention can show whether a narrative is expanding or simply becoming louder.
None of these indicators should be treated as a standalone prediction tool.
Instead, they form a framework.
For example, rising price combined with expanding participation may tell a different story from rising price with shrinking activity. Likewise, a sharp pullback after excessive leverage can have a different meaning from a pullback caused by deteriorating liquidity.
The professional approach is not to ask, “Will it go up?”
The better question is:
“What information would confirm or invalidate my current thesis?”
That shift changes trading from reaction into analysis.
In the next part, we move deeper into the market’s hidden engine: liquidity.
When you analyze a Meme move, do you watch price first—or liquidity first?
This content is not investment advice. Always perform your own research before making financial decisions.
$ARC $GT $ETH
#GateMemeCarnival #Gate广场中秋团圆局 #Arc生态热门代币波动加剧 #ArcEcosystemHotTokensSeeIncreasedVolatility #GateSquareMidAutumnReunion
repost-content-media
ARC+1.31%
ARGUS-12.90%
GSTOCKBSC-36.83%
  • 3
  • 1
$ZEC /USDT is about to explode past 1550, but most traders are still sleeping on it.

$ZEC /USDT - LONG

Trade Plan:
Entry: 1438.2 – 1455.4
SL: 1363.8
TP1: 1509.0
TP2: 1550.5
TP3: 1612.7

Why this setup?
Why now? The daily trend is firmly bullish, setting the stage for a strong continuation. The 1h ATR of 34.57 signals that a volatile expansion is imminent, giving the move the necessary fuel to break out. With the 15m RSI at 36.34, the asset is far from overbought, leaving plenty of room for upside momentum before a stall. The entry zone between 1438.2 and 1455.4 aligns perfectly with the c
ZEC-1.37%
#日股地产电力半导体板块走强
#JapanRealEstatePowerChipStocksRise
🇯🇵 Japanese Stocks Are Sending a Bigger Signal Than a One-Day Rally
Japanese equities are attracting increasing attention as three very different sectors — Real Estate, Power and Semiconductors — move into focus at the same time.
The Nikkei 225 closed 1.38% higher, while semiconductor-related shares remained particularly active. At the same time, expectations surrounding the Bank of Japan and a possible move toward a 1.25% rate environment add another important layer to the market story.
But rather than simply asking which sector is rising
JPN225+0.02%
  • 2
Nobody is talking about this hidden weakness forming in SOXL right now.

$SOXL /USDT - SHORT

Trade Plan:
Entry: 117.2 – 118.0
SL: 121.5
TP1: 114.7
TP2: 112.7
TP3: 109.8

Why this setup?
Why now? The daily trend is range-bound, setting up a potential breakdown from the current 1h price of 117.6. The 15m RSI at 46.64 shows bearish momentum is building without being overbought, allowing room for further downside. The 1h ATR of 1.630941 confirms volatility is expanding, which often precedes a sharp move. The entry zone between 117.2 and 118.0 aligns perfectly with this setup for a short bias.
SOXL+2.27%
XRP is about to expose the short sellers who are already trapped.

$XRP /USDT - SHORT

Trade Plan:
Entry: 1.3779 – 1.3867
SL: 1.4366
TP1: 1.3415
TP2: 1.3144
TP3: 1.2736

Why this setup?
Why now? The daily trend is range-bound, which means XRP lacks a clear directional trend and traders are hunting for reversals inside that range. The 1h ATR of 0.017415 shows that hourly swings are tight enough to squeeze entries but wide enough to give the trade room. The 15m RSI at 66.09 signals short-term overbought pressure, suggesting momentum is fading and a pullback toward the entry zone of 1.3823 cou
XRP+6.91%
#ZECKeepsRisingBreaking1500
Zcash (ZEC) has become one of the strongest stories in the crypto market, pushing through the highly watched $1,500 level and attracting renewed attention from traders, investors, and the broader privacy-focused blockchain community.
As of September 18, 2026, ZEC has traded around the $1,450–$1,480 area after reaching an intraday high above $1,530. Market data shows how quickly the move has developed: ZEC was around $1,110 on September 15, climbed above $1,330 on September 16, and then crossed $1,500 on September 17–18.
This is not simply a one-day move. Zcash has
ZEC-1.37%
$SOL is showing strong 4H momentum after a clean reaction from the $96–$99 demand zone. 👀
Price has reclaimed $106 and pushed through the previous $110 resistance, confirming a strong short-term structure shift.
Key levels I’m watching: • Hold above $110 → $114–$116 comes into focus
• Lose $106 → momentum starts to weaken
• $96–$99 remains the major support zone
After such a sharp move, I’d rather watch for a successful retest than chase the candle.
Bullish: while $110 holds.
$SOL #Solana #SOL #Crypto #SOLAnalysis
SOL+10.72%
  • 4
  • 1
Layout for Bitcoin, Ethereum, and Dogecoin
live-cover
LIVE822
$SNDK Shandi’s long-position followers are taking profits#Gate广场中秋团圆局 ZEC can be shorted around 1480
SNDK+7.81%
#交易机器人 I’m using the ETHUSDT futures grid bot on Gate—come copy my trades!
post-image
BTC update
live-cover
LIVE1,664
$DOGE Long 10x | Active entry zone, stop-loss strategy in place.
DOGE has reached the strategic zone, and I’m prepared to enter here. I’m positioned, but if buyers fail to hold this level, I’ll exit. Trading plan: - Entry: 0.08741 – 0.08772- TP1: 0.08867 (R:R 1:0.8)- TP2: 0.08940 (R:R 1:1.3)- TP3: 0.09051 (R:R 1:2.0)- SL: 0.08609Why this setup? - This is a robust long setup: the 4-hour structure provides support, while the 1D remains within the 0.08741–0.08772 range. - The 15m RSI at 61 allows buyers to keep pushing higher as long as this zone holds. - Volume metrics look good: a 0.31x pace,
post-image
DOGE+6.92%
$7.3k an HOUR keeps the 9-5 away $SPY
post-image
SPY-0.44%
Coinbase puts stocks on-chain, but MORPHO just moves sideways without responding
Damn, COIN surged 11.16% in U.S. trading, while $MORPHO —the buying side absorbing the selling—just moved sideways. I’m outright bullish, buying dips above 2.40 and cutting losses if it breaks below 2.393.

One-sentence summary: Coinbase’s tokenized stocks are now on the Base chain, where they can be used as collateral to borrow on Morpho, with both floating and fixed rates available.

The transmission mechanism is the key—putting stocks on-chain brings real borrowing demand into the protocol. A 72/14 breadth
post-image
MORPHO+10.21%
Weekly candle turns red, nobody cares: TAO surges 8.7% in a day, stuck at 253
$TAO Two hours ago, “first weekly close in red” flooded the feeds; it surged 8.7% over 24h and stalled at the doorstep of 253. Good grief, this coin hasn’t even gained traction. View: buy the dip, don’t chase.
The event itself—after grinding down from the $770 high and seeing attention freeze at rock bottom, last week’s weekly candle closed at 250.42. The weekly MACD formed a golden cross, the first red weekly candle of this downtrend.
The transmission chain is straightforward—nobody cares → cheap coins → weekly mome
TAO+8.60%
Rally or Trap? Three Risks and One Question
A single 1.7% day on the Nasdaq is not a trend.
But the great turning points in market history also started with days like this.
What separates the two? Three gauges and one question.
Risk 1 — the rate path. The Fed ended its 2026 cycle with a hike and signalled one more before year-end. Tightening conditions press directly on growth companies that book most of their cash flow in future years.
Risk 2 — concentration. Information technology now accounts for roughly 38% of the S&P 500, against a long-run average near 18%. When an index is carried by a
post-image
xxx40xxx
It's Called the AI Rally, But the Fuel Is Liquidity
The market calls it an AI rally.
But would this picture have formed if the 10-year Treasury yield had not slipped below 5% and the VIX had not dropped 11%?
And does on-chain liquidity tell the same story?
Three variables carried risk appetite on 17 September: a 4.93% 10-year yield, a VIX at 15.7 and softer oil. Together they lower the cost of carrying risk. More often than not, prices are moved by conditions rather than headlines.
Crypto lives this dynamic faster. Stablecoin supply, transfer volumes in cash-like assets such as USDC, collateral quality inside DeFi protocols and the depth of liquidity pools rank among the most transparent measures of risk appetite. That is Web3's edge: this data sits on-chain rather than behind closed doors. An analyst watching on-chain liquidity can answer "where is the leverage coming from?" far faster than in traditional markets.
The first signs of deteriorating risk appetite show up here early too: tightening collateral ratios, sudden jumps in lending rates, stablecoin flows changing direction. In traditional markets such signals arrive late, after the close; on-chain they are readable in real time — an asymmetry that makes Web3 tooling a genuinely useful complementary risk panel.
GateSquare is where that bridge gets built: while the AI narrative drives the Nasdaq, the same theme finds expression in crypto through new Launchpad structures, tokenomics design and DeFi products. One caveat still applies: correlation is not causation, and the two markets do not always react to the same headline in the same direction.
So what is this optimism missing? Three concrete risks — and the series finale — in Article 5.
This content is not investment advice. Always perform your own research before making financial decisions.
$BTC $GT $ETH
#Gate广场中秋团圆局 #美股AI概念股全线反弹 #GateMemeCarnival #WhereToParkStablecoinsWhileWaiting #GateSquareMidAutumnReunion
repost-content-media
BTC+5.52%
GT+6.53%
ETH+5.80%
  • 6
$INJ Current price 6.72, 24h +19.49%, trading volume 25.0M USDT, funding rate +0.0100%, Fear & Greed Index 56. MA5 at 6.6476 has crossed above MA20 at 6.26985, and the MACD histogram at +0.02222 remains bullish, but RSI has reached 71.1 and entered the overbought zone. The Bollinger upper band at 7.0546 is acting as short-term resistance, while the 21.69% amplitude over 30 candles indicates a considerable risk of wick formation.
The funding rate of +0.01% is mildly positive, indicating that longs are willing to pay to hold positions, but positioning has not yet reached an extreme level of crow
post-image
INJ+19.04%
SNXX+18.55%
Load More

Join 40 M users in our growing community

⚡️ Join 40 M users in the crypto craze discussion

💬 Engage with your favorite top creators

👍 See what interests you

Trending Topics

JapanRealEstatePowerChipStocksRise

58.56k Views3.5k Discussing

Japan's Nikkei extended gains on Sept 18, with real estate, power, and semiconductor sectors leading. Gate covers over 12,800 global stocks and ETFs, offering one-stop USDT trading across US, HK, Korean, and Japanese markets. [👉 Read more](https://www.odaily.news/en/newsflash/518749)

USAIConceptStocksRally

33.39k Views466 Discussing

GateTopsStockPerpetualCoverage

37.54k Views2.31k Discussing

View More