Square
Following
Hot
News
Notifications
Profile
Share your thoughts
placeholder
Article
Watching the market all day is exhausting; cries of despair are everywhere.
With the market like this, some people are still busy picking fights—maybe they aren’t trading at all.
post-image
Why did the relief rally quickly shift into a rotation?

The relief rally that began with the removal of political uncertainty has rapidly given way to a more complex equation. The market is no longer just saying "the election is over"; it is now signaling that, with the election behind us, the focus has shifted to corporate earnings and underlying fundamentals.

Following the midterm elections, the Democrats' victory in both chambers of Congress initially triggered a broad-based rally, which saw Bitcoin recover from the $76,000 range to above $80,000. However, this wave of optimism proved s
BTC-5.05%
NAS100-0.07%
Trenches
BTC
B
bade
b
BTC
C5xp...pump
Market Cap
$.
Change
.
24h Vol
$.
Holders
.
ZIG
Z
bade
b
ZIG
0x8c...1145
Market Cap
$.
Change
.
24h Vol
$.
Holders
.
STONK
S
bade
b
STONK
6GmA...UNgx
Market Cap
$
Change
.
24h Vol
$.
Holders
.
GM
G
bade
b
GM
0x13...7777
Market Cap
$.
Change
.
24h Vol
$.
Holders
.
DESSA
D
bade
b
DESSA
npz2...pump
Market Cap
$.
Change
.
24h Vol
$.
Holders
.
Neuron Industries raised 10 million in seed funding to build industrial controllers. The sector isn’t sexy, but it’s critical to factories. FCVC and Obvious leading the round shows hard tech is back. Salesforce has even moved into defense tech. Signals that major players are staking out territory are worth more than the funding numbers. If you have anything to add, join the conversation in the comments.
post-image
CRM-2.13%
  • 6
  • 2
What Is a Liquidation Price? How Should You Understand the Relationship Between Maintenance Margin, Unrealized Losses, and Forced Liquidation?

In crypto contract trading, many people focus only on changes in profit and loss after opening a position, but overlook a key question: At what price could the position be forcibly liquidated? Understanding the liquidation price helps traders assess risk in advance and avoid losing control due to insufficient margin.

First, what is a liquidation price?

A liquidation price is the price level at which a position may trigger forced liquidation under spe
post-image
Stop... Stop... Stop 🚨$BTC The next Bitcoin cycle has already started counting down. There are 530 days until the next $BTC halving. History offers an interesting strategy: 🟢 start accumulating about 500 days before the halving. 🔴 Watch for a major profit-taking opportunity around 500 days after the halving. The biggest opportunities often come when nobody is willing to buy. Don't chase the rally. Don't panic on down days. Build your position patiently. The real question isn't whether Bitcoin will be volatile again, but whether you'll be ready when it is. Are you accumulating, or still wa
post-image
BTC-0.67%
📢 Signal repost—sis is just passing it along, not responsible for running off with your position.
KOL channel: Victorious Asset: $BTC Long entry: 82477.8 Target: 83099.5 Stop-loss: 82062
Funny enough, I reposted Victorious’s $BTC trade earlier today, and now here it is again—attendance is through the roof 👀
Whether to follow and how much to put in is up to you, babes. Sis won’t decide for you.
Personal trading record shared for reference only; this is not investment advice. #Nonfarm payrolls are due tonight—how is the market betting on a December rate hike after the sharp drop in US stocks
BTC-0.67%
How Can You Tell When Market Conditions Have Changed? Which Signals Are Worth Watching, and Which Are Just Short-Term Noise?

In the previous article, we discussed a question: Why might a trading strategy that once worked gradually lose its edge?

One important reason is that market conditions have changed.

But the real challenge is this: Markets fluctuate every day. How do we know whether this is normal volatility or whether the market regime has actually changed?

If we react too slowly, we may continue using a strategy that is no longer suited to current market conditions.

If we react too
post-image
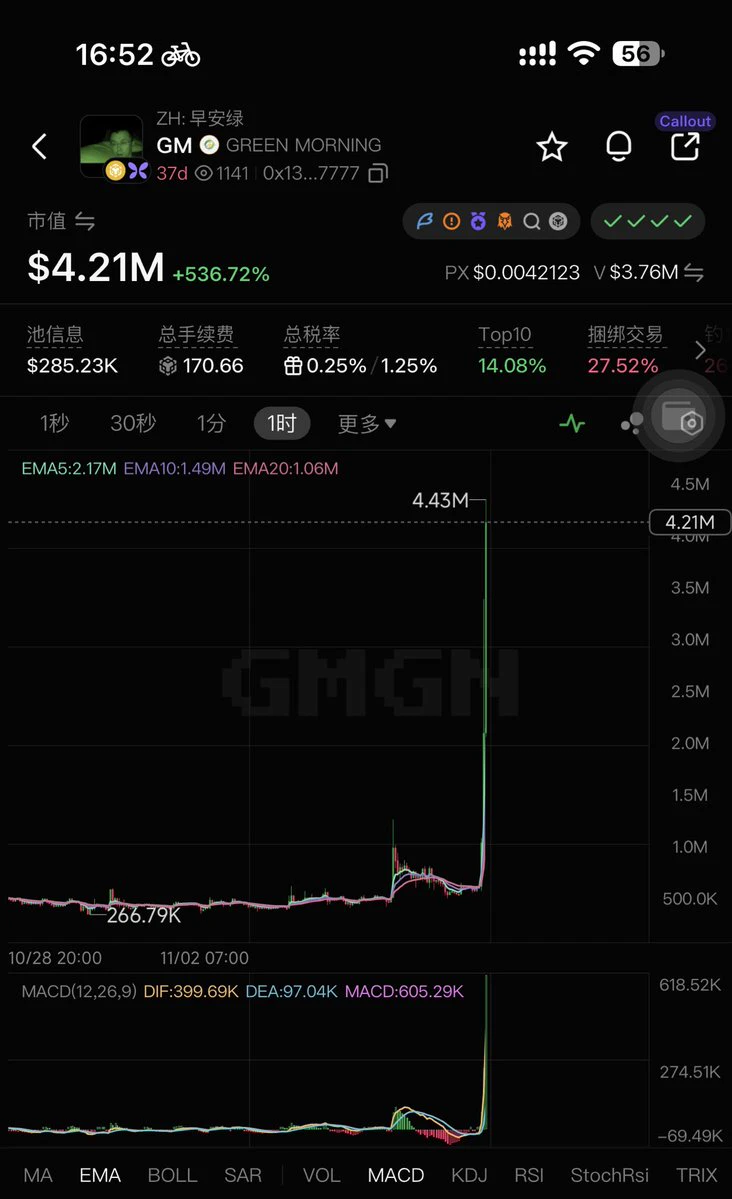
Everything's in place, feeling energized $GM
Three crypto bigwigs plus an Elon Musk
post-image
GMWAGMI+0.00%
🤖 Anthropic launches a personal finance feature in beta in the US on Claude: the assistant connects to accounts selected by the user and answers their money-related questions based on their balances and transactions, without being able to move or invest funds.
post-image
SanDisk has dropped so much, I can't hold on anymore either$SNDK
post-image
SNDK-22.24%
  • 9
  • 3
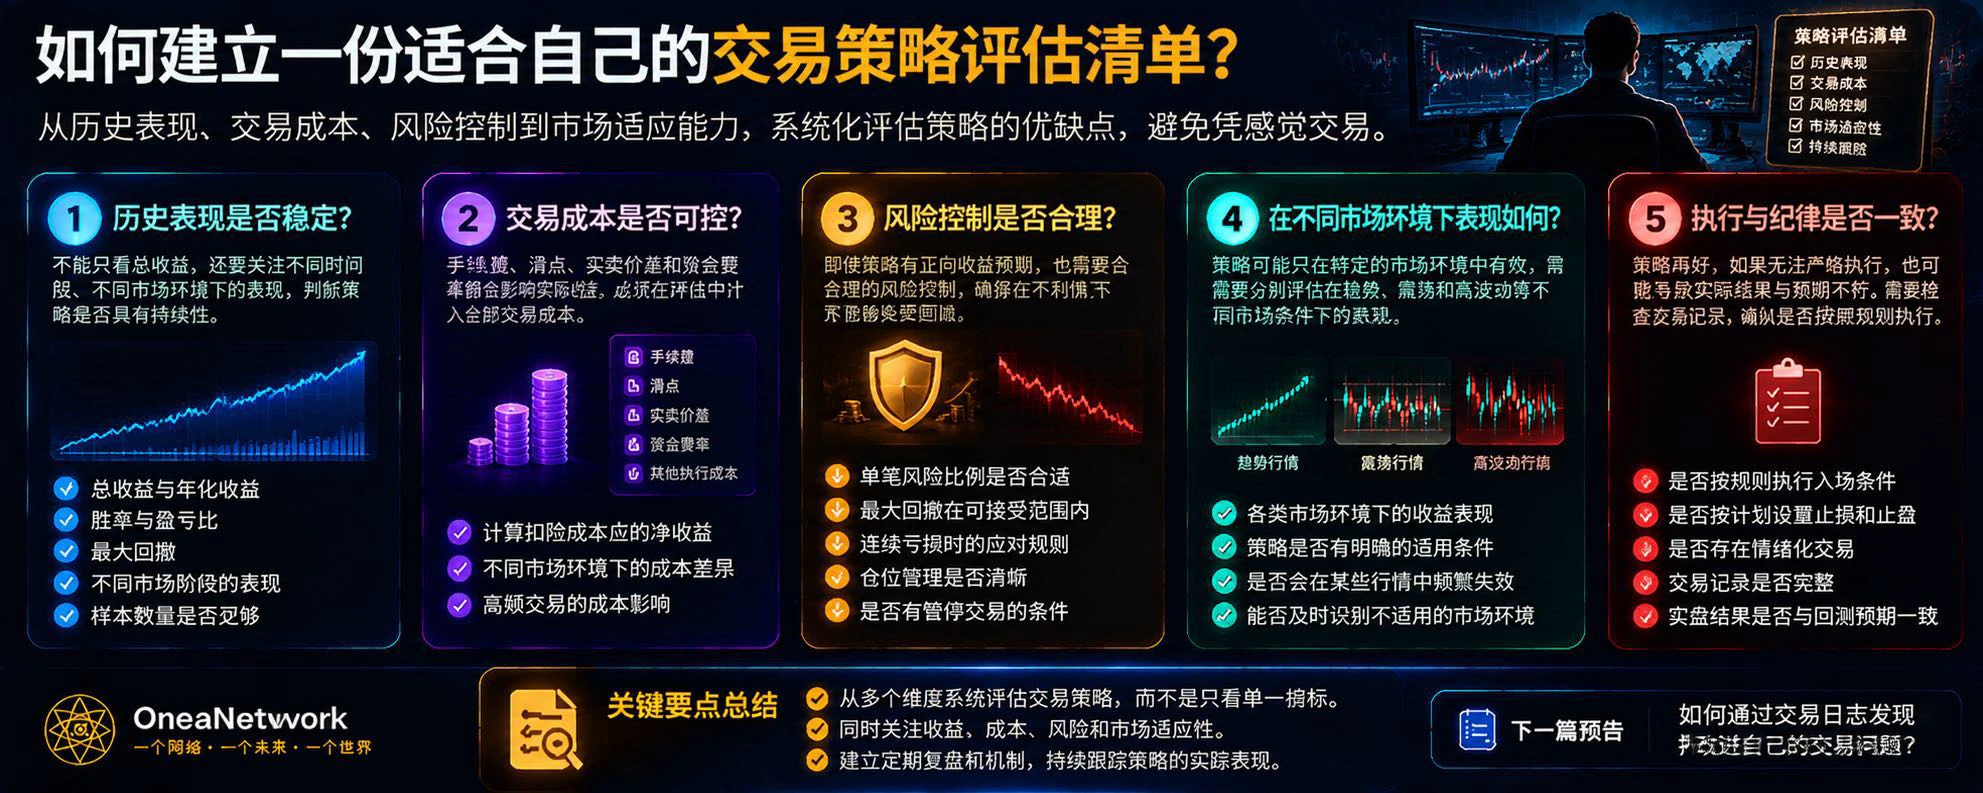
# How to Build a Trading Strategy Evaluation Checklist That Suits You?

Earlier, we discussed why trading strategies fail, why backtest profits do not guarantee live-trading profits, and how strategies should be adjusted when market conditions change.

But all these questions ultimately converge on a more practical one:

**What criteria should we use to decide whether a trading strategy is worth continuing to use?**

Many traders are accustomed to looking at a few straightforward numbers: returns, win rate, and maximum drawdown.

These metrics are indeed important, but looking at any one of th
post-image
Looking at price, first SanDisk: #闪迪 #美股史诗级抛售

Core judgment: the reasonable range is around 1200–1450 (centered at ~1350); 806 is a panic discount.

But focus on 4 indicators
1. Forward P/E: Based on yesterday’s share price, 806 ≈ 3.5–5× → extremely low; however, low multiples in memory stocks often signal a cycle-peak warning. For example, Micron’s P/E is actually highest at the bottom.
This needs to be considered alongside the points below.

2. Enterprise NAND/SSD contract prices + company guidance: still rising = supports the range; turning down/cuts to guidance = range shifts down to 750
SNDK-22.24%
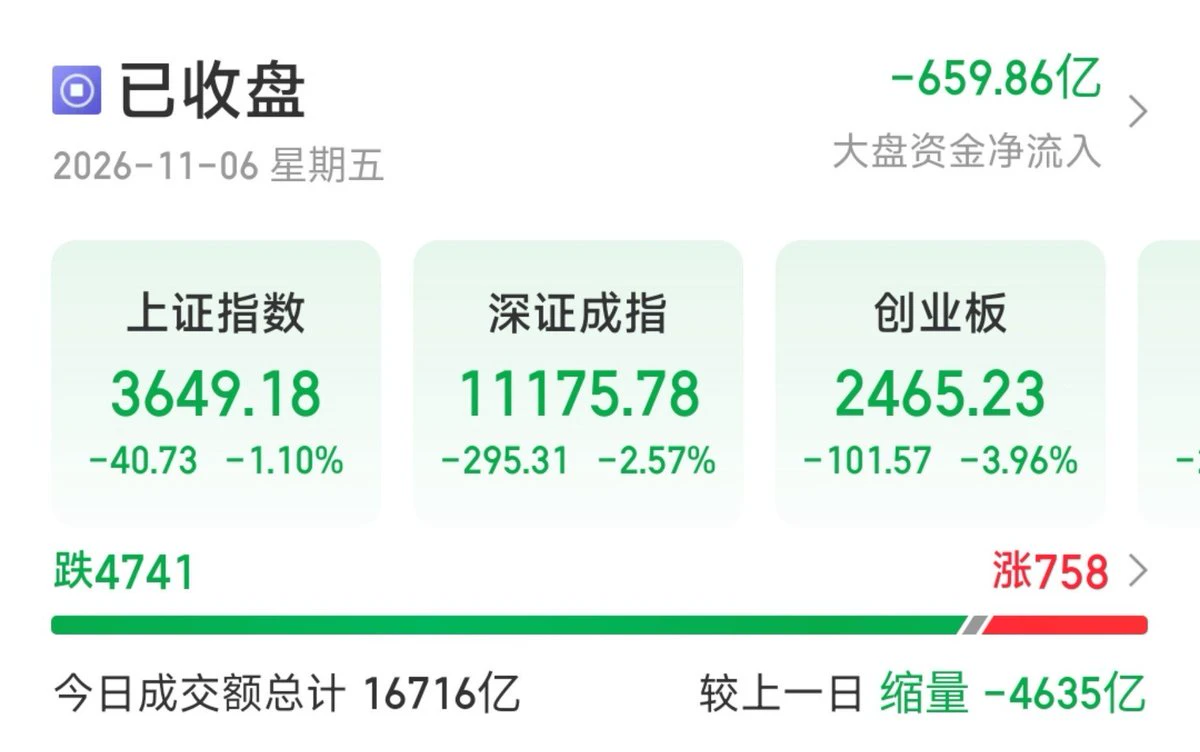
I'm so fed up! When U.S. stocks crash, you crash along with them; when U.S. stocks rise, I never see you move! The ChiNext plunged today, and trading volume was cut by more than half. When will this lousy market ever end! 😭💢
post-image
What Is the Liquidation Price? How Should You Understand the Relationship Between Maintenance Margin, Unrealized Losses, and Forced Liquidation?

In crypto derivatives trading, many people focus only on changes in profit and loss after opening a position, while overlooking a key question: At what price could the position be forcibly liquidated? Understanding the liquidation price helps traders assess risks in advance and avoid losing control due to insufficient margin.

First, what is the liquidation price?

The liquidation price is the price level at which a position may trigger the forced li
post-image
USDC markets predictions
live-cover
LIVE1,914
U.S. stocks took a sharp hit on Thursday.
The S&P 500 closed at 7353, down 4.36%; the Nasdaq plunged to 24315, down 5.52%, officially entering correction territory; the Dow also fell 3.44%, closing at 51523. Semiconductors fared even worse, with the Philadelphia Semiconductor Index dropping more than 12% in a single day.
Here’s a closer look at several stocks everyone is watching:
Nvidia closed at 181.60, down 9.26% on the day, after hitting an intraday low near 181.46. It was still above 200 the previous day, and now it has plunged straight to this level. In the short term, the 180-182 area i
post-image
SPX+0.33%
NAS100+2.11%
NVDA-9.33%
SNDK-22.24%
TSLA-10.84%
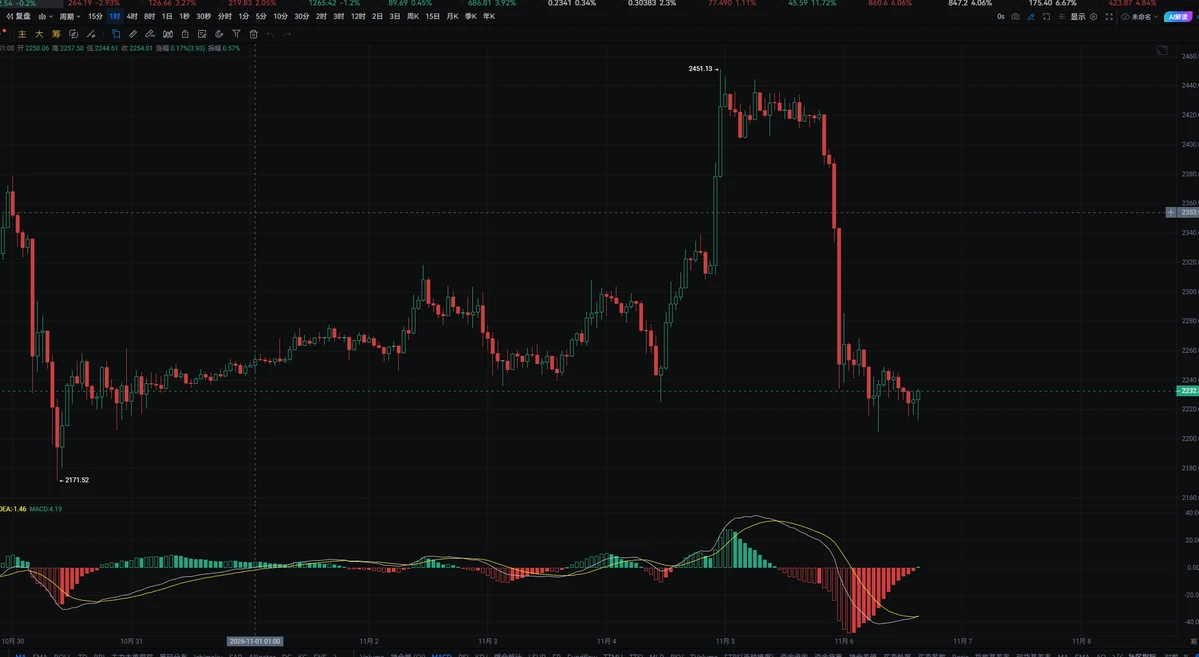
#ETH ETH is currently trading at 2230, and its overall trend is closely tracking BTC’s weakness. Since retreating from its previous high of 2420, it has broken below its prior consolidation range. Bears have the upper hand in the short term, and without independent positive catalysts, ETH is unlikely to decouple and rally. It is also more volatile than BTC, so its declines are likely to be more pronounced. The first resistance above is around 2300. This level was tested multiple times as support before breaking down, and has now turned into a strong resistance zone. To reverse the current weak
post-image
ETH-1.26%
BTC-0.67%
  • 8
  • 1
#USStocksFaceHistoricSelloff

Hunting for a Reversal in the SOXL Crash .

$SOXL

soxl

SOXL

CFD

40.93

-38.19%

‌

The chart tells a dramatic story. SOXL, a 3x leveraged semiconductor ETF, has experienced a catastrophic drop, plummeting -38.19% to trade at $40.93. The price has sliced through the Bollinger Bands and moving averages like a hot knife through butter, driven by headline fears (as noted: "AI buildout fears hit chip stocks").

When an asset falls this violently, panic selling is common. However, for the technical trader, a massive sell-off often sets the stage for a sharp
SOXL-38.25%
Load More

Join 40 M users in our growing community

⚡️ Join 40 M users in the crypto craze discussion

💬 Engage with your favorite top creators

👍 See what interests you

Trending Topics

USStocksFaceHistoricSelloff

4.79k Views3.64k Discussing

U.S. stocks suffered a sharp selloff on Thursday, with the Nasdaq closing down more than 5% and the Philadelphia Semiconductor Index falling over 12%. AI and chip stocks including $NVDA and $AMD were hit especially hard. Markets are reassessing AI valuations, data-center spending and future returns. Is this just short-term deleveraging, or the start of a deeper correction in the AI trade? Which sectors are you watching next?

GateLaunchesPoSECProofOfSecurity

14.95k Views591 Discussing

USNonfarmPayrolls

13.18k Views4.05k Discussing

View More