
Square
Following
Hot
News
Notifications
Profile
Share your thoughts
placeholder
Article
another day at the office.
post-image
Trenches
ZIG
Z
bade
b
ZIG
0x8c...1145
Market Cap
$.
Change
.
24h Vol
$.
Holders
.
BTC
B
bade
b
BTC
C5xp...pump
Market Cap
$.
Change
.
24h Vol
$.
Holders
.
HIGH
H
bade
b
HIGH
7ymF...high
Market Cap
$.
Change
.
24h Vol
$.
Holders
.
STONK
S
bade
b
STONK
6GmA...UNgx
Market Cap
$.
Change
.
24h Vol
$.
Holders
.
CORLA
C
bade
b
CORLA
0xba...7777
Market Cap
$.
Change
.
24h Vol
$.
Holders
.
Crypto Market update
live-cover
LIVE305
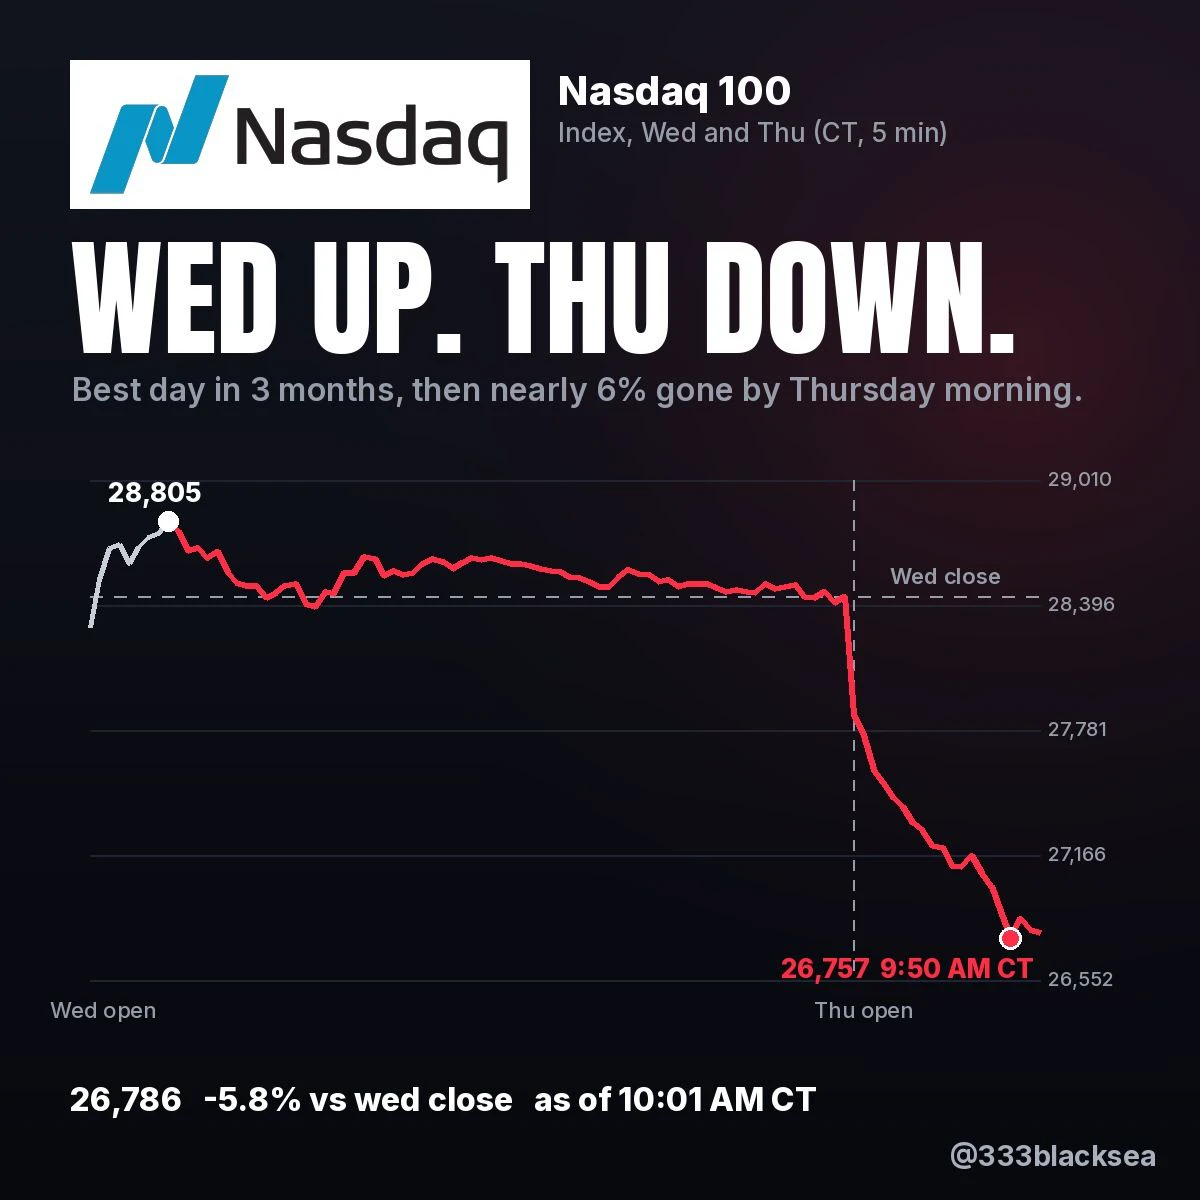
Wednesday: best day in 3 months.
Thursday: Nasdaq in a correction.
Nvidia on sale or just getting started?
post-image
NVDA-9.33%
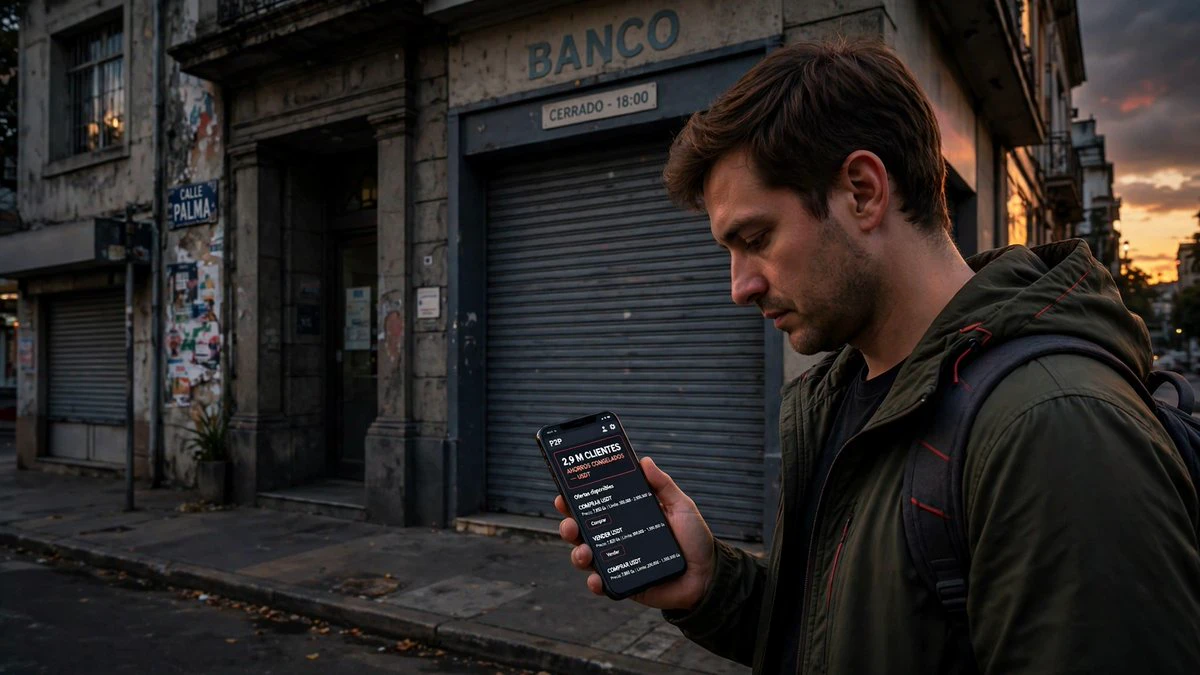
🏦 Paraguay: Peña resigns after Ueno Bank collapse as money rushes into USDT
What began as a solvency problem ended up bringing down a government. Santiago Peña submitted his resignation as president of Paraguay this Thursday, minutes before Congress was set to put him on trial in impeachment proceedings, with the Ueno Bank crisis dragging him down.
🔹 The hard facts
• Paraguay’s central bank found that Ueno’s solvency had fallen below half the required minimum after accounting adjustments during the regularization process
• The bank served about 2.9 million customers in a country of 6.1 milli
post-image
Not for long. Iykyk.
post-image
Aviva Investors now has $117.50M of tokenized money market fund shares on the XRP Ledger, up 134.45% in the past 30 days.
The newest is a share class of its largest fund, the ~£22 billion Sterling Liquidity Fund.
@XRP
XRP-1.15%
market update
live-cover
LIVE60
XRP Technical Outlook: XRP Weakens Below Key EMAs as Bearish Pressure Builds

XRP is trading around $1.245, facing continued selling pressure after being rejected from the $1.35–$1.36 resistance area. The price has moved below all four major EMAs, while RSI remains below 40, indicating that bearish momentum is still dominant.

The immediate focus is whether buyers can defend the $1.22–$1.24 support area. A breakdown could expose XRP to further downside, while a recovery above the EMA cluster would be the first sign of improving momentum.

EMA Structure

XRP is trading below all four major movi
XRP-1.12%
  • 1
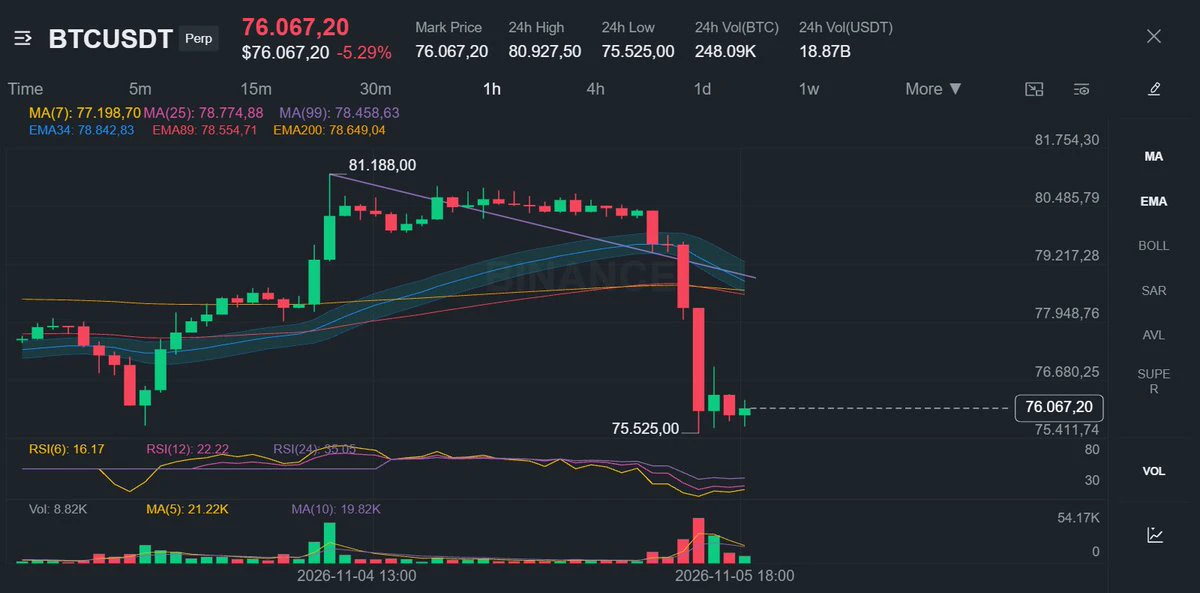
Bitcoin ETF outflows hit $398.6M on Nov 2 as BlackRock leads redemptions
US-listed spot Bitcoin ETFs saw a combined $398.6 million net outflow on November 2, per Farside Investors' daily fund table. BlackRock's IBIT accounted for roughly $405.3 million in redemptions, while Fidelity's FBTC took in about $6.7 million. The headline net figure therefore hides a modest positive contribution from outside the largest fund.
The November 2 number followed a $643.2 million net outflow on October 30 in Farside's table. Two consecutive negative sessions invite closer attention to allocation decisions, bu
post-image
BTC-5.05%
BLK-4.39%
IBIT-5.18%
🔥 Don’t just scroll through posts! Comment for a chance to win rewards!
Found an opinion that resonates with you? Share your thoughts! Disagree? Tell us why!

🎁 The Gate Square Comment-to-Win Challenge is underway!
🏆 Climb the engagement leaderboard: Win prizes including high-quality Gate merchandise with an estimated value of 150 USDT and a 150 USDT futures position trial voucher.
🎉 First-comment bonus: Post your first valid comment after signing up to receive a 10 USDT futures position trial voucher.
⭐ Featured comments: Each round, 3 users with high-quality comments will be selected, an
post-image
Democrats take both chambers, Jeffries officially goes after the speaker’s gavel, and Mississippi and Alaska are still counting—historians see it this way: whenever power changes hands, markets move on expectations first; once the dust settles, the trade is over. What do you think?
post-image
  • 1
Crypto investors often focus on the candlestick patterns on their screens. But have you ever considered the invisible hand that moves those candles?

Sometimes, the source of the biggest market movement isn't hidden in the Bitcoin chart or the news feed of an altcoin. The real scenario is often written in the shadow of macroeconomic labels. Right now, we're looking at one of those shadows: the Dollar Index (DXY).

The data on the chart is quite clear: the DXY is at 101.62 today, with a modest increase of 0.09%. However, this small green candle shouldn't mislead investor psychology. Because the
post-image
BTC-0.67%
ETH-1.26%
XAU+0.38%
XAG+0.47%
NAS100-6.81%
  • 9
$HYPE ‌ 's recent recovery has hit a serious resistance wall, and the latest candle shows sellers stepping back in.

Price is around $77.68 after rejection near $84.89. The daily Supertrend remains bullish at $75.21, but buyers need to defend that support to keep the recovery structure alive.

Levels worth watching:

Support: $77.45
Major support: $75.21–$74.41
Resistance: $82.67–$84.89
Next upside zone: $88.20

Holding above $75 could set up another attempt toward $82.67. A break below $74.41 would put the bullish structure under pressure.

HYPE still has a chance to stabilize, but buyers ne
HYPE+0.24%
AMD-17.64%
  • 6
  • 2
Retail investor: I take profits every time I'm up 25%. Lock it in, never go broke taking gains.
Me: Look at that 5 year chart. How many "25% moves" are on it?
Retail investor: A few... but they kept going after.
Me: Right. So every time you locked in 25%, the thing kept running & you were out. Then you paid taxes on the gain, so you need your next pick to work just to catch back up to taxes paid.
Retail investor: I mean I have to sell sometime.
Me: Do you? Here's what the wealthy actually do. They don't sell their best shares. Ever. They get their cash a different way.
Retail investor: Which i
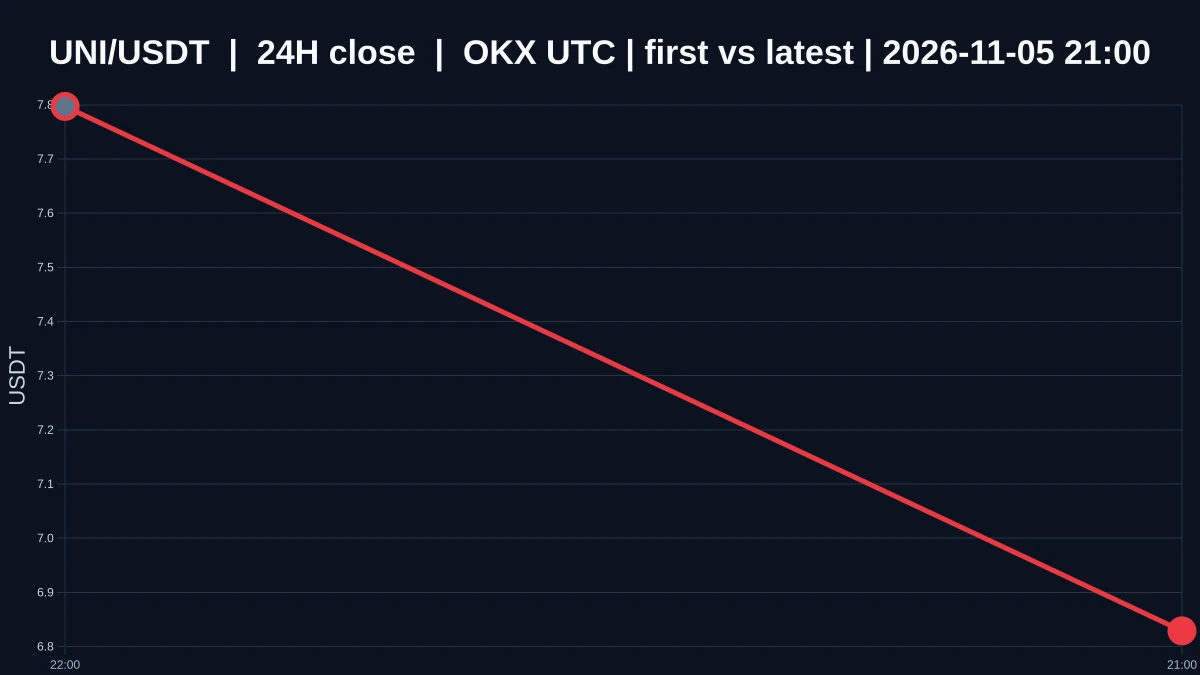
$UNI Has Entered Oversold Territory, So Why Can’t We Say It Has Bottomed?
$UNI is currently priced at 6.827, down 10.253713684764032% over 24 hours, with an intraday range of 6.616 to 7.82. The 1-hour and 4-hour trends are both weak, and the 1-hour volume ratio is 0.010346356381599834. With the price down to this level, short-term oversold conditions are building, but the structure has not stopped weakening. I would not equate oversold with having bottomed.
Oversold describes a price that has fallen enough in a short period of time. A bottom describes a point where selling pressure has truly r
post-image
UNI+3.05%
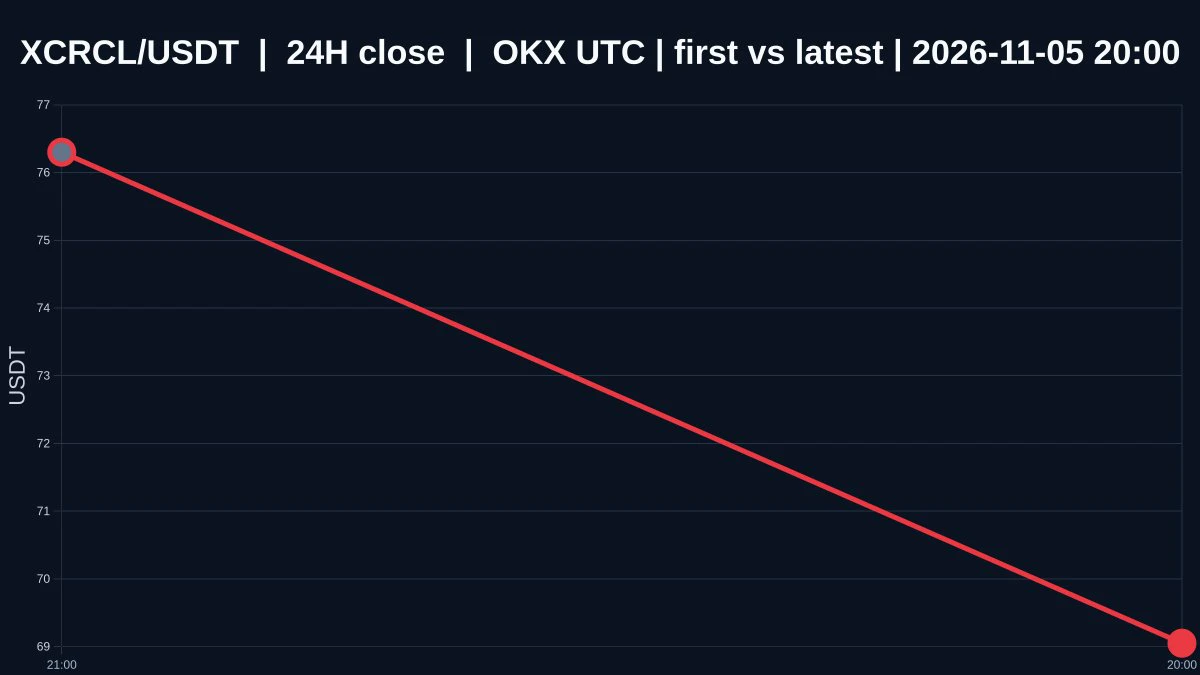
$XCRCL Falls to 69.15; Oversold Does Not Automatically Mean a Bottom Is In
$XCRCL is currently priced at 69.15, down 9.702272133716361% over 24 hours, with an intraday range of 65.34 to 77.33. The 1-hour and 4-hour trends are both weak, and the 1-hour volume ratio is 0.0006001285474826546. The price has fallen to this level, and short-term oversold conditions are building, but the structure has not stopped weakening. I would not equate oversold with a bottom.

Oversold describes a price that has fallen enough over a short period. A bottom describes selling pressure genuinely drying up and buye
post-image
$APP These numbers look off. I watched the order book for three minutes: at 354, 24-hour trading volume hit 173.6 million, up 29.6%, but the low was 260.8—that means more than $100 of movement was absorbed today. Retail traders couldn't have done this.
Let me talk about my own trades. I entered around 272. What I was watching was three consecutive hourly candles closing above the moving average after volume picked up at the 260 bottom—a typical sign of major players buying back in. When it reached around 340, I sold half and have held the other half until now. Honestly, I feel a bit uneasy at
APP+0.12%
  • 8
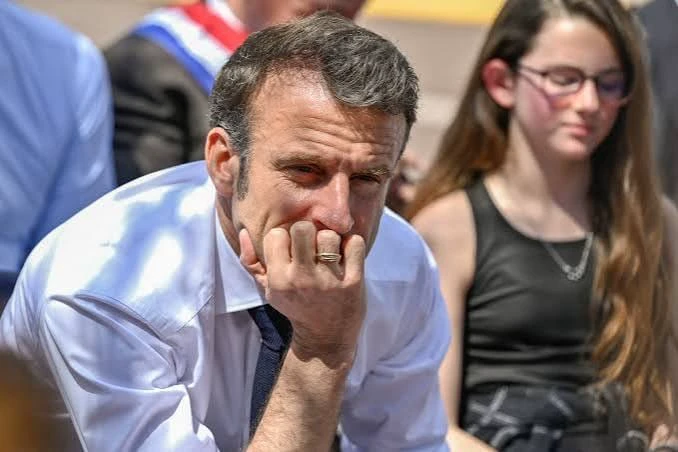
🇫🇷 Emmanuel Macron's confidence rating falls to 13% in November, a historic low for a president of the Republic, according to the Elabe barometer for Les Echos. It is down 4 points in a month and 11 points since August.
post-image
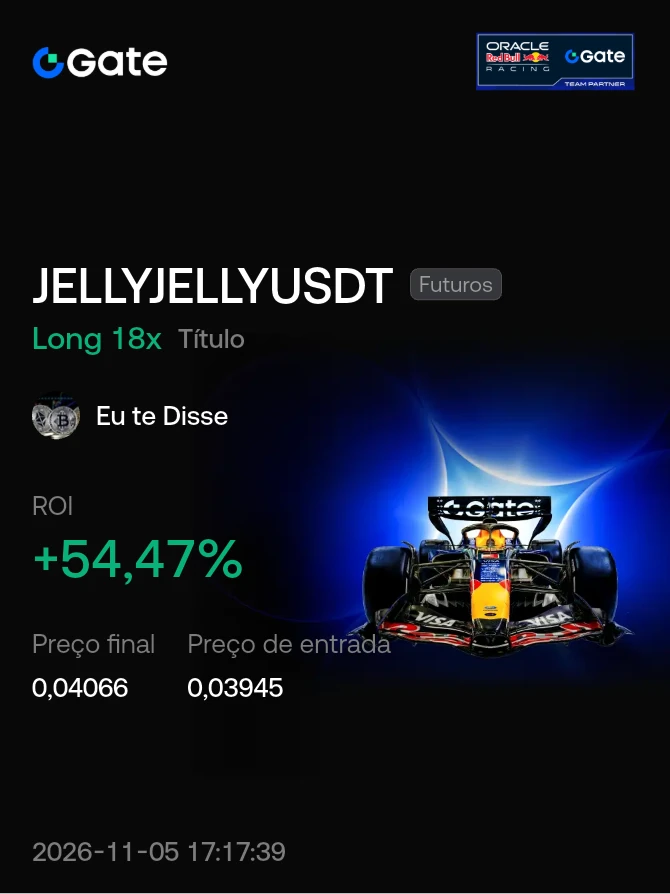
#Share My Holding Returns#
With liquidation at $0.032, would I have anything to worry about with this JELLYJELLY meme?
Let the market maker answer that 👀
post-image
Load More

Join 40 M users in our growing community

⚡️ Join 40 M users in the crypto craze discussion

💬 Engage with your favorite top creators

👍 See what interests you

Trending Topics

GateLaunchesPoSECProofOfSecurity

7.69k Views545 Discussing

Beyond Proof of Reserves, Gate has introduced PoSEC, a new Proof of Security framework focused on how user assets are stored and protected. By disclosing the distribution of assets across cold storage and hot wallets, users can directly understand Gate’s storage structure and risk coverage under extreme scenarios. Gate’s latest cold storage coverage ratio stands at 104.58%, meaning cold-storage assets alone are sufficient to cover all user assets. PoR verifies whether reserves are sufficient, while PoSEC shows how assets are stored and how risks are covered — together forming a more complete asset security framework. Share your results and experience! [👉 Learn more](https://gate.com/proof-of-security)

BTCBackAbove80K

126.19k Views41.58k Discussing

DemocratsWinBothChambers

28.37k Views535 Discussing

View More