Square
Following
Hot
News
Notifications
Profile
Share your thoughts
placeholder
Article
Overall layoffs are down 44%, but the tech sector has cut 170,000 jobs. This isn’t a recovery—it’s a structural shakeout. Traditional industries are bouncing back, while tech companies are trading headcount for profits, and those who’ve been laid off are facing the coldest hiring season yet. Don’t just look at the total—the details hold the answer: the hardest-hit areas are precisely the ones that expanded most aggressively in recent years. What’s tech hiring like where you are—picking up or frozen?
post-image
  • 1
  • 1
WHALE ADD 10.2 MILLIONIN LONG SLIVER POSITION
live-cover
LIVE31
BTC-0.67%
ETH-1.26%
SOL-0.77%
DOGE-0.22%
Trenches
IDOL
I
bade
b
IDOL
0x3b...ab07
Market Cap
$.
Change
.
24h Vol
$.
Holders
.
PIEVERSE
P
bade
b
PIEVERSE
0x0e...25a9
Market Cap
$.
Change
.
24h Vol
$.
Holders
.
FIONA
F
bade
b
FIONA
B34n...pump
Market Cap
$.
Change
.
24h Vol
$.
Holders
.
Singularity
S
bade
b
Singularity
7R4M...pump
Market Cap
$.
Change
.
24h Vol
$.
Holders
.
CLAUDIA
C
bade
b
CLAUDIA
2j5S...W2ZM
Market Cap
$.
Change
.
24h Vol
$.
Holders
.
Only 6 strong signals this round: MMT, AKE, VVV; 4 longs and 2 shorts. Check volume and structure before acting. Last round: 4 wins, 2 losses, +19.2%; SUI and PIEVERSE are in the red. Currently holding 13 positions, averaging +0.7%; waiting for confirmation. 🎯 Last round's returns: SUI entry $0.6185 → exit $0.6440, 5.0x leverage, gained +11.6%; PIEVERSE entry $2.9670 → exit $3.2877, 5.0x leverage, gained +32.6%━━━ Market View ━━━BTC 60,284 +3.0%, bullish signals have a slight edge; negative funding rate data is temporarily unavailable, and capital is still choosing a direction. Don't chase ol
post-image
MMT-3.20%
AKE+6.39%
VVV+0.37%
SUI-1.01%
PIEVERSE+0.50%
🚨 MICHAEL SAYLOR’S BITCOIN MACHINE IS UNDER PRESSURE!

Strategy holds 850,849 BTC, worth around $47B, but sits $17B below its purchase cost.

Its stock has fallen to just 0.97x its Bitcoin holdings. The premium is gone!

⚠️ Saylor’s Bitcoin buying strategy faces a serious challenge. If funding dries up, could this put more pressure on BTC?

The market is watching! 👀
post-image
BTC-0.67%
  • 3
$CELR is showing signs of a bullish rebound‼️ I'm considering going long after a confirmed breakout. Entry: 0.001900 – 0.001920 Take profit: 0.002000 Stop loss: 0.001870
post-image
CELR-3.47%
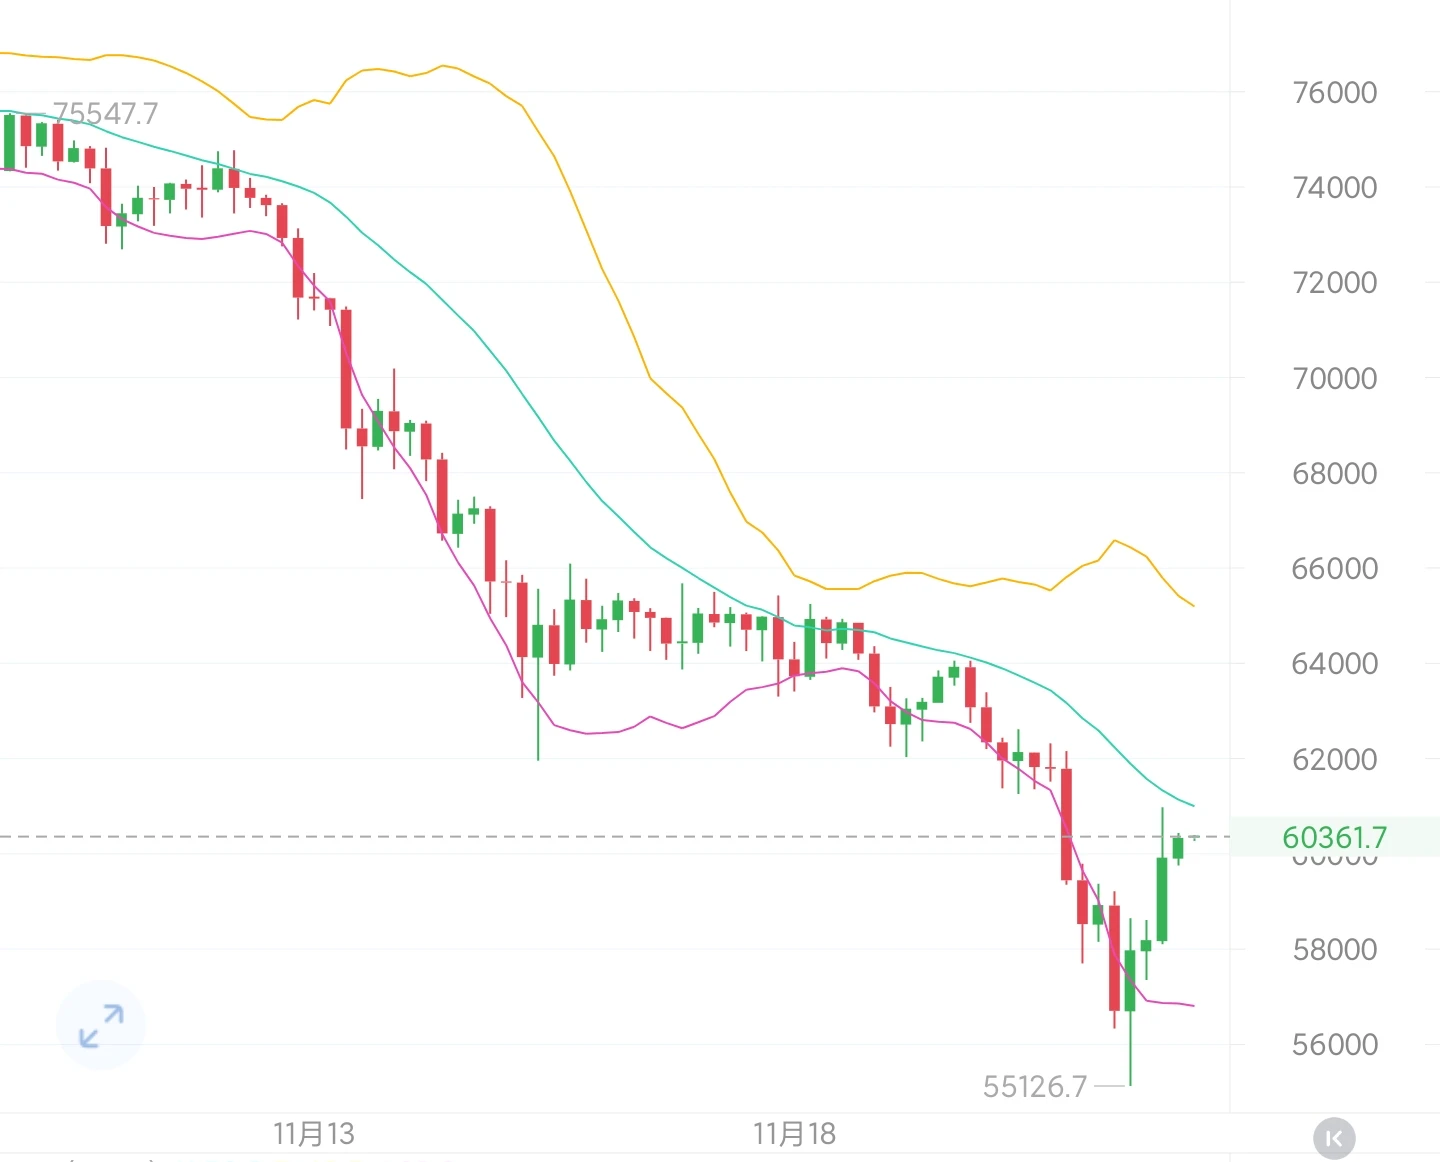
The Fear & Greed Index plunged to 12, with extreme fear prevailing for eight straight days, yet BTC climbed back from $55,134. Given the current setup, should we turn greedy or keep waiting for lower entry prices? The late-night market action doesn’t lie; the answer is all written in the direction of the candlesticks.
$BTC Today traced a deep V within the $55,134–$62,181 range. $60,000 is the dividing line between bulls and bears—hold it, and the next target is around $62,000; lose it and fall back, and we’ll need to keep a close eye on the $55,134 low again. If it breaks below the previous l
post-image
BTC-0.67%
DOGE-0.22%
NEAR+1.17%
BTW is attempting to reclaim the 1-hour MA25; bulls are pushing, but overhead resistance is heavy. Friends, $BTW go long. Execution plan: Entry price 0.6651 - 0.6684 Take profit 0.6990 | 0.725 Stop loss 0.6451 Note: The 1-hour bearish trend is dominant, and the MA25 above presents resistance. Friends, don't go all in. Position size should match your account size.
post-image
BTW-7.42%
For more than a month now, we’ve been witnessing history every day. It really leaves you wanting to cry, with nothing you can do about it.
The Nasdaq 100 $QQ peaked on 10/6. Since then, this past month has been packed with nothing but epic trading days.

From 10/6 to 10/16, $SOX fell for 9 consecutive trading days, dropping a total of 16.3% and tying its longest losing streak since listing.

On 10/29, $GOOGL plunged 12.64%, its biggest single-day drop since listing in 2004, wiping out around $500 billion in a single day.
On 10/30, INTC tumbled 28.58%, its worst day at least since 1980.
On 1
post-image
GOOGL+0.11%
For a coin that’s up 34%, most people’s first reaction is, “Don’t chase it.” That consensus isn’t wrong—$SKYAI climbed from 0.0264 to 0.0398 in a day, with 24-hour trading volume of 54.8M. Going by past experience, this kind of steep move is usually an emotional spike, and a pullback after the surge is the norm. I’ve been trading spot for nine years and have seen plenty of charts like this: a sharp rally, two days of sideways trading, then a slow drift back down.
But there’s one detail worth a closer look this time. The gain is large, and so is the trading volume: 54.8M is no small amount, wh
SKYAI-7.58%
  • 2
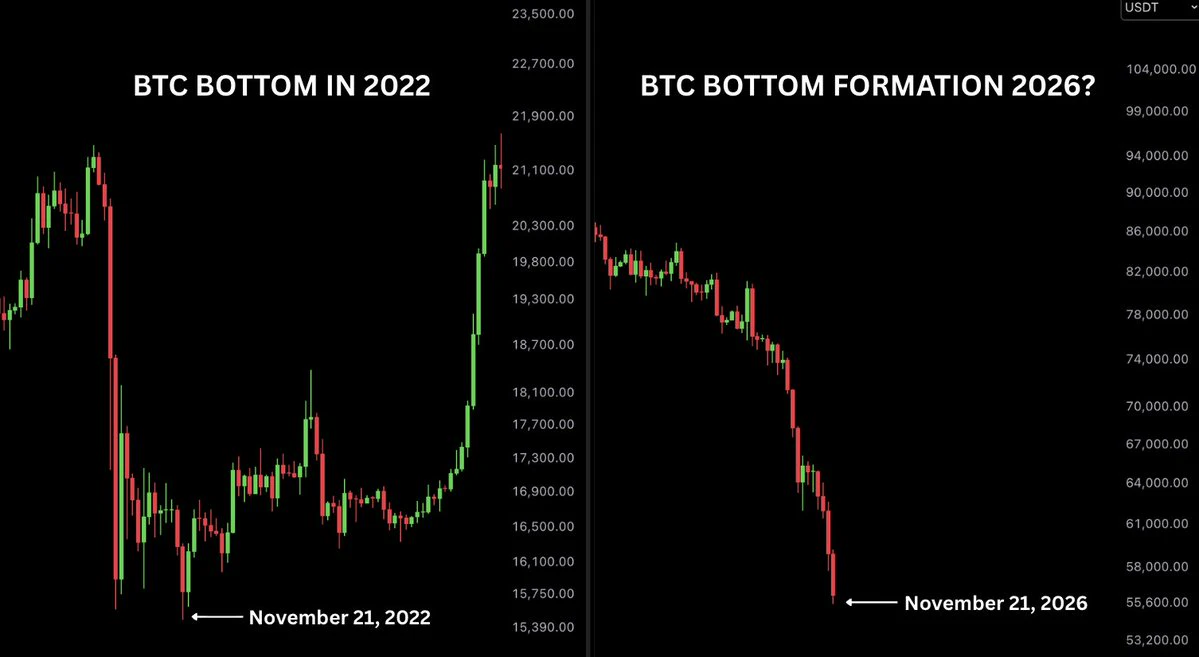
🚨 HISTORY IS GETTING INTERESTING! 👀
Exactly 4 years ago today, Bitcoin formed its cycle bottom.
Fast forward to today, and $BTC has dropped to a new cycle low of $55,150.
Could this be another major turning point for Bitcoin?
What if the bottom is already in and nobody believes it yet? 🚀📈
**Are we witnessing the beginning of the next bull run?** 🔥
post-image
BTC-0.67%
  • 1
Market Update and Opportunity Search - Chapter 9
live-cover
LIVE1,387
BTC-0.65%
XTIUSD+0.50%
EURUSD-0.01%
NAS10020+0.00%
XAUUSD100+0.00%
BTC Technical Outlook: Bitcoin Drops Toward $60K

Bitcoin is facing strong selling pressure after breaking below its previous support structure and the rising trendline. BTC is currently trading around $60,193, following a sharp decline from the $80K–$86K region. Price is now testing the major support area near $60,155, while momentum remains heavily bearish.

The latest breakdown, combined with increased selling volume, suggests that sellers remain in control. However, the RSI has entered oversold territory, meaning a short-term relief bounce is possible if buyers defend the current support.
BTC-0.65%
  • 4
#ShareWeekly market Faces Heavy Selling Pressure as Bitcoin Rebounds After a Two-Year Low

The cryptocurrency market is experiencing severe volatility following a massive sell-off across global financial markets. Bitcoin (BTC) plunged to approximately $55,251, its lowest level in two years, before recovering above $60,000. The decline reflects growing investor concerns about rising interest rates, weaker technology stocks and reduced institutional demand.

Ethereum (ETH), XRP, Solana (SOL), BNB and other major altcoins also faced significant selling pressure. The market downturn triggered bil
BTC-0.65%
ETH-1.23%
XRP-1.15%
SOL-0.77%
BNB-0.76%
Don't rush to turn bearish; make sure you have enough ammunition
A falling market isn't necessarily all bad. For those who haven't built positions yet, this crash is essentially a repricing. If U.S. stocks and crypto markets really get brutal enough to wash out 95% of retail investors, quality tech stocks and major crypto assets will still be dragged down by panic and battered into a hole.
So don't rush to call a crash right now, and don't rush to catch a falling knife either. Save cash, work hard to make money, treat cash flow as ammunition, and prepare your watchlist in advance. The key leve
post-image
NAS100-4.60%
SPYX+0.01%
BTC-0.67%
$IDOL The scariest thing in trading isn’t getting the direction wrong—it’s getting it wrong and stubbornly refusing to admit it. This IDOL move took the “epic comeback” to the extreme.

Looking at the 1-hour chart, a pullback was expected after the price moved sideways around 0.026. But who could have expected the whales to suddenly play dirty, unleash massive volume, and send a huge bullish candle soaring straight up, instantly breaking through every resistance level?

Seeing that, I immediately realized the trend had changed. Without a second thought, I closed my position and reversed, going
post-image
IDOL-6.71%
BTC-0.65%
  • 1
$USELESS Entered USELESS at 0.07001; wick low at 0.0695, 2% from liquidation, with only 0.35 body lengths to spare. Same gesture as BTC at 55,806 (300 points from the wick tip) and ZEC at 696 (nine bucks above 687): no waiting for it to hold, no waiting for confirmation—just pressing the button in the last mouthful of blood.

Seventeen trades ago, I thought I was making money because I could read the market. Now I understand: I make money because I’m willing to press the button during those ten minutes when it feels worst physically. My hand doesn’t shake when I hit sell at the top; it shakes
USELESS-14.66%
BTC-0.65%
ETH-1.23%
BTC is currently around 60,300, up 1.48% in a modest 24-hour rebound, ending several days of steep declines and bringing a short-term technical recovery. The daily chart remains in a weak, choppy trend, with losses exceeding 6% so far this week; overall, the market is in a bearish correction structure. Selling pressure is evident on the 4-hour chart, with price staying below the 50- and 200-period moving averages for an extended period, indicating a weak medium-term trend.

The short-term chart has completed an oversold rebound, but trading volume has not meaningfully increased, and the reboun
post-image
BTC-0.65%
On my way back from grocery shopping, I saw that crooked tree by the entrance to the residential complex. A typhoon bent it last year, and property management tied it up with a rope for half a year. Now the rope has loosened, but the tree is still crooked. A tree has its own way of growing; you can’t pull it straight. $IDOL Today, this chart is up 79.33% in 24h, climbing from 0.0213 to 0.0392, with 180.9M in trading volume. I’m not looking at the chart itself, but at how it got there. My rule is to first check whether it has the flaw of being “one-and-done”—if it shoots straight up in a single
IDOL-6.71%
  • 1
  • 1
$DOS This 16% bearish candle sent the rebound from 0.1837 straight back to 0.1423. The chart looks like a freshly paved road cracked under the weight of a heavy truck.
Compared with that asset that slowly drifted down last week, let’s compare them point by point. Decline: one was a sharp single-day plunge, with sentiment released all at once; the other leaked lower a little each day, like a slow, dull blade. Volume: $DOS today’s 16.4M was a high-volume decline, showing that some people really sold at this level while others bought; volume in the drifting-down asset contracted, with no one step
DOS+14.98%
  • 1
  • 2
This is the key thing to pay attention to. $EVAA

Deposits in the protocol are about $6.69 million, down 20.9% over 30 days; active borrowing is about $3.47 million. The peak on January 31 this year was $84.3 million, and now only about 8% of that remains.

The price is up 10x, but deposits are down 20%. Market cap is about 30 times deposits.

Some promote it as having "300k wallets and $1.4 billion in cumulative trading volume," but independent data shows only $6.69 million on deposit.

The token also has limited utility: the current claims are discounted fees and boosted yields, while cards
post-image
EVAA-0.42%
ETH-1.23%
  • 1
Load More

Join 40 M users in our growing community

⚡️ Join 40 M users in the crypto craze discussion

💬 Engage with your favorite top creators

👍 See what interests you

Trending Topics

BTCBreaksBelow60K

2.1M Views30K Discussing

BTC fell below $60,000 on November 20 for the first time since July, alongside a tech stock selloff and broader pressure on risk assets. Will $60K become resistance, or can BTC quickly reclaim it? What price or volume signals would convince you that selling pressure is easing?

GateDirectIPOPhase3ANTAllocates92100Shares

791.6K Views4.9K Discussing

NvidiaDropsNearly14Percent

331.6K Views7.6K Discussing

View More