Square
Following
Hot
News
Profile

ShizukaKazu

vip
Active for: 3.8y
Peak Tier 5
No content yet
46
Following
1.4k
Followers
47.3k
Liked
Pin
I am the most wronged one among 192,837,465,657,483,920,160,000,000: I freeloaded my way into crypto by registering, then woke up to find my account at zero😂😂😂

Others entered crypto after careful consideration and half a year of research; I simply registered an account because I felt awkward refusing a friend’s invitation.

As it turned out, this free account gifted by fate had quietly marked out my tuition fee—and it was quite expensive.

The beginning: An account I felt awkward refusing

To be honest, I registered on Gate back then purely out of social obligation. A friend sent me an
BTC+1.21%
SOL-0.08%
  • 20
#美国30年期国债收益率2002年以来新高 U.S. 30-year Treasury yield surges to 5.60%, highest since 2002: when this “anchor of asset pricing” shakes, global wealth must adjust
If global financial markets were to choose the “most expensive price tag,” many would point to long-term U.S. Treasury yields—they are known as the “anchor of global asset pricing” because they largely determine the “risk-free floor” for everything from mortgages and corporate bonds to all risk assets.
The latest data gave this anchor a shake: On September 29, the U.S. 30-year Treasury yield briefly rose to 5.595%, then climbed further to
ThisIsTranslateContent:
#美国30年期国债收益率2002年以来新高 30-year U.S. Treasury yield surges to 5.60%, highest since 2002: when this “anchor of asset pricing” shakes, global wealth must adjust along with it
If global financial markets were to choose the “most expensive price tag,” many would point to long-term U.S. Treasury yields—they are known as the “anchor of global asset pricing” because they largely determine the “risk-free floor” for everything from mortgages and corporate bonds to all risk assets.
The latest data caused this anchor to shake: On September 29, the 30-year U.S. Treasury yield briefly rose to 5.595%, then climbed further to 5.60% late in the session, reaching its highest level since 2002. Behind this is the continued global tightening cycle.
As energy prices rise and inflationary pressures resurface, markets are continually raising their expectations for the Federal Reserve’s interest-rate path.
More importantly, the yield curve is flattening at an accelerating pace: The spread between 2-year and 10-year U.S. Treasuries, once nearly 75 basis points, has now narrowed to only about 21 basis points.
Historically, an inverted yield curve has been called a “recession signal light”—the yield curve inverted before all of the past nine U.S. recessions.
However, this signal is not always reliable. The sustained inversion from 2022 to 2024 did not bring about a corresponding recession and was viewed by the market as a “false alarm.”
Professionals are more inclined to treat it as an early warning rather than confirmation: What really needs watching are the financial conditions behind the curve—persistently high interest rates will continue to raise corporate financing costs and amplify volatility in globally overvalued assets.
Meanwhile, the OECD’s latest outlook raised its forecast for global economic growth in 2026 to 2.9%, and the resilience of the world economy amid headwinds remains impossible to underestimate$NAS100 ‌
repost-content-media
NAS100+0.22%
  • 2
#每周来晒 #​MU PCE cools, Micron earnings beat expectations—how should we trade U.S. stocks from here?
U.S. stocks gave a very typical signal last night: the macro picture is not bad, AI is strong, yet the indexes did not celebrate.
The Dow fell, the S&P was weak, and the Nasdaq edged higher, showing that the market is no longer simply trading “good news” but weighing two things: inflation has fallen, but the economy remains strong; AI is hot, but opportunities are becoming more concentrated.
August PCE rose 3.4% year over year, while core PCE rose 3.0% year over year and 0.2% month over month—all
ThisIsTranslateContent:
#每周来晒 #​MU PCE cools, Micron earnings beat expectations—how should we trade US stocks going forward?
Last night's US stock market gave a classic signal: the macro backdrop was not bad, AI was strong, yet the indexes did not celebrate.
The Dow fell, the S&P was weak, and the Nasdaq edged higher, showing that the market is no longer simply trading “good news,” but weighing two things: inflation has fallen, but the economy remains strong; AI is hot, but opportunities are becoming more concentrated.
August PCE rose 3.4% YoY, while core PCE rose 3.0% YoY and 0.2% MoM, all below expectations, and short-end rates fell alongside rate-hike expectations. But consumer spending rose 0.9% MoM, economic resilience remains, and long-end rates remain under pressure.
What the market is really worried about is this: if the economy stays strong, when will the Fed have room to pivot? Funds are therefore clustering around certainty—AI computing power, cloud, data centers, semiconductors, and a handful of platform companies. This is structural crowding, not a broad-based rally.
I. Micron wins on pricing, not volume
Micron's earnings report last night brought the story down to orders.
Fourth-quarter revenue was $54.23 billion, up 379% YoY, with full-year revenue at $133.188 billion; the midpoint of next-quarter revenue guidance was $61.5 billion, while adjusted EPS guidance was $38.15, both above expectations.
The source of profits is even more important: DRAM revenue was $39.8 billion, accounting for 73% of total revenue, with prices surging QoQ while shipments rose only by the mid-single digits—this is price increases, not volume growth.
Core data center revenue was $18 billion, up 56% QoQ, with a 90% gross margin. Most of HBM capacity for 2027 has already been locked in, while remaining performance obligations under long-term agreements are approximately $150 billion.
The AI trade is not about a single GPU, but about who has pricing power across the entire computing-power chain. Yet Micron did not surge after hours, pulling back after an initial jump and ultimately gaining less than 1%.
The reason is simple: it has already more than tripled this year, so good news had been priced in early; gross-margin guidance of 86.25% was slightly below expectations, and management also said price increases would moderate. The upcycle remains intact, but the market has already begun asking: how long can this strong cycle last?
II. Platforms are competing for distribution; space remains an option
Google's performance last night looked like the “new king,” representing another track. Search, YouTube, and Android are the entry points, while Cloud and its in-house TPU form a closed loop.
In the second half of the model race, whoever can bring costs down and embed models into products users open every day will have thicker cash flow. Regulation remains a discount on valuation.
Space, by contrast, is the comparison group. Rocket Lab and AST SpaceMobile have high elasticity, but cash flow is still far off. With rates above 5%, the longer the duration, the greater the pain.
The advice for everyone is: Micron is about orders, while space is an option; they should not be treated as the same position.
III. Friday's nonfarm payrolls are the real pricing switch
ADP showed that private-sector employment increased by 90,000 in September, above expectations of approximately 70,000, while hourly earnings were still up 3.2% YoY. If Friday's nonfarm payrolls and hourly earnings are both strong, long-end rates will have further room to rise, and high-valuation growth stocks will remain under pressure; if employment cools moderately, the market will resume trading the soft-landing narrative. Headcount determines the narrative, while hourly earnings determine whether the Fed dares to pause.
In terms of execution, watch nonfarm payrolls first, then act.
If the data are strong, do not chase the indexes; if the data cool, add to computing-power chains with pricing power. Storage and data centers are preferable to space themes. Micron has validated demand and remains reasonably valued, but be cautious about chasing highs.
Finally, wishing everyone successful trading and a happy National Day holiday.🎉$MU
repost-content-media
SPX-0.54%
NAS100+0.23%
DRAM+2.90%
RKLB+1.11%
ASTS-3.11%
  • 1
#核心PCE与GDP终值 U.S. inflation cools, rate expectations shift, bringing positive signals to the crypto market
Recent U.S. inflation data has shown signs of easing, reducing concerns that the Federal Reserve will continue raising interest rates. Expectations for monetary easing are heating up, which could provide support for risk assets such as Bitcoin.
According to the latest August PCE data, the U.S. headline PCE price index rose 0.3% month-on-month and 3.4% year-on-year; core PCE rose 0.2% month-on-month and 3.0% year-on-year. The personal consumption expenditures price index released this time
ThisIsTranslateContent:
#核心PCE与GDP终值 U.S. inflation cools, rate expectations shift, and the crypto market receives a positive signal
Recent U.S. inflation data has shown signs of easing, reducing market concerns over further Federal Reserve rate hikes and raising expectations for monetary easing, which could support risk assets such as Bitcoin.
According to the latest August PCE data, the U.S. headline PCE price index rose 0.3% month-on-month and 3.4% year-on-year, while core PCE rose 0.2% month-on-month and 3.0% year-on-year. The personal consumption expenditures price data released this time came in below broad market expectations.
PCE is a key inflation indicator closely watched by the Federal Reserve. The relatively moderate data directly lowered market expectations for another rate hike by the Fed in October.
In financial market logic, a high interest rate environment will continue to suppress risk asset valuations. Once rate hike expectations cool, funds will be more willing to flow into highly elastic asset sectors, benefiting crypto assets as well.
Brendan Ma, head of investment strategy at the Arbitrum Foundation, said that core PCE rising 0.2% month-on-month was a positive signal for the Federal Reserve. If September CPI data continues to show this trend of slowing inflation, pressure on the Fed to raise rates in October will decline further.
For the crypto market, macro interest rates have always been a key variable driving the broader market. The previous market downturn was largely caused by the Federal Reserve's continued rate hikes, which tightened market liquidity and led funds to withdraw from high-risk assets.
If inflation continues to fall, the Federal Reserve's monetary policy shifts from tightening to waiting, or even begins a rate-cutting cycle in the future, improved market liquidity conditions will generally make it easier for crypto assets such as Bitcoin to enter a sustained trend.
However, this should also be viewed objectively. A single month's inflation data can only represent a short-term change, and inflation could rebound. If prices rise again, the Federal Reserve's policy stance could shift once more.
The market cannot conclude that the trend has reversed based on a single data release. A series of key economic indicators, including CPI and nonfarm payrolls, will need to be tracked continuously.
Overall, the current macro environment is showing signs of marginal improvement, providing a sentiment boost to the crypto market, but the market remains uncertain. Confirming a turning point in the macro cycle will require validation from more consecutive data releases. Investors should view short-term positive news rationally and remain alert to risks arising from market volatility.
repost-content-media
BTC+1.25%
ARB-1.81%
#美光即将披露四季度财报 Micron’s “blowout” earnings report, yet stock price wavers: The memory supercycle is nowhere near its peak—why is the market no longer excited?
After the US market closed on Thursday, Eastern Time, Micron Technology (MUUS) closed out its 2026 fiscal year with an almost flawless earnings report.
The report showed that the company’s fourth-quarter revenue was $54.23 billion, up 379% year over year and 31% quarter over quarter, setting a record for the sixth consecutive quarter; adjusted earnings per share came in at $33.42, up more than tenfold year over year; gross margin climbed t
ThisIsTranslateContent:
#美光即将披露四季度财报 Micron’s “blowout” earnings report, yet its stock fluctuates: The memory supercycle is far from peaking—why is the market no longer excited?
After the U.S. market closed on Thursday Eastern Time, Micron Technology (MUUS) brought its fiscal 2026 to a close with an almost flawless earnings report.
The report showed that the company’s fourth-quarter revenue reached $54.23 billion, up 379% year over year and 31% quarter over quarter, setting a record for the sixth consecutive quarter; adjusted earnings per share came in at $33.42, up more than tenfold year over year; and gross margin climbed to 87%, up 2.1 percentage points from the previous quarter.
For the full fiscal year, Micron’s total revenue reached $133.19 billion, 3.5 times the record level of the previous fiscal year. Data center revenue quadrupled year over year, while full-year DRAM revenue surpassed $100 billion for the first time.
Guidance for the next quarter also far exceeded expectations: the midpoint of the revenue forecast was $61.5 billion, above Wall Street’s expectation of $57.57 billion; the midpoint of adjusted EPS guidance was $38.15, above Wall Street’s expectation of $35.81.
However, after the earnings report was released, Micron’s stock initially rose about 2% in after-hours trading, then quickly turned lower, fluctuating between bulls and bears. As of press time, the stock was trading around $1,060 in premarket trading, down approximately 0.5%. Why did an almost “perfect-score” earnings report fail to ignite market enthusiasm?
Strength of the results: Beyond the numbers
The strength of Micron’s earnings report was first reflected in the qualitative shift in its revenue mix. In the fourth quarter, revenue from its core data center business (CDBU) reached $18 billion, up 56% quarter over quarter, with gross margin as high as 90%, up more than tenfold year over year. AI server demand was the core driver. Data center operations currently account for 33% of the company’s total revenue, while cloud storage revenue reached $16.3 billion, accounting for 30%. Combined, the two businesses now contribute more than 60% of total revenue. In DRAM, revenue reached $39.8 billion, up 343% year over year. Bit shipment volume grew by a mid-single-digit percentage quarter over quarter, but prices rose by a high-single-digit percentage, indicating that growth was driven primarily by pricing rather than simply by higher shipment volumes, reflecting extremely tight industry supply and demand. NAND revenue reached $14.1 billion, up 526% year over year and 42% quarter over quarter. Bit shipment volume grew by approximately 10%, while prices rose by approximately 30%, further underscoring the severity of supply bottlenecks.
Also worth noting was key information Micron disclosed on its earnings call regarding future capacity: More than 75% of fiscal 2027 shipments have already been locked in through long-term agreements. The number of strategic customer agreements (SCAs) increased from 16 in the previous quarter to 26, total customer prepayments rose from $22 billion to $32 billion, and remaining performance obligations (RPO) reached approximately $150 billion, up sharply from approximately $100 billion in the previous quarter.
These agreements are expected to cover more than 35% of Micron’s revenue through 2030, with approximately three-quarters already having pricing frameworks established. Most include price ranges, and some agreements even extend into 2031.
On capital expenditures, Micron announced approximately $25 billion in capital spending for the first half of fiscal 2027, including approximately $11.5 billion in the first quarter. Spending will increase further in the second half, with most of the incremental investment going toward new wafer fabrication plants rather than simply equipment purchases. Regarding capacity ramp-up, output from the first Idaho plant has been brought forward to mid-CY27; the Singapore plant is expected to begin output in 2HCY28; completion of the cleanroom at the Hiroshima plant has been brought forward to the end of CY28; and construction has begun on the New York plant. CFO Mark Murphy disclosed on the earnings call that the company generated $44 billion in operating cash flow and $33.2 billion in free cash flow in the fourth quarter, and pledged to return 100% of excess cash to shareholders in the future.
Memory is defining AI’s boundaries
On the earnings call, Micron CEO Sanjay Mehrotra described the industry’s current transformation as follows: “Superintelligence is creating the most compelling opportunity in Micron’s history.”
This was not empty rhetoric.
From an industry perspective, the expansion of AI model sizes is driving not only demand for computing power but also exponential growth in demand for memory capacity and bandwidth. Mehrotra said on the call that running AI applications on platforms with greater memory capabilities can enable more scalable growth and improve the end-user experience. In other words, memory is not only an important part of AI infrastructure but also a key variable determining the upper limit of AI system capabilities. In HBM, Micron has partnered with NVIDIA (NVDAUS) to develop the industry’s first customized HBM solution. In the first quarter of 2026, Micron began mass production of its HBM4 12-high-stacked 36GB product for NVIDIA’s Vera Rubin platform, achieving bandwidth of more than 2.8TB per second. Mehrotra revealed that most of HBM’s 2027 supply has already been contracted: “Prices are up significantly year over year, narrowing the gross-margin gap between HBM and traditional DRAM.”
This means the HBM business is shifting from a “strategic investment” to a “profit contributor.” Over the long term, Mehrotra outlined “physical AI” as a new growth engine on the earnings call. He emphasized that autonomous vehicles at Level 4 and above generally require more than 200GB of memory and several TB of storage, an order of magnitude more than current Level 2+/Level 3 vehicles; humanoid robots are also expected to have similar requirements. He stressed that by the end of this century, physical AI will become an important driver of memory demand.
A supply-and-demand analysis published by JPMorgan before the earnings report showed that HBM supply-demand shortfalls would be 20%, 19%, and 16% in 2026, 2027, and 2028, respectively, with the cumulative shortage reaching 23 weeks by 2028.
Citi’s analysis was more aggressive, forecasting that the supply-demand shortfall would widen from -21% in 2027 to -36% in 2028.
Deutsche Bank’s estimates indicated that the DRAM supply-demand shortfall would widen further in 2027 and 2028, with the market potentially not reaching balance until 2029.
These figures point to the same conclusion: AI-driven memory demand has entered a phase of structural shortage rather than cyclical fluctuation.
Why is the stock fluctuating?
Given such strong fundamentals, why has Micron’s stock barely moved?
First, gross-margin guidance became a short-term “brake” on sentiment. Fourth-quarter gross margin of 87% did exceed analysts’ expectation of 86.9%, but gross-margin guidance for the next quarter was approximately 86.25%, below the market expectation of 87.4%.
CFO Murphy explained that the first quarter would be the low point for full-year fiscal 2027 gross margin, mainly due to sales of higher-cost inventory and higher compensation expenses. Gross margin is expected to gradually recover in subsequent quarters, but the pace of price increases will moderate.
With expectations extremely high, even a 0.45-percentage-point shortfall in gross-margin guidance was enough to trigger profit-taking by some investors.
Second, the sharp increase in capital expenditures overshadowed the positive impact of the earnings beat.
The market has begun to worry that Micron is shifting from a “gross-margin expansion model” to a “capacity expansion model.” Some analysts have noted that as financial results continue to exceed expectations, Micron’s stock may enter a consolidation phase rather than continue rising sharply simply on positive earnings news. The significant increase in capital expenditures implies higher depreciation expenses in the future, and profit margins may face structural pressure, making this an important factor weighing on the stock in the short term. Other analysis also pointed out that the news of increased capital spending overshadowed the earnings beat after hours.
In its latest research report, a Goldman Sachs team led by analyst James Schneider also noted that Micron’s latest quarterly results and next-quarter guidance were both significantly above Wall Street expectations. The company also disclosed more long-term customer agreements and substantially raised its capital expenditure plan, factors that could support a moderate rise in the stock price. However, gross margin was slightly below Goldman Sachs’ expectations, and investor expectations had already been elevated, limiting room for further valuation expansion. From investors’ perspective—and perhaps the most fundamental reason—the market’s focus is shifting from “how strong is the upcycle?” to “how long can it last?”
Morgan Stanley said after the earnings report that the market’s focus was shifting. Investors are no longer concerned only with how strong current results are, but have begun examining whether this supercycle can continue beyond 2028.
Micron’s stock has risen sharply since the beginning of the year, and the market has largely priced in better-than-expected results. Despite its strong fundamentals, Micron’s stock is still trading at approximately 7 times forward earnings, well below the average of around 10 times over the past two years. Expectations for a significant slowdown in growth in fiscal 2027 and fiscal 2028 have already been partially reflected in the valuation.
In addition, expectation management may have entered a phase where “even exceeding expectations is not enough.” Some analysts have noted that analysts now view Micron’s ability to exceed its own guidance as the norm, and the market is looking for it to “exceed the expectations of exceeding expectations.” Options-market data showed that over the past 10 earnings reports, Micron’s average next-day stock-price move was 9.4%, with a median of 9.1%. However, options for this report priced in a move of only approximately 6.3%, indicating that expectations for sharp post-earnings volatility had fallen significantly.
Goldman Sachs maintained its “Neutral” rating after Micron released its earnings report, but raised its price target from $1,100 to $1,250, based on an 18x P/E multiple and revised normalized EPS of $70. The Schneider team concluded that risk and reward are roughly balanced at current levels, but it would consider becoming more constructive on Micron if the industry maintains supply growth discipline through 2028 and beyond.
In fact, the significance of Micron’s earnings report has gone beyond the performance of a single company.
The core signal it conveys is that AI infrastructure demand for memory is not a short-term pulse, but a long-term structural trend that could continue through 2028 or even longer.
For investors, however, the challenge is this: Once a company’s strong fundamentals become consensus, the source of excess returns is no longer simply confirming the strength of the upcycle, but determining whether the cycle’s durability can exceed market expectations. The current valuation of approximately 7 times forward earnings reflects market concerns about slowing growth, but may also contain underestimated long-term value.#每周来晒 $MU ‌
repost-content-media
MU+2.85%
NVDA+1.16%
JPM+0.74%
C-1.94%
GS-0.53%
#核心PCE与GDP终值 PCE data lands! CME rate expectations shift dramatically, expectations for Fed rate hikes cool rapidly, global assets receive a turning-point signal
After the release of the US August core PCE inflation data, CME FedWatch interest rate futures data was updated simultaneously, and market expectations for the Federal Reserve's subsequent rate hikes fell notably. Inflation data came in below expectations, prompting funds to reprice the Federal Reserve's future monetary policy path.
I. Latest CME FedWatch probability data
According to CME FedWatch tool statistics: At the Federal Reser
ThisIsTranslateContent:
#核心PCE与GDP终值 PCE data is in! CME rate expectations shift sharply, Fed rate hike expectations cool rapidly, and global assets receive a turning-point signal
After the release of the US August core PCE inflation data, CME FedWatch interest rate futures data was updated simultaneously, and market expectations for subsequent Fed rate hikes declined significantly. Inflation data came in below expectations, prompting funds to reprice the Fed’s future monetary policy path.
I. Latest CME FedWatch Probability Data
According to the CME FedWatch tool: The probability of a rate hike at the Fed’s October 28 meeting fell to 37.1%. Compared with 50.9% the previous day, this was a sharp single-day decline of 13.8 percentage points. Meanwhile, the market’s expectation that rates will be raised at least once more this year before the end of December fell to 86.8%, down 4.8 percentage points from 91.6% the previous day. By component, the market’s pricing for the year-end interest rate range is as follows:
Federal funds rate rising to 4.00%-4.25%, probability 57.5%​
Federal funds rate rising to 4.25%-4.50%, probability 29.3%
Simply put: After core PCE came in below expectations, traders believe the need for the Fed to continue raising rates in October has declined significantly. The market is no longer certain that a rate hike will occur in October, with the timing of the hike increasingly being pushed back to December.
II. The Logic Behind the Data
Core PCE is the inflation indicator most closely watched by the Fed. This time, the month-on-month increase was just 0.2%, below the market expectation of 0.3%, indicating that the slowdown in US inflation exceeded market expectations.
With inflationary pressure easing, the Fed does not need to continue raising rates aggressively. Expectations for the duration of high interest rates have shortened, which is highly favorable for global growth-style assets.
Falling rate expectations directly trigger a chain reaction: US Treasury yields come under downward pressure, US stock index futures rise rapidly, and gold strengthens in the short term. High-valuation technology growth stocks are the most sensitive to interest rate changes, while sectors such as memory chips, AI computing power, and CPO are seeing valuation pressure ease.
However, one point needs to be viewed objectively: Although the probability of a rate hike in October has declined significantly, the probability of at least one more rate hike this year remains as high as 86.8%. The market has not completely abandoned expectations for a rate hike this year; it has merely postponed the timing of the hike, rather than directly shifting to a rate-cutting cycle. Inflation has not yet returned to the Fed’s 2% target range, and monetary policy remains relatively tight, so this should not be interpreted as全面宽松.
III. Key Areas to Monitor Going Forward
1. The sustainability of the 10-year US Treasury yield.
If yields continue to decline, the recovery logic for growth sectors will continue; if they rebound rapidly, the positive effects will quickly fade.​
2. Fund support after the official US stock market open.
The rise in stock index futures reflects only premarket expectations. It is necessary to observe whether gains can hold after the official open and guard against a pullback as positive news is priced in.
​3. Subsequent US employment, CPI, and other data.
Inflation is dynamic, and an improvement in monthly PCE does not mean inflation will continue to decline.
repost-content-media
GLDX+0.63%
PAXG+0.55%
#OneGate见证计划 Altcoin Season Index nearing 75! During the 7-day National Day holiday, will the crypto market see a second wave of celebration, or a short-term top?
The crypto market has experienced rotation recently: BTC has remained strong, ETH and SOL have risen, and altcoins have started to catch up.
Especially over the past two weeks: Driven by news of the SEC innovation exemption, UNI surged about 40%ARB, while RAY, AR, and several other sectors gained more than 20%. The Altcoin Season Index rose rapidly, reaching a high of 74 and coming very close to the “altcoin season confirmation line
ThisIsTranslateContent:
#OneGate见证计划 The altcoin season index is nearing 75! During the 7-day National Day holiday, will the crypto market see a second wave of celebration, or reach a short-term top?
The crypto market has experienced rotation recently: BTC has remained strong, ETH and SOL have risen, and altcoins have begun to catch up.
Especially over the past two weeks: Stimulated by the SEC innovation exemption news, UNI surged about 40%ARB, RAY, AR, and several other sectors rose by more than 20%. The altcoin season index rapidly climbed, reaching as high as 74, very close to the “altcoin season confirmation line” of 75. Judging from sentiment indicators, the market has clearly entered a stage of rising risk appetite.
But one question has emerged: Does the altcoin season index nearing overheated levels mean the market is already approaching a top?
My view: The market may enter a period of consolidation or even divergence in the short term, but it does not currently look like a bull-market top.
The reason is that a true major bull-market top is usually accompanied by: mass mania, a large influx of new users, junk coins surging across the board, extreme expansion of high leverage, and media coverage of financial freedom everywhere. The current market is more characterized by: institutional funds driving the market, BTC dominance remaining relatively high, capital concentrated in a few strong-narrative altcoins, and rotation only just beginning. Therefore: this is not a bull-market top, but more like a release of risk appetite during the middle stage of a bull market.
01 Altcoin season index: What does nearing 75 mean? Looking at the CoinGlass altcoin season index: the current index is around 62, while the highest level a few days ago was: 74, just one step away from 75.
Historically: below 25:
BTC stage 25–50: BTC leads, with some altcoins catching up
50–75: Altcoin rotation stage
Above 75: Full altcoin season begins. The current level is actually in: the acceleration zone after the start of altcoin season.
But note: A rising index does not mean that every altcoin has an opportunity.
The future is more likely to unfold as follows:
Stage one: Strong narratives rise, such as: RWA, DeFi, AI+Crypto, DePIN, Layer2
Stage two: Capital spreads, such as: second-tier protocols and small-cap projects rising.
Stage three: Junk-coin mania
The current market is closer to: the transition from stage one to stage two.
02 Why might short-term narratives struggle to take over?
The biggest driver over the past week was not simply a technical breakout.
It was: policy catalysts + the repricing of new narratives. For example: the SEC innovation exemption prompted the market to imagine anew: tokenization → securities on-chain → on-chain trading → DEX liquidity → UNI, RAY, and other beneficiaries. This is a complete industry chain.
But the problem is that the market has already begun trading this expectation.
The first batch: UNI, ONDO, and the SOL ecosystem have already attracted capital.
The next step requires: new catalysts to continue driving the market. Otherwise, the market could easily see: news-driven surge → short-term funds take profits → hot sectors cool down → waiting for the next narrative. Therefore, the biggest feature of the 7-day National Day holiday may be: upside remains, but the market will not simply replicate the broad surge of the past few days.
03 7-day National Day holiday market scenarios
Scenario one: Bullish trend (lower probability) Conditions: BTC holds key levels, US Treasury yields decline, the market continues trading tokenization/RWA, and ETF inflows continue.
Trend: BTC consolidates upward → ETH and SOL continue catching up → RWA, DeFi, and AI sectors continue rotating.
Possible development: UNI, ONDO, LINK, and the SOL ecosystem rise for a second time.
Feature: This is not a broad altcoin season. Instead: strong-narrative assets continue attracting capital.
Scenario two: Consolidation and digestion
This is currently the more likely scenario. The reason is that the altcoin season index is already near a high level. Short-term funds have taken significant profits.
During the National Day holiday: Trading volume in Europe and the US will decline, some funds will be on holiday, and large funds will wait for the October FOMC.
Possible trend: BTC consolidates at high levels, ETH and SOL outperform BTC, and rotation takes place within the altcoin market. A coin that rises 20% today may correct 10%–15%. However, coins with strong trends may continue rising after the correction.
This is: healthy rotation during a bull market.
Scenario three: Black swan correction, which requires close attention.
Possible sources:
1. Federal Reserve policy. The biggest variable in the market currently is: Will rates be raised again in October? Market expectations for an October rate hike have fluctuated recently. Some market data shows that as inflation data came in below expectations and Fed officials signaled caution, the probability of another rate hike in October has declined; however, some institutions still believe inflationary pressure could lead to further tightening. If the Fed remains hawkish in October, this could result in: a stronger dollar → tighter liquidity → pressure on risk assets → a short-term Crypto correction.
2. Policy and regulatory risks
Over the next three months, focus on:
United States: the Crypto market structure bill, stablecoin regulation, and subsequent SEC rulemaking. If policy progresses smoothly: bullish.
If there are: delays, disagreements, or regulatory conflicts, the market may cool in the short term.
3. Leverage risk
The market has just experienced a rapid rise in altcoins. Watch: perpetual futures funding rates, open interest, and liquidation volumes.
If: prices rise while leverage increases rapidly. This could easily lead to: a rapid liquidation event.
04 Over the next three months, focus on three variables
Variable 1: Will tokenization continue to spread?
Currently: SEC policy → ONDO → DTCC → institutional assets. This direction has already formed a trend. For a truly major market move in the future, we need to see clear action from traditional financial institutions such as BlackRock, Fidelity, and JPMorgan.
Variable 2: Will altcoin capital expand?
The key is not how much BTC rises. It is whether, after BTC rises, capital flows into: ETH, SOL, DeFi, AI, and RWA.
If only BTC rises: risk appetite is insufficient.
If: BTC stabilizes → ETH and SOL rise → altcoins spread → that is a true altcoin season.
Variable 3: Will liquidity improve?
The core of a Crypto bull market is not stories, but money. Focus on: Federal Reserve policy, US Treasury yields, the dollar index, and ETF flows.
05 My National Day holiday trading strategy
Given the current environment, I will not:
❌ Go all-in chasing gains
❌ Panic-sell because the altcoin index is nearing 75
❌ Immediately chase a coin after seeing others rise 20%–40%. A more reasonable strategy is:
First: Retain core positions in BTC, ETH, and high-quality public chains.
Second: Look for pullback opportunities in strong narratives. Focus on: RWA: ONDO, LINK, SOL. DeFi: UNI, AAVE. Solana ecosystem: RAY.
Third: Set event-trading rules.
If there is: policy confirmation → a rise in leading assets → sector expansion → increased trading volume, participation is possible. If chasing after a single coin surges 50%, the risk-reward ratio declines.
06 Final summary
The current market is not at the end of the bull market, but it is also not a mindless frenzy.
It looks more like: the second stage of a bull market, with capital spreading from BTC into strong-narrative altcoins. The altcoin season index nearing 75 is an important signal: it shows that market risk appetite is rising.
But over the next three months: what truly determines the market’s upside is not sentiment, but:
1. Whether Federal Reserve policy shifts
2. Whether tokenization/RWA continues to gain institutional validation
3. Whether altcoin capital forms sustained rotation
During the 7-day National Day holiday, the more likely outcome is high-level consolidation and hot-sector rotation, rather than a broad frenzy.
The biggest opportunities may not necessarily come from chasing gains, but from: identifying in advance the next industry trend that has not been fully priced in. This is also why the current focus is on: tokenization → RWA → DeFi → on-chain financial infrastructure. #每周来晒
repost-content-media
BTC+1.25%
ETH+0.52%
SOL-0.05%
UNI+1.47%
ARB-1.81%
#美光即将披露四季度财报 Micron's earnings blowout: What are memory stocks waiting for before their valuation expansion continues?
On September 30, U.S. Eastern Time, Micron announced its fiscal fourth-quarter 2026 results: revenue of $54.23 billion, adjusted EPS of $33.42, and an adjusted gross margin of 87%. The midpoint of its revenue guidance for the next fiscal quarter is $61.5 billion, while adjusted EPS guidance is $38.15. Revenue and profit remain strong, yet the immediate after-hours gain following the earnings release was less than 1%. The results confirmed the strength of the memory industry, b
post-image
MU+2.85%
#核心PCE与GDP终值 Data can cool, but interest rates do not lie—the real thing weighing on gold prices has never been the next rate hike, but the cost of holding it
On the last night of September, the dovish outcome landed. At 20:30 on Wednesday (September 30), the US August PCE was released: headline PCE rose 3.4% year-on-year and core PCE rose 3.0% year-on-year, both below expectations (3.7% and 3.3%), while final Q2 GDP was revised up to 2.2%. Gold prices rose in a straight line after the data was released, briefly touching $4,219 intraday. The CME FedWatch showed the probability of a rate hike i
post-image
XAUUSD+0.02%
  • 2
Featured#核心PCE与GDP终值 Core PCE and Q2 GDP Final Estimate Preview: At 20:30 tonight, two “rate-hike detectors”

Tonight (9/30) from 20:15-20:30, “two data releases + ADP” will come in quick succession: Core PCE is expected to hold at 3.3% (sticky inflation narrative), Q2 final GDP is expected to hold at 1.5% (in the past, low attention), and ADP is expected at 70,000 (previously 38,000).
The real focus is not the “numbers themselves,” but: if PCE exceeds expectations → the probability of a rate hike in October (currently down from 68% to around 50%) will surge again; if PCE falls + ADP is weak → rate-h
ThisIsTranslateContent:
#核心PCE与GDP终值 Core PCE and Q2 GDP final estimate preview: Tonight at 20:30, two “rate-hike detectors”

Tonight (9/30) from 20:15-20:30, three releases will come in rapid succession: core PCE expected at 3.3%, unchanged (sticky inflation narrative), Q2 GDP final estimate expected at 1.5%, unchanged (backward-looking, low attention), and ADP expected at 70,000 (previously 38,000).
The real focus is not the “numbers themselves,” but rather: if PCE beats expectations → the probability of a rate hike in October (currently down from 68% to around 50%) surges again; if PCE falls + ADP is weak → rate-hike expectations cool further. Also, don’t forget the backdrop: the Atlanta Fed forecasts Q3 GDP as high as 5.0% — “an overheated economy” is the foundation of the rate-hike narrative.

I. Core PCE (August): Expected to hold steady; watch for any “surprise”
Consensus forecast: August headline PCE and core PCE are both expected to rise 0.3% month-on-month; headline PCE at 3.7% year-on-year and core PCE at 3.3% year-on-year (unchanged from July) — still far above the 2% target, with virtually no sign of rapid easing in price pressures.
But there are three “hidden variables”:
1. Methodological revisions: This release will incorporate the BEA’s annual benchmark revisions, which are expected to lower historical core PCE data by around 0.2 percentage points — the published “revision” may make inflation readings look better, but that does not mean inflation has actually fallen.
​2. Regions’ more hawkish forecast: They see core PCE at 3.4% year-on-year (above the consensus of 3.3%) — if the reading comes in at 3.4% tonight, the market will immediately reprice.
​3. Warsh’s preference for the “trimmed mean”: The chairman himself puts more faith in trimmed mean PCE than in this data point — even if the reading is high, his policy response may not be what the market expects (a source of expectation gaps).
How to read it: ≥3.4% = rate-hike expectations heat up (October probability returns to 60%+); 3.3% unchanged = status quo; ≤3.2% = puts the brakes on rate-hike expectations.

II. Q2 GDP final estimate (third estimate): Expected to hold at 1.5%
Consensus: median **+1.5%** (annualized), range 1.5-1.9%; the second estimate was also +1.5% (Q1 was +2.1%).
Why it does not matter:
Q2 is “backward-looking” — the market has already priced in this figure, and the final estimate is usually revised only slightly, so it will not drive the market.
​The real signal is in Q3: the Atlanta Fed’s GDPNow forecasts Q3 GDP as high as 5.0% (9/25) — the “overheating” acceleration from 1.5% to 5% is what gives the Fed the confidence not to signal easing and even to continue hiking.
This final estimate will incorporate annual revisions (all data from Q1 2021 to Q1 2026 will be revised), and some individual figures may “change,” but the broad “overheating economy” framework will not change.

III. Combined scenarios (how to read tonight’s data)
Scenario one (hike camp wins): Core PCE 3.4%+ and ADP >70,000 → October rate-hike probability returns to 60%+ → dollar strengthens, U.S. stocks and crypto come under pressure, BTC retests $82K
Scenario two (wait-and-see camp wins): Core PCE below 3.2% + ADP <50,000 → rate-hike probability falls below 40% → risk assets catch their breath, BTC rebounds to $85K+
Scenario three (neutral, most likely): PCE 3.3% unchanged + ADP 50,000-70,000 → the market remains stuck in the “50-50 odds of an October hike” state → markets continue to grind, waiting for Friday’s nonfarm payrolls to settle the matter.
My view: Scenario three is the most likely — sticky PCE (3.3%) is the baseline case, so tonight will probably be “neither hot nor cold”; the real decider is still Friday’s nonfarm payrolls.

Impact on the market
BTC: The $82K lifeline remains unchanged — hawkish data tonight → dip toward $82K; dovish data → rebound to $85K; neutral → continue grinding between $82-85K.
​U.S. stocks: MU earnings are due after tonight’s session (after the U.S. market close) — with PCE and MU earnings landing together, the memory sector is likely to be highly volatile tonight.

Tonight’s core PCE is the sticky “3.3% unchanged” story + Q2 GDP is the “1.5% backward-looking” sideshow — what really moves the market is “whether there is a surprise,” not “whether it matches expectations.” Don’t take a directional position before the data is released; act afterward. Friday’s nonfarm payrolls are the real finale of the week. $BTC ‌
repost-content-media
BTC+1.25%
MU+2.85%
  • 10
Featured#BTC回落至83000美元 The Crypto Market Amid the Resumption of the Rate-Hike Cycle: Bitcoin Seeks a New Equilibrium Between the “Currency Debasement Trade” and “Liquidity Drain”
In September 2026, the global macro environment underwent a profound shift: after a three-year hiatus, the Federal Reserve resumed raising interest rates, lifting the federal funds rate to the 3.75%-4.00% range; the 10-year U.S. Treasury yield climbed to 5.20%, its highest level since 2007; and the 30-year Treasury yield broke above 5.5%, reaching a 22-year high.
However, contrary to conventional wisdom, Bitcoin did not colla
ThisIsTranslateContent:
#BTC回落至83000美元 The Crypto Market as the Rate-Hike Cycle Resumes: Bitcoin Seeks a New Equilibrium Between the “Currency Debasement Trade” and “Liquidity Drain”
In September 2026, the global macro environment underwent a profound shift: After a three-year hiatus, the Federal Reserve resumed rate hikes, raising the federal funds rate to a range of 3.75%-4.00%; the 10-year U.S. Treasury yield climbed to 5.20%, its highest level since 2007; and the 30-year Treasury yield broke above 5.5%, reaching a 22-year high.
However, contrary to conventional wisdom, Bitcoin did not collapse during the rate-hike cycle, instead showing rare resilience within the $75,000-$87,000 range.
This article provides an in-depth analysis of the tug-of-war between the two forces currently facing the crypto market—the liquidity-tightening pressure brought by the Federal Reserve’s renewed rate hikes on one side, and structural buying support from the resurgence of the “currency debasement trade” on the other—and offers a forward-looking assessment and practical strategy recommendations for the fourth-quarter market trend.
I. Macroeconomic Shift: The Federal Reserve Resumes Rate Hikes, Bringing a Sharp Change in the Global Interest-Rate Environment
On September 16, 2026, the Federal Reserve announced a 25-basis-point increase in the federal funds rate to a range of 3.75%-4.00%, marking the first rate hike since 2023. Behind this decision was a stubborn rebound in U.S. inflation—core CPI rose 0.3% month-on-month in August, exceeding the market expectation of 0.2%. More alarming is the loss of control over long-term rates. As of September 28, the 10-year U.S. Treasury yield had risen to 5.20%, its highest level since 2007. The 30-year Treasury yield also broke above 5.5%, reaching a 22-year high since 2004. U.S. federal debt has surpassed $40 trillion, while annual interest expenses exceed $1.2 trillion, accounting for approximately 25% of federal tax revenue—the vicious cycle of “issuing debt—paying interest—expanding the deficit—issuing more debt” is reinforcing itself.
It is worth noting that this rate-hike cycle is fundamentally different from the 2022 cycle. In 2022, the Federal Reserve started from zero interest rates and had ample room to raise rates; this time, the starting point is already 3.75%, while long-term rates are rising simultaneously, meaning the pressure on global risk-asset valuations may be no less significant than that from short-term rate hikes themselves. Caixin Weekly noted that this was the first time since 2006 that the central banks of the U.S., Europe, and Japan had raised rates in the same month, and that the return of “super central bank week” marked the definitive end of the era of global easing.
II. The Mystery of Bitcoin’s Resilience: Why Did It Rise Instead of Fall After the Rate Hike?
According to conventional logic, a Federal Reserve rate hike should be a major negative for the crypto market. Yet after the rate hike took effect on September 16, Bitcoin did not collapse, but instead rebounded from $76,150 to above $81,000 over the following days.
This phenomenon deserves in-depth analysis.
The first layer of logic: the “buy the expectation, sell the fact” pricing mechanism. As early as the release of the August core CPI data, the market had already fully priced in expectations for a September rate hike. PANews reported that the market had already had ample time to price in the hike, and if the Federal Reserve raised rates as expected, the market reaction could be relatively limited. In fact, Bitcoin had already fallen from above $79,000 to around $76,000 between September 10 and the rate hike on September 16, releasing pressure in advance.
The second layer of logic: the resurgence of the “currency debasement trade.” This is the core driver of the current market trend. The Securities Times reported that as the dollar weakened and both gold and Bitcoin rebounded sharply, the “currency debasement trade” was once again becoming the market’s dominant narrative. Stephen Coltman, head of macro at 21Shares, explicitly stated that the U.S. Treasury’s expansion of long-term Treasury buybacks was the “core catalyst” for Bitcoin’s latest surge.
The underlying logic is as follows: When the market worries that the U.S. Treasury is artificially suppressing long-term rates through buyback operations, it is effectively injecting liquidity into the market, which is equivalent to a form of “implicit quantitative easing.” Investors are beginning to realize that the U.S. government can neither reduce the deficit through fiscal consolidation nor withstand the damage high interest rates inflict on the economy, leaving it ultimately to return to the old path of “monetizing the fiscal deficit.”
Against this backdrop, Bitcoin, as “digital gold” for hedging against fiat-currency debasement, has actually become more attractive during the rate-hike cycle.
The third layer of logic: Bitcoin’s correlation with gold has reached a new high since the pandemic.
Data from the Securities Times shows that the 90-day correlation coefficient between Bitcoin and gold has risen to its highest positive level since the pandemic. This means Bitcoin is shifting from a “high-beta technology stock” toward an “inflation- and debasement-resistant asset,” a structural transformation with far-reaching implications for its long-term pricing logic.
III. Market Structure Analysis: Key Price Levels, Fund Flows, and Sentiment Indicators
From a technical perspective, Bitcoin is currently trading within a wide consolidation range of $75,000 to $87,000.
On September 21, boosted by the Treasury’s buyback plan, Bitcoin briefly surged to $86,603, but then retreated to around $83,000 after the 10-year Treasury yield broke above 5.2%. As of September 30, Bitcoin stood at $83,390, down approximately 3.5% for the month, while its amplitude reached as high as 12%.
Regarding key price levels, $84,000 is the recent dividing line between bulls and bears. It is both the high of multiple September rebounds and the area around the 200-day moving average. A decisive break above it could pave the way for a challenge of the previous high at $91,000; a loss of the monthly low at $76,000 could lead to a further decline toward $72,000.
Ethereum performed relatively weakly, standing at $2,670 on September 30, up approximately 3% for the month, but still some distance from the psychological threshold of $3,000. The ETH/BTC exchange rate has continued to decline, reflecting the market’s preference for holding the most liquid crypto assets amid tightening liquidity.
On-chain data shows that Bitcoin ETFs recorded continuous net inflows during the first three weeks of September, but inflows slowed significantly in the final week. Open interest in the derivatives market declined approximately 15% from August, indicating that leveraged funds have become more cautious amid rate-hike uncertainty.
IV. Fourth-Quarter Outlook: Three Scenarios and Response Strategies
Looking ahead to the fourth quarter, the core variables facing the crypto market are whether the Federal Reserve will raise rates again in October or December, and whether the 10-year Treasury yield can remain below 5.5%.
Scenario One: The Federal Reserve raises rates again in October and Treasury yields break above 5.5% (approximately 35% probability).
If core CPI continues to exceed expectations in October, the Federal Reserve may be forced into consecutive rate hikes. In that case, the “currency debasement trade” narrative will give way to the reality of “liquidity drain,” and Bitcoin could fall toward the $72,000-$75,000 range.
Response strategy: Reduce leveraged positions and increase stablecoin holdings while waiting for better entry opportunities.
Scenario Two: The Federal Reserve remains on hold and yields fluctuate at elevated levels (approximately 45% probability).
This is the mainstream scenario priced in by current CME interest-rate futures. The market expects the probability of an October rate hike to be approximately 49%, and the probability of at least one more rate hike this year to be approximately 87%.
Under this scenario, Bitcoin will most likely remain range-bound between $75,000 and $90,000, with structural opportunities in high-quality altcoins and DeFi protocols.
Response strategy: Trade the range, sell high and buy low, and watch for a breakout signal above $84,000.
Scenario Three: Inflation falls faster than expected and the rate-hike cycle ends early (approximately 20% probability).
If oil prices decline or the effects of tariffs fade, inflation could cool rapidly in the fourth quarter, giving the Federal Reserve room to resume rate cuts. Bitcoin could then challenge $91,000 and even the previous high of $126,000.
Response strategy: Position early, increase core BTC and ETH holdings, and monitor ETF fund flows as a leading indicator.
V. Practical Recommendations
First, reassess risk exposure.
In the current macro environment of “higher rates for longer,” crypto-asset volatility will rise systematically. It is recommended that crypto-asset allocations be kept within tolerable levels and that leverage of more than 3x be avoided.
Second, monitor the sustainability of the “currency debasement trade.” Bitcoin’s high correlation with gold is the market’s core narrative at present. Investors should also monitor gold prices, the U.S. Dollar Index—which has currently risen to 101.0—and the U.S. Treasury’s Treasury buyback operations. If the dollar continues to strengthen, Bitcoin’s “digital gold” narrative will face a test.
Third, use volatility for grid trading. Within the wide $75,000-$90,000 range, grid-trading strategies can effectively capture gains from volatility. It is recommended that funds be divided into 5-8 levels, with buy and sell orders placed at key support levels ($76,000 and $78,000) and resistance levels ($84,000 and $87,000).
Fourth, closely track the 10-year Treasury yield. The current yield of 5.20% is already near the “critical dividing line” warned of by Bank of America chief strategist Hartnett. If the 30-year yield remains firmly above 5.5%, global risk assets will face systematic revaluation pressure, and the crypto market will find it difficult to remain unaffected.
Fifth, remain sensitive to policy signals.
Federal Reserve Chair Kevin Warsh has consistently emphasized reducing the central bank’s footprint in the market, meaning the Federal Reserve has limited willingness to intervene in long-term rates. Investors should focus more on the Treasury’s debt-issuance structure and buyback operations, rather than merely watching the Federal Reserve’s rate decisions.
The crypto market in September 2026 is at a delicate balance point.
On one hand, the Federal Reserve’s resumption of rate hikes and surging Treasury yields are creating tangible liquidity pressure;
on the other hand, the resurgence of the “currency debasement trade” is providing Bitcoin with solid structural buying support. The tug-of-war between these two forces means the market is unlikely to see a one-way trend over the coming months, with wide-ranging consolidation becoming the norm.
For investors, this is both a challenge and an opportunity. In the complex environment where “higher rates for longer” coexist with “fiscal deficit monetization,” the simple strategy of “buy and hold” will no longer be effective. Sophisticated position management and the ability to capture macro signals with precision will become key sources of excess returns.
Bitcoin is evolving from a “speculative asset” into a “macro-hedging asset,” and the growing pains of this evolution are the cycle that every market participant must navigate. $BTC ‌
BTC+1.25%
XAUUSD+0.02%
ETH+0.52%
  • 10
Featured#Marvell涨4.5% U.S. stocks today saw a typical divergence of "the broader market falling while AI hardware rose"—the three major indexes closed slightly lower, but the Philadelphia Semiconductor Index rose 1.32%, while Marvell gained 4.5%, optical communications company Lumentum 5%, Applied Materials 5%, and ARM/Meta/Coherent more than 3%.
The nature of this AI hardware rally has changed: from "Nvidia standing alone" to the second stage of "expansion across the entire industry chain" (memory, optical communications, custom chips, and equipment rising together)—a characteristic of the main uptre
ThisIsTranslateContent:
#Marvell涨4.5% Today was a typical divergence day for U.S. stocks: “the broader market fell while AI hardware rose”—the three major indexes closed slightly lower, but the Philadelphia Semiconductor Index gained 1.32%, Marvell rose 4.5%, optical communications company Lumentum gained 5%, Applied Materials rose 5%, and ARM/Meta/Coherent gained more than 3%.
The nature of this AI hardware rally has changed: it has entered the second stage of “full supply-chain expansion” from “Nvidia standing alone” (memory, optical communications, custom chips, and equipment are all rising together)—a characteristic of the main upward phase, but also one that means valuations are beginning to rise across the board, making stock selection more difficult.
In the short term, Micron’s earnings report (after market close tonight) will be the “touchstone” for this rally.

I. Why AI hardware rose against the trend today: three drivers
Driver 1: Rising expectations for Micron’s earnings report (memory pricing power). Micron will release its earnings after market close tonight, and all seven investment banks are bullish—the memory/HBM segment has the “highest certainty” in AI hardware, prompting funds to move in early. Micron’s 1% gain and SK hynix’s 2% gain today were a preview.
Driver 2: Expectations for Marvell’s “Analyst Day” (custom chips). The direct reason for Marvell’s 4.5% rise is that its October 6 Analyst Day is approaching—the market expects the company to provide growth guidance for AI custom chips (Chiplet/interconnects) and break through the psychological $250 threshold in one move. Marvell has risen 210% year to date and is a core name in the “custom ASIC + data-center interconnect” sector.
Driver 3: New demand-side data (Anthropic×SpaceX).
Pre-market news: The computing-power agreement between Anthropic and SpaceX is worth up to $84.5 billion, nearly double the amount previously disclosed—“AI companies buying computing power” has received another major order, directly supporting valuations across the entire hardware chain.

II. The essence of this rally: entering the “expansion phase”

A comparison makes it clear that the market has entered a new phase:
Stage 1 (July-August): Nvidia rose alone, AI = GPU
​Stage 2 (now): optical communications (Lumentum/Coherent/Ciena), memory (Micron/SK hynix/SanDisk), custom chips (Marvell/Broadcom), equipment (Applied Materials/ASML), Meta (AI applications)—the entire supply chain is rising broadly

The “expansion phase” has two implications:
1. A healthy bull-market signal: Funds are moving from “leaders” to “shovel sellers,” indicating that the AI narrative has shifted from “concept” to “orders being fulfilled across the entire supply chain”—more solid than betting solely on Nvidia
​2. A risk signal: When “catch-up stocks” (glass companies such as Corning) also begin surging, the rally often enters its middle-to-late stages—the current market is starting to feel like “everyone is an AI stock”

III. Three risks to watch closely
Risk 1: There is little room for disappointment with Marvell. “Valuations have left little room for disappointment”—MRVL is up 210% year to date, and if the guidance at the October 6 Analyst Day is lackluster, the pullback will be very fast.
Risk 2: Micron’s earnings are a “known event.” A unanimous bullish view among investment banks means expectations are fully priced in—meeting expectations in tonight’s earnings report would merely be “passing,” while missing expectations would mean a “double hit”; it will determine the near-term direction of the entire memory sector, and even AI hardware.
Risk 3: The macro factors remain. Although the market has lowered expectations for an October rate hike (after the data), elevated U.S. Treasury yields and Friday’s nonfarm payrolls report have not disappeared—AI hardware’s high valuations are most vulnerable to rising interest rates.$MRVL ‌
repost-content-media
AMAT+3.43%
ARM+0.89%
META+0.07%
COHR+10.87%
NVDA+1.16%
  • 7
#美光即将披露四季度财报 Micron earnings preview: Rally sustainability amid HBM4 ramp-up and the supply-demand gap
Micron's FY2026 Q4 earnings report will be released after market close tonight. Market consensus calls for revenue of approximately $50.8 billion to $51.2 billion and adjusted EPS of about $31.5, while the company's own guidance is revenue of around $50 billion, plus or minus $1 billion, and a gross margin of 86%. But more important than the figures themselves is management's latest commentary on the pace of HBM4 shipments and the supply-demand landscape in 2027.
HBM4 is turning from a “stor
DRAM+2.26%
  • 8
#美伊谈判陷入僵持布伦特站上106美元 US-Iran negotiations have once again reached an impasse, while Brent crude has climbed above $106, and this energy shock is being transmitted to inflation through a more complex path than the market expected.
The core sticking point in the deadlock is the Strait of Hormuz. Iran’s proposal to reopen the strait within seven days was rejected by Trump, who bluntly said that Tehran had “overestimated its leverage.” As the conflict enters its eighth month, Brent crude has risen more than 70% this year. With roughly one-fifth of the world’s crude oil and liquefied natural gas dep
BZ+4.73%
NG-1.89%
  • 7
#美国30年期国债收益率2002年以来新高 The US 30-year Treasury yield has reached a new high since 2002 (breaking above 5.6%), essentially representing a “repricing” of the anchor of global asset pricing. This round of the “US Treasury storm” is not driven by a single factor, but is the result of multiple forces—including inflation expectations, fiscal deficits, economic resilience, market supply and demand, and global capital allocation—resonating together, marking the end of the “low-interest-rate era” and the new normal for global capital costs.
I. Core drivers of the surge in US Treasury yields
1. Reboundin
  • 5
#OpenAI年化经常性收入接近700亿美元 OpenAI's Trillion-Dollar Ledger
OpenAI's $1.4 trillion valuation and nearly $70 billion in annual recurring revenue (ARR)
OpenAI is seeking to complete a new funding round of at least $30 billion at a valuation of approximately $1.4 trillion, and postpone its originally planned initial public offering (IPO) until 2027. This “bridge round” is intended to replenish capital reserves for the 2027 IPO and maintain the pace of compute expansion.
The core financial metrics supporting this valuation show that OpenAI's annual recurring revenue (ARR) has approached $70 billion, up
TSLA-0.21%
NVDA+1.16%
  • 8
My One Gate moment: Hold anything. Witness together the biggest evolution in Gate’s 13-year history. The gateway to borderless finance. https://www.gate.com/zh/activities/everything-money-ceremony?ref_type=165&ch=Direct&ref=BFNNXV5X&utm_cmp=BIPdAc5p
post-image
  • 4
#英伟达追加1500亿回购授权 NVIDIA's $150 billion buyback: it's buying PE, not the stock price
Let's do the math first
On September 28, NVIDIA announced an additional $150 billion in buyback authorization, bringing the remaining total to approximately $235 billion, available through the end of fiscal 2028.
What does $150 billion mean?
It exceeds Apple's $110 billion single-year record in 2024.
Second calculation: this amount is less than 3% of its market cap.
Revenue was $96 billion last quarter, doubling year over year, while quarterly free cash flow was approximately $21 billion—the authorization can be
ThisIsTranslateContent:
#英伟达追加1500亿回购授权 Nvidia buyback +$150 billion: it's buying PE, not the stock price
First, let's do the math
On September 28, Nvidia announced an additional $150 billion in buyback authorization, bringing the remaining authorization to approximately $235 billion in total, available through the end of fiscal 2028.
What does $150 billion mean?
It exceeds Apple's single-buyback record of $110 billion in 2024.
Second, this amount accounts for less than 3% of its market cap.
Revenue was $96 billion last quarter, doubling year over year, with quarterly free cash flow of approximately $21 billion—the authorization can be fully spent by early 2028 without strain.
Valuation comparison: current P/E vs. 15-year average
Nvidia forward P/E: 16.5x
15-year average: 30.0x
The third calculation is the most counterintuitive: the buyback was announced precisely when the valuation was cheapest.
The forward P/E of 16.5x is the lowest since January 2015, compared with a 15-year average of 30x.
The implied earnings yield is 6.1%, versus 5.2% for 10-year U.S. Treasuries—the “rent” from stocks has once again surpassed that from government bonds. The stock is up 20% this year, while AMD has doubled and Intel has tripled, with the market moving money from the leader to the challengers.
The fourth calculation looks at behavior: peers cut buybacks in half from July to September, while Nvidia opened its largest-ever authorization during the same period.
Taken together, these four calculations are not about supporting the stock price, but a clearly stated position: management believes the market is pricing in pessimism. Buybacks will not answer how long AI demand can last, but they answer another question—when everyone is skeptical, what price is the company itself willing to pay. #每周来晒 $NVDA ‌
repost-content-media
NVDA+1.16%
AMD+0.63%
INTC-0.16%
  • 4
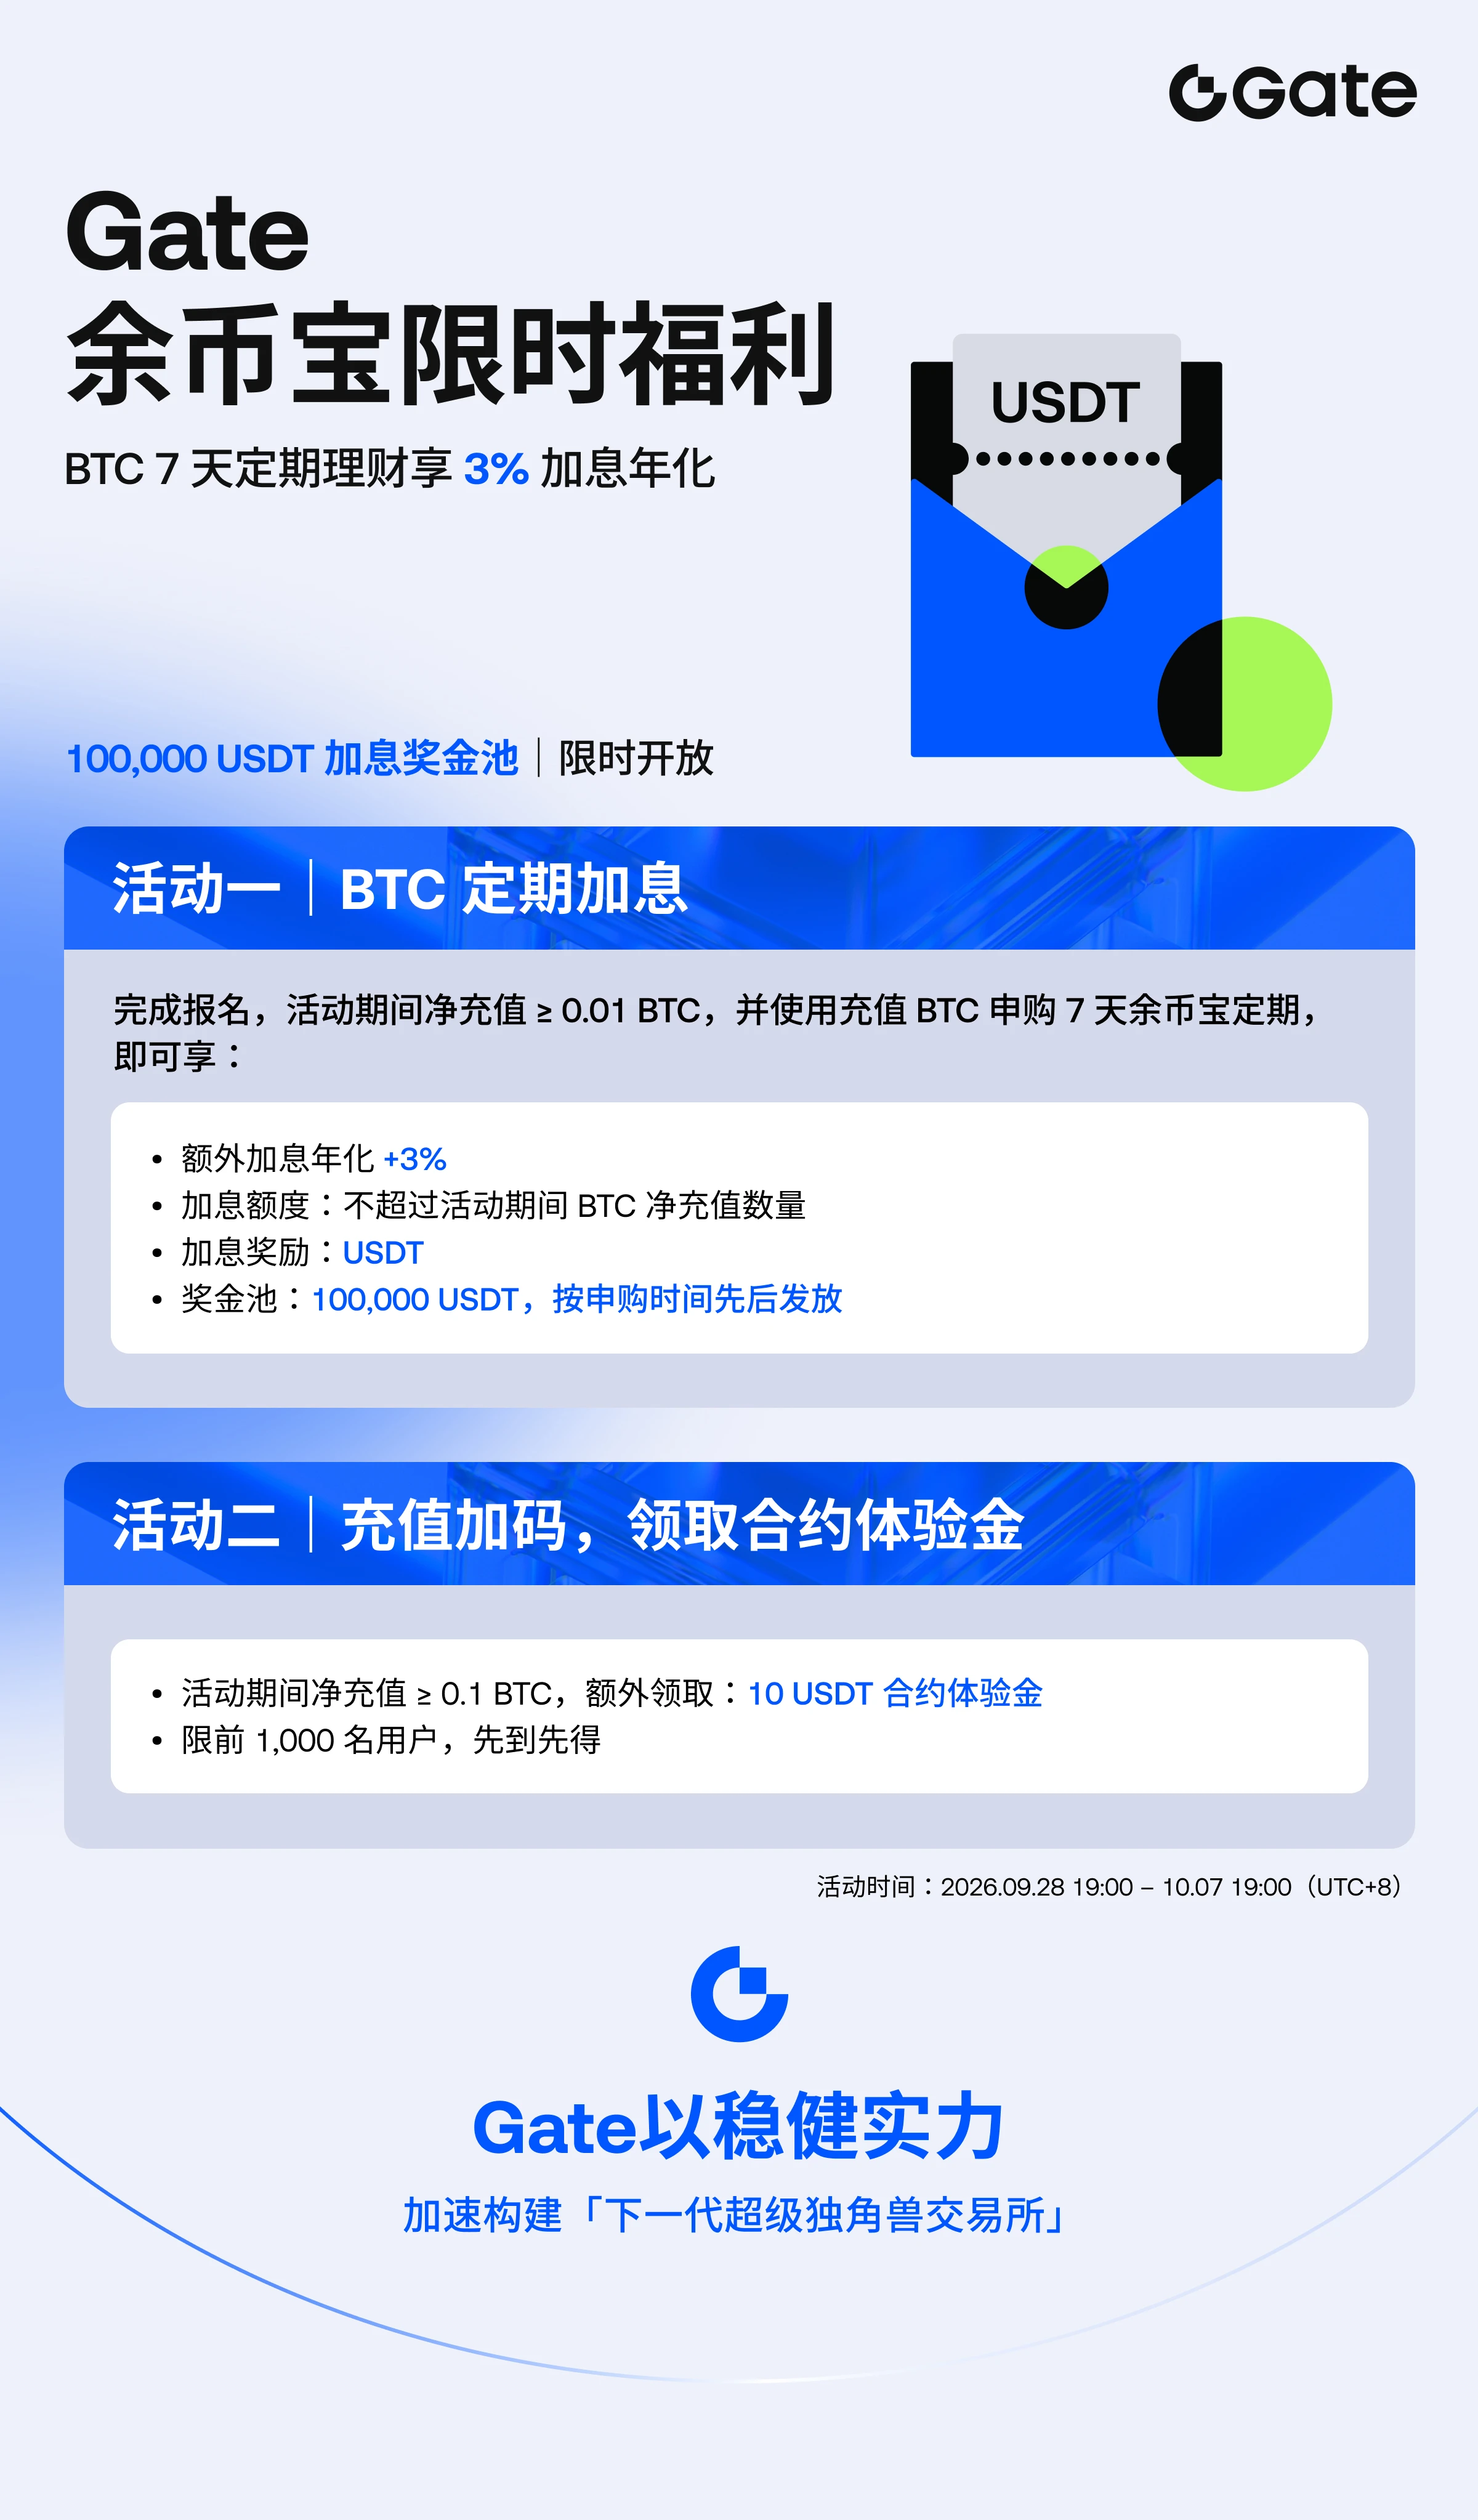
#ETH理财享5%加息年化 ETH stays put, yield moves 💎

During a choppy market, the hardest question isn't whether to buy, but whether to hold, earn yield on, or wait with the ETH you have. Gate's HODL & Earn ETH perks this time add a Buff to “holding without moving”:

Event breakdown:
🎯 Net deposit ≥0.3 ETH + subscribe to a 7-day fixed-term product → enjoy the boosted-rate benefit (5% annualized tier)
🎁 Net deposit ≥3 ETH → an additional 10 USDT futures trial fund (limited to the first 1000 users, first come, first served)

My ETH allocation approach (conservative version)
Keep core holdings un
ThisIsTranslateContent:
#ETH理财享5%加息年化 ETH stays put, returns keep moving 💎

During a choppy market, the hardest question isn't whether to buy, but whether to hold that ETH, put it to work, or wait for the market. Gate's latest ETH benefits on Yu'ebao add a timely boost to simply "holding without moving":

Event breakdown:
🎯 Net deposit ≥0.3 ETH + subscribe to a 7-day fixed-term product → enjoy an interest rate boost (5% annualized tier)
🎁 Net deposit ≥3 ETH → receive an additional 10 USDT futures trial fund (limited to the first 1000 participants, first come, first served)

My ETH allocation approach (conservative version)
Keep the core position untouched and put idle holdings to work: ETH is a long-term allocation, but when there is little short-term market action, put the idle portion into Yu'ebao to earn the 7-day boosted rate—redeem it for trading whenever the market picks up, and still earn returns if it doesn't; you get the best of both worlds
​ The 0.3 ETH threshold is very accessible: even small positions can participate, with no need to use leverage for yield
​ The 3 ETH tier is an "easy bonus": those who already have 3 ETH can get 10 USDT in trial funds to practice with—note that these are trial funds, so don't get carried away and open large leveraged positions

The 7-day fixed-term product has a lock-up period, so don't put all funds earmarked for near-term trading into it; the boosted annualized rate is subject to the event details—read the rules carefully before participating.

How do you usually handle your ETH? Hold it, put it to work, or wait for the market? Share your thoughts in the comments 👇$ETH ‌
repost-content-media
ETH+0.52%
  • 5
  • 1
QNT has undergone an extreme rally over the past week. The price started at around $60 and reached as high as $371, with its weekly gain at one point exceeding 300%, making it the strongest-performing token among the top 100 assets by market capitalization. The catalyst for this surge came on two fronts: on September 24, U.S. payments clearing organization The Clearing House announced that it had selected Quant to provide technical support for its “on-chain money program,” with the network processing approximately $2 trillion in payments and settlements daily; subsequently, seven British banks
QNT-12.70%
  • 4
#ETH站上2700美元 Ethereum Short Positions Surge 13,000%—Is ETH Setting a $3,000 Bear Trap?
Ethereum (ETH) is on track for its best September performance in a decade. Specifically, ETH has risen 7% this month, which would make it the best-performing September since 2016 and only the fourth positive September in the past decade. With just over two days left before the trading month ends, ETH is highly likely to lock in its best monthly performance.
In summary, Ethereum’s short positions currently appear extremely bullish. Over the past two weeks, Ethereum short positions have surged by approximately
ThisIsTranslateContent:
#ETH站上2700美元 Ethereum Short Positions Surge 13000%—Is ETH Setting a $3,000 Bear Market Trap?
Ethereum (ETH) is on track for its best September performance in a decade. Specifically, ETH is up 7% this month, which would make it the best-performing September since 2016 and only the fourth positive September in the past decade. With just over two trading days remaining, ETH is very likely to lock in its best monthly performance.
Against this backdrop, Ethereum’s short positions currently appear extremely bullish. Over the past two weeks, Ethereum’s short positions have surged by approximately 13000%, from just over 771 ETH to more than 101,000 ETH. This represents an extreme accumulation of short positions.
If Ethereum begins to rise, this dense concentration of short positions could quickly evolve into a sharp short squeeze.
To determine whether this squeeze will occur, it is important to understand what has caused this bearish setup.
From a technical perspective, ETH is facing a massive supply wall between $2,722 and $2,822, with more than 13.3 million ETH changing hands within this price range.
In addition, after breaking above $2,800 last week, Ethereum (ETH) is down approximately 1.5% this week, indicating that selling pressure has intensified significantly. In this context, the increase in short positions suggests that traders are betting Ethereum cannot break through this resistance level. But what if Ethereum breaks above $2,800? If bulls step in, the large number of short positions could turn into a perfect bear trap. Shorts may be forced to close their positions, increasing buying pressure and potentially driving Ethereum toward $3,000.
On-chain signals reinforce Ethereum’s bear trap setup!
Ethereum’s post-Hegotá upgrade may be only one piece of the puzzle. In his latest post on X, Vitalik Buterin outlined Ethereum’s transition toward a more general-purpose blockchain architecture, as well as upgrades aimed at making the blockchain more scalable, secure, and private. Given the continued large-scale accumulation of ETH by on-chain whales, such a roadmap could not have come at a better time. According to on-chain analysis data, the amount of Ethereum held by whales has grown 21.4% over the past seven days, reaching 321k ETH as of now. At $2.7 million per Ethereum, its total value is as high as $864 million.
But whale purchases of Ethereum are not the only sign of growing market demand for Ethereum.
Data shows that the amount of staked ETH has reached an all-time high of 43.5 million ETH, accounting for more than 35.6% of the total supply.
In addition, more than 500k ETH flowed into staking pools in just the past week, meaning that ETH is being actively locked up rather than used for trading.
The simultaneous increase in whale accumulation and record staking activity indicates that investors are buying ETH for the long term. Against this backdrop, the momentum following the Hegotá upgrade could become another catalyst for sustaining this trend.
Therefore, the 13000% surge in short positions becomes even more intriguing. While traders are buying short positions, whales are gaining more ETH to stake. If bulls break through the key resistance level, this crowded positioning could lead to a bear trap, forcing shorts to cover and providing momentum for Ethereum to reach $3,000 in October.$ETH
repost-content-media
ETH+1.09%
  • 5