Share your thoughts
placeholder
Article
$NVDA NVIDIA's recent price action has been range-bound at high levels, with an overall strong trend and increased volatility, but on the weekly timeframe, it has not seen a truly one-way, straight-line rally or sharp decline.
Based on the latest price action, NVIDIA shares are trading around $230, close to the 52-week high of $236.54, indicating that the bullish trend remains intact, while resistance above is also clearly evident.
The market remains broadly optimistic about its 12-month price target, but short-term funds are more focused on whether the stock can hold the $228–$230 range and c
NVDA+0.87%
Everyone’s buying gold’s dip—but XAUT’s 4h just armed a trap most won’t see.

$XAUT /USDT - SHORT

Trade Plan:
Entry: 4426.6 – 4429.0
SL: 4437.1
TP1: 4420.8
TP2: 4416.2
TP3: 4409.3

Why this setup?
Why now?
- 1D trend is **range**, not breakout—so chasing longs is gambling.
- RSI 15m at 48.7 shows zero momentum; price is stalling under 4427.8 resistance.
- ATR 4.6 on 1h means volatility is thin—perfect for a quiet grind to TP2 at 4416.
- With 55% confidence, this is a probability play, not a certainty—risk is defined at 4437.

Debate:
If XAUT slips below 4426, do you trust TP2 at 4
XAUT+0.01%
I had just switched the app to the background when it suddenly popped back up—are you playing hide-and-seek with me? I wasn't expecting much from this move, but $ARB really knows how to surprise people.

Luckily, I hadn't canceled the order I placed before bed a few days ago, and it steadily caught the price around 0.10885. At the time, I saw it forming a bottom without breaking down, while funds were quietly flowing in, so I knew this level would most likely deliver an answer. Looking again today, the current price has already shot up to 0.1787, with a +3689.72% return sitting there—it compl
post-image
ARB+34.84%
ETH+1.14%
ADA+3.65%
These returns are making me nervous, as if I’m afraid the market will come to its senses tomorrow and blacklist me.
During the intraday bottoming phase, $UNI /UNI oscillated around 4.828, and many people couldn’t hold on and handed over their chips. I took another look at the order book: each pullback to a key level was higher than the last, and funds quietly entered every time it reached a key level. This didn’t look like a breakdown was coming, but more like the final shakeout before a move up. Once I had thought through the stop-loss level, all that remained was to leave it to time.
The pric
post-image
UNI+14.18%
LAB+0.31%
ZEC+0.15%
BTC MARKET UPDATE
live-cover
LIVE72
$ETH Signal】Long + 1H MACD histogram widening / 4H golden cross
$ETH The 1H MACD histogram widened to 3.81, with the price holding just below the upper Bollinger Band. The 4H golden cross continues, and the previous 4H bullish candle had a volume of 464,000. The 1H RSI is 65.24, and the funding rate is 0.0078%, so longs are not overheated. The order book depth ratio is 0.20, with sell orders placed deeper, creating slippage costs for short-term chasing. The risk-reward ratio is 1.5, the direction is clear, and execution should follow the specified levels.
🎯Direction: Long
⚡Entry/Limit order:
post-image
ETH+1.14%
BTC+0.25%
SOL+1.30%
Everyone’s chasing the 15m RSI bounce—but that’s exactly where ESPORTS traps breakout traders.

$ESPORTS /USDT - SHORT

Trade Plan:
Entry: 0.01492 – 0.01500
SL: 0.01533
TP1: 0.01468
TP2: 0.01450
TP3: 0.01423

Why this setup?
- 1D trend is bearish; 4h bias is SHORT with 95% confidence—not a guess, a weighted edge.
- Price is stalling at 0.01496, right on the 1h reference, while RSI 15m at 68 screams overbought *into* resistance.
- ATR (0.000153) shows tight coils—breakdowns here snap fast, not crawl.
- Why now? The “waiting” status means the setup is armed; invalidation at 0.01530 is a
ESPORTS+0.81%
I originally wanted to cut my losses and sacrifice the meat to the heavens, but the ritual failed—the meat roasted itself. 🔥 While everyone else was running, I took another look at the order book.
At the time, the screen was filled with panic, but the bottom held steady, funds quietly entered, and the volume-price action was not bad. I judged that this was just a fake drop, so I opened a long position around 216.97 without hesitating for too long. The market has now reached 231.06, with a +604.09% return. Nailed it.
The early phase was truly sluggish, but the breakout feels just as rewarding.
post-image
LAB+0.31%
ZEC+0.15%
Everyone’s chasing longs on $SOL /USDT, but the 4h tape is quietly whispering a different name.

$SOL /USDT - SHORT

Trade Plan:
Entry: 103.08 – 103.44
SL: 104.95
TP1: 102.00
TP2: 101.15
TP3: 99.89

Why this setup?
- Price is pinned at 103.26 with a SHORT bias (55% confidence) while the 1D trend is *range*, not breakout.
- RSI on the 15m sits at 47.6—no momentum behind the bid, just dead air.
- ATR (1h) is a tight 0.70, meaning the next move will be violent when it comes.
- Why now? We’re sitting at the exact entry ref with invalidation at 102.46—if that cracks, the path to TP1 (102.0
SOL+1.36%
Pretty happy—I got to eat #晒出我的持仓收益 after sleeping.
post-image
🟢HIGH RR $DOT LONG
🛑 SL: $0.8940
🎯 TP1: $1.0365—70%
🎯 TP2: $1.1—30%
⚖️ R:R: 7.68R
🛡 Hyro risk: 0.6%
✅ Confirmations: 9/10
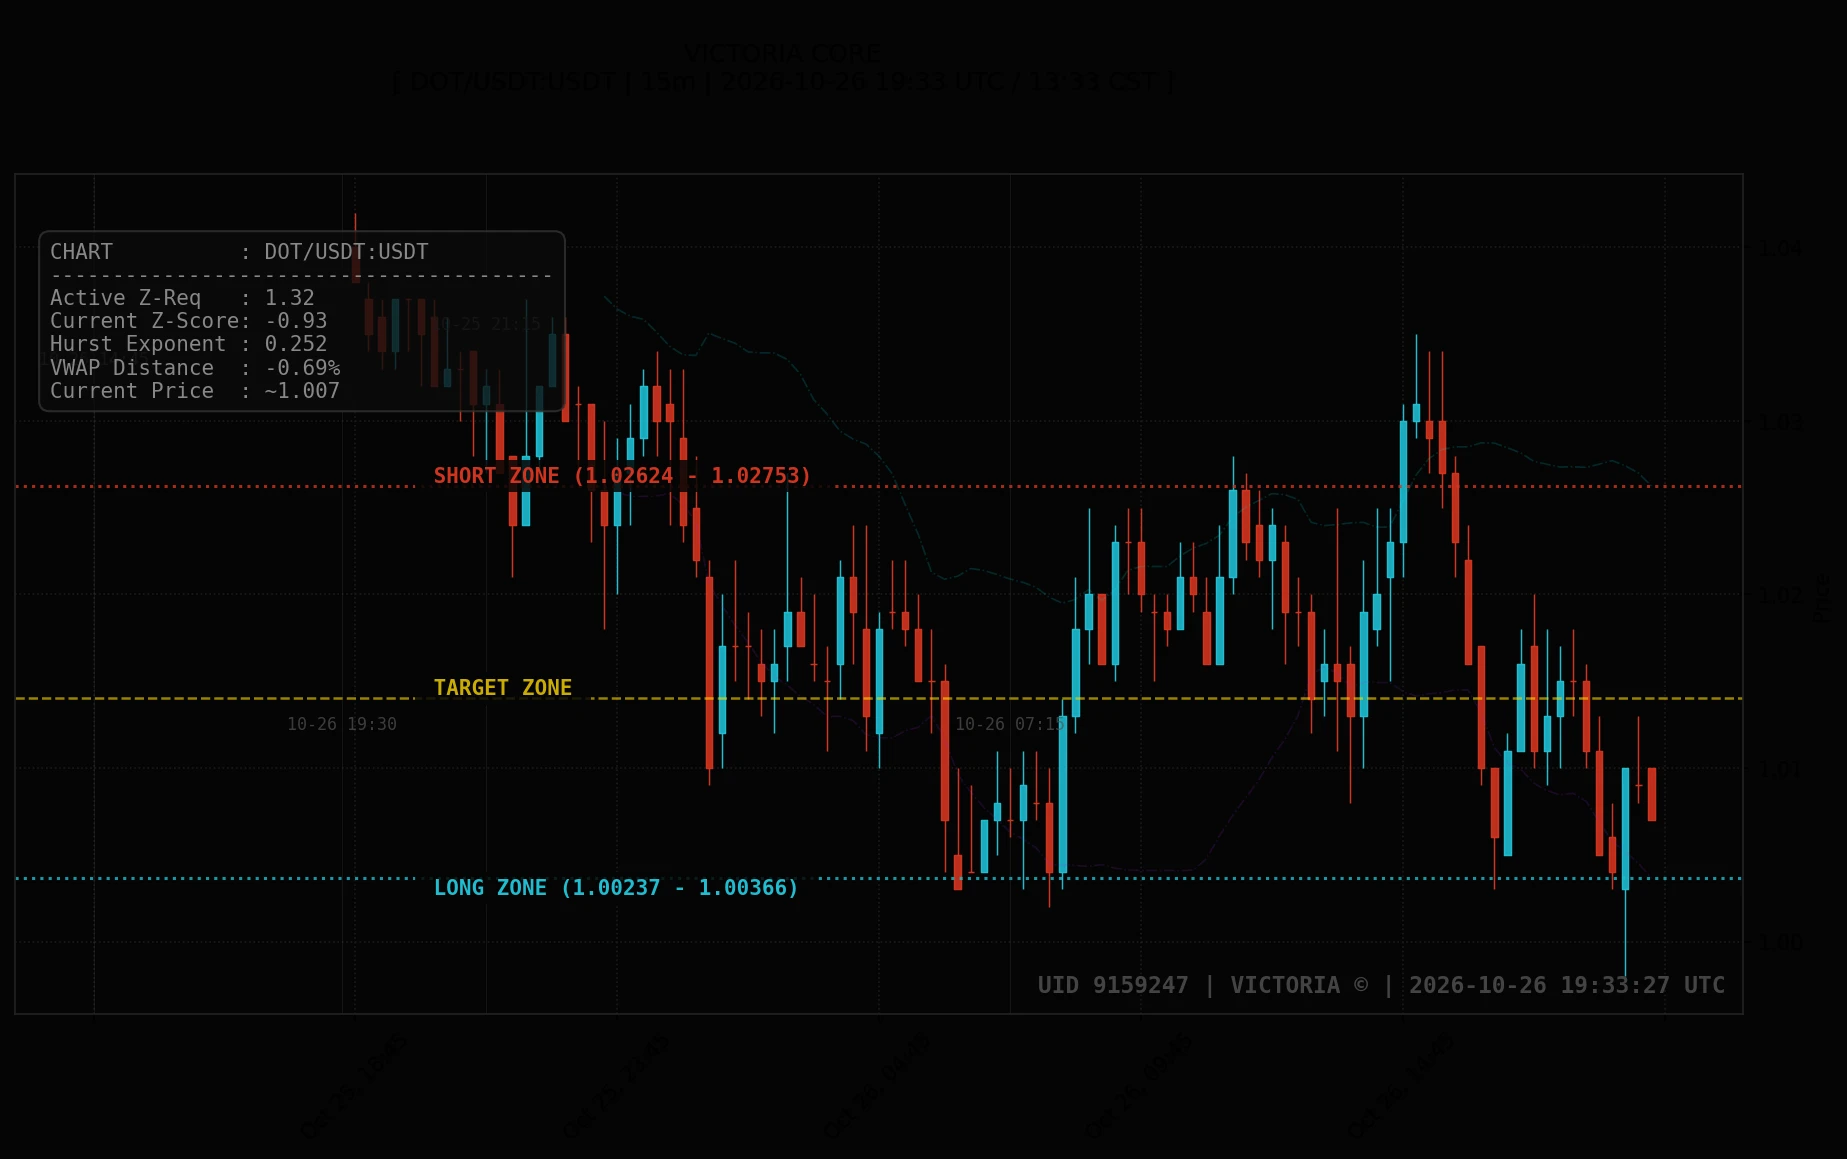
You witnessing now the moment before an epic trade and the power of Direction Target and Timing methodology for reading price action. I sized up.
Not financial advice
— DTT
post-image
DOT+2.47%
Financial News, Crypto Updates, Real-World Strategies
live-cover
LIVE68
Everyone’s staring at $MU /USDT’s 1016 level, but the 4H chart just whispered a secret that most retail missed.

$MU /USDT - SHORT

Trade Plan:
Entry: 1015.32 – 1017.02
SL: 1026.82
TP1: 1008.18
TP2: 1002.86
TP3: 994.87

Why this setup?
- 4H bias is SHORT with 77.4 confidence—not a coin flip.
- 1D trend is *range*, meaning we’re not chasing momentum; we’re fading the top of the box.
- RSI (15m) at 54.66 shows weak bounce fuel, not a reversal engine.
- ATR (1H) is 3.41—tight, so price is coiling. The 1015-1017 zone is the spring.
- Why now? Entry ref 1016.17 sits right under the range
MU+0.11%
Everyone’s staring at HYPE’s 4h breakout, but the 15m RSI whispered something they missed.

$HYPE /USDT - LONG

Trade Plan:
Entry: 85.065 – 85.369
SL: 83.755
TP1: 86.314
TP2: 87.045
TP3: 88.142

Why this setup?
Why now? The 1D trend is bullish, yet the 15m RSI (43.91) shows a coiled spring—not exhaustion. With ATR at 0.609 on 1h, volatility is priming for a squeeze. Entry zone 85.065–85.369 is the last cheap ticket before TP1 at 86.314. Confidence at 95 means the market is begging for a long, but only if you respect the 83.755 invalidation.

Debate:
Is this dip to 85.2 the gift, or are we
HYPE+1.19%
Everyone’s staring at HYPE’s 85.5—but the real trap is waiting at 87.3.

$HYPE /USDT - LONG

Trade Plan:
Entry: 85.356 – 85.660
SL: 84.053
TP1: 86.600
TP2: 87.327
TP3: 88.419

Why this setup?
Why now? The 4h structure is armed LONG with 95% confidence, and the 1D trend is bullish—this isn’t a coin flip.
- Entry zone: 85.35–85.66 (tight, disciplined).
- RSI 15m at 56.5 shows room to run, not exhaustion.
- TP1 at 86.6 is the appetizer; TP2 at 87.3 is where the crowd gets greedy.
- Invalidation sits far below at 82.2—so the risk/reward is mathematically on your side.

Debate:
Do you f
HYPE+1.19%
Can HYPE still be chased after breaking above $88? What’s really worth watching now isn’t the price
HYPE broke above $88 to hit a new all-time high, and the market has started asking the familiar question again: “Can it keep rising?”
My view is that instead of guessing the top, it’s better to observe the market structure after the breakout.
A truly healthy strong market usually won’t rely on a single large bullish candle. After breaking through the previous all-time high, if the price can consolidate at elevated levels to absorb profit-taking and then gradually form higher lows, that indicates
HYPE+1.20%
  • 39
I did nothing—just went to the restroom, and when I came back, the candlestick chart had already done the work for me.🚽

Right after seeing the bearish news, I was watching the order book for $PROM . Each rebound was lower than the last, and volume was also shrinking—a clear sign that funds were pulling out while pushing the price up. I didn’t overthink it and entered a short at 7.149. After setting my stop-loss, I went to do my own thing instead of falling in love with the market.

When I came back, the price had already dropped to 5.094, securing +1384.31%. This trade was indeed hassle-fr
post-image
PROM-0.84%
ZEC+0.15%
BNB+6.37%
Everyone’s staring at Bitcoin, but ADA just flashed a quiet short signal that most will ignore until it’s too late.

$ADA /USDT - SHORT

Trade Plan:
Entry: 0.2196 – 0.2208
SL: 0.2258
TP1: 0.2160
TP2: 0.2131
TP3: 0.2089

Why this setup?
Why now? The 4h frame is rejecting 0.2202 with a 55% short bias, while the 1D stays range-bound—meaning no bullish escape. RSI on the 15m is cooling at 59, and ATR (0.00235) shows volatility is compressing for a squeeze. Targets are stacked: TP1 at 0.2160, TP2 at 0.2131, TP3 at 0.2089. Stop at 0.2258 is tight. This isn’t a gamble; it’s a measured fade against
post-image
ADA+3.65%
Everyone’s chasing gold’s new high—but the 4h tape just whispered a different secret about XAUT.

$XAUT /USDT - SHORT

Trade Plan:
Entry: 4426.2 – 4428.6
SL: 4436.7
TP1: 4420.4
TP2: 4415.8
TP3: 4408.9

Why this setup?
- RSI on 15m sits at 46.24, losing upside momentum while price stalls at 4427.4.
- 1D trend is **range**, not breakout—so 4436.7 (SL) is the real battle line, not the moon.
- ATR 4.63 on 1h means moves are tight; TP2 at 4415.8 is only 0.26% away, but that’s the trap zone if bulls defend.
- Why now? Status is “Armed” with invalidation at 4455.6—if we lose 4426.2, shorts h
XAUT+0.01%
A few days ago, $ARB broke out on heavy volume and held above the moving averages. I reminded myself not to hesitate and added to my long position with the trend. But the wicks early in the breakout were genuinely frightening, and my unrealized profit briefly shrank by more than half.
After the price strengthened again, I closed 70% of the position first and placed a trailing stop on the remaining 30%. Some people prefer to exit all at once, but taking profits in batches suits me better. Even if the price continues to surge on momentum later, I still have a position to participate with and won
post-image
ARB+34.84%
ZEC+0.15%
BNB+6.37%
Load More

Join 40 M users in our growing community

⚡️ Join 40 M users in the crypto craze discussion

💬 Engage with your favorite top creators

👍 See what interests you

View More