Square
Following
Hot
News
Profile
Share your thoughts
placeholder
Article
ETC faced clear resistance at 8.095 and has broken below the MA7 and MA25 support lines on the 15-minute chart. RSI(6) is 37.48, confirming weakening momentum. The short-term trend has turned downward, and it is expected to test the 7.850 support zone. Short now $ET !🐻
Entry range: 7.994 - 8.034Take-profit target 1: 7.624Take-profit target 2: 7.312Stop-loss: 8.275Trade here 👇👇👇Market overview: $SIRE : Current price 0.03494 - 24-hour change: +55.77%
$SKHYNIX : Current price 966.4 - 24-hour change: +2.09%
post-image
SKHYNIX+2.80%
They sleep while you build wealth
post-image
🌅🚀 GATE.IO ⚡ HOT TRADER LIVE | BTCS NEXT BREAKOUT? ₿📈 | MORNING MARKET WATCH 🔥🐂🐻
live-cover
LIVE1,652
#USSeptemberCPITopsEstimates 5 Numbers That Tell the Real Story
The headline from Wednesday's inflation report was simple: prices rose faster than expected. But the numbers underneath are what really matter. Here are the five I kept coming back to.
1. 3.7%: the headline
Consumer prices rose 0.6% in September from the month before, taking the annual inflation rate to 3.7%, up from 3.4% in August and above economists' expectations of 3.6%. It's the second straight month of acceleration, and the pace is moving further from the Fed's 2% goal.
2. 9.1%: gasoline
Fuel did most of the heavy lifting. M
GAS-0.42%
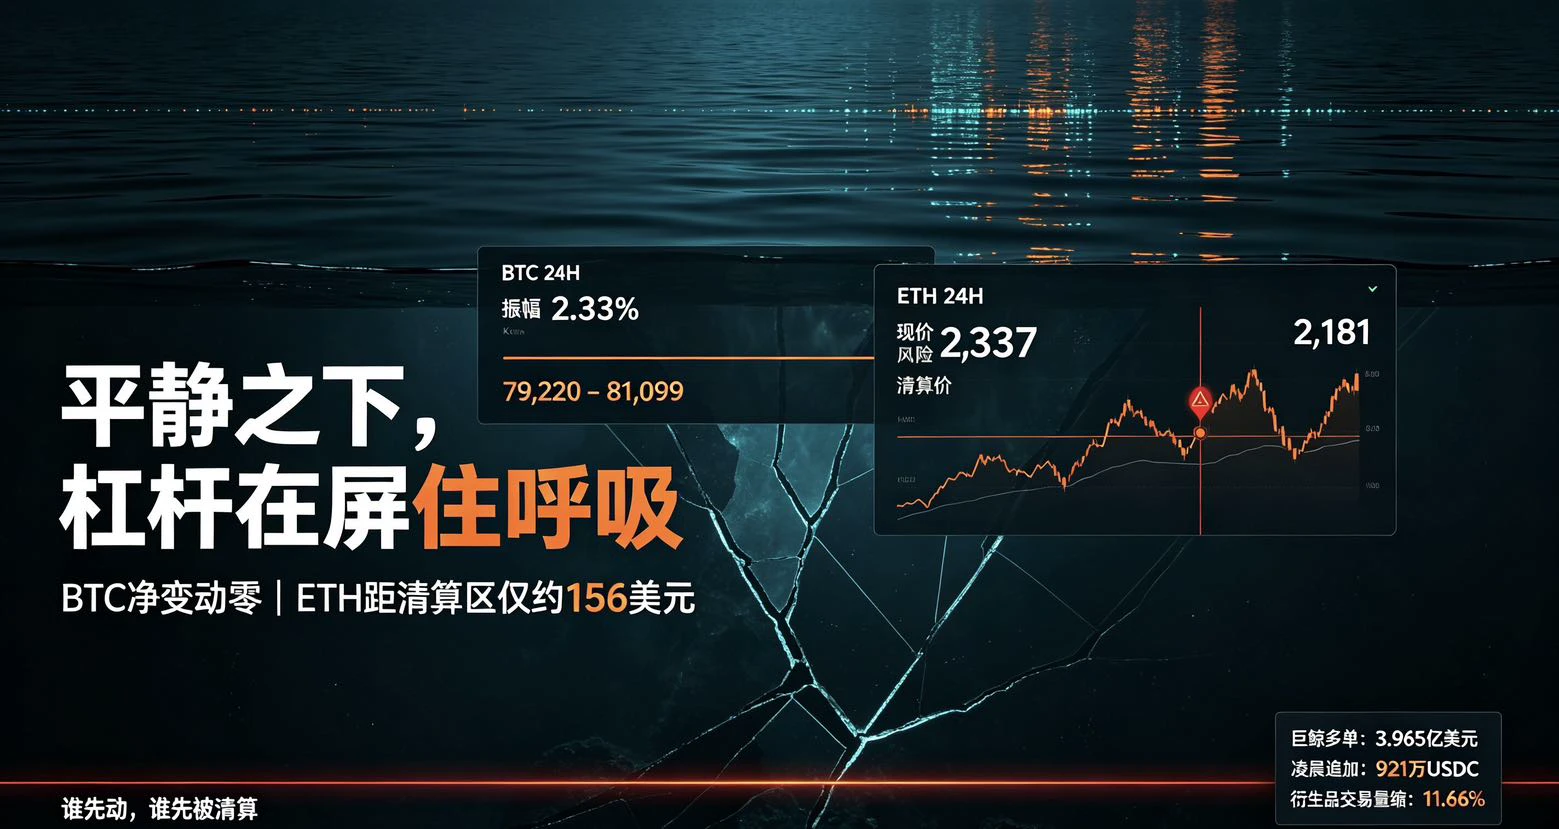
10.16 Bitcoin price action analysis
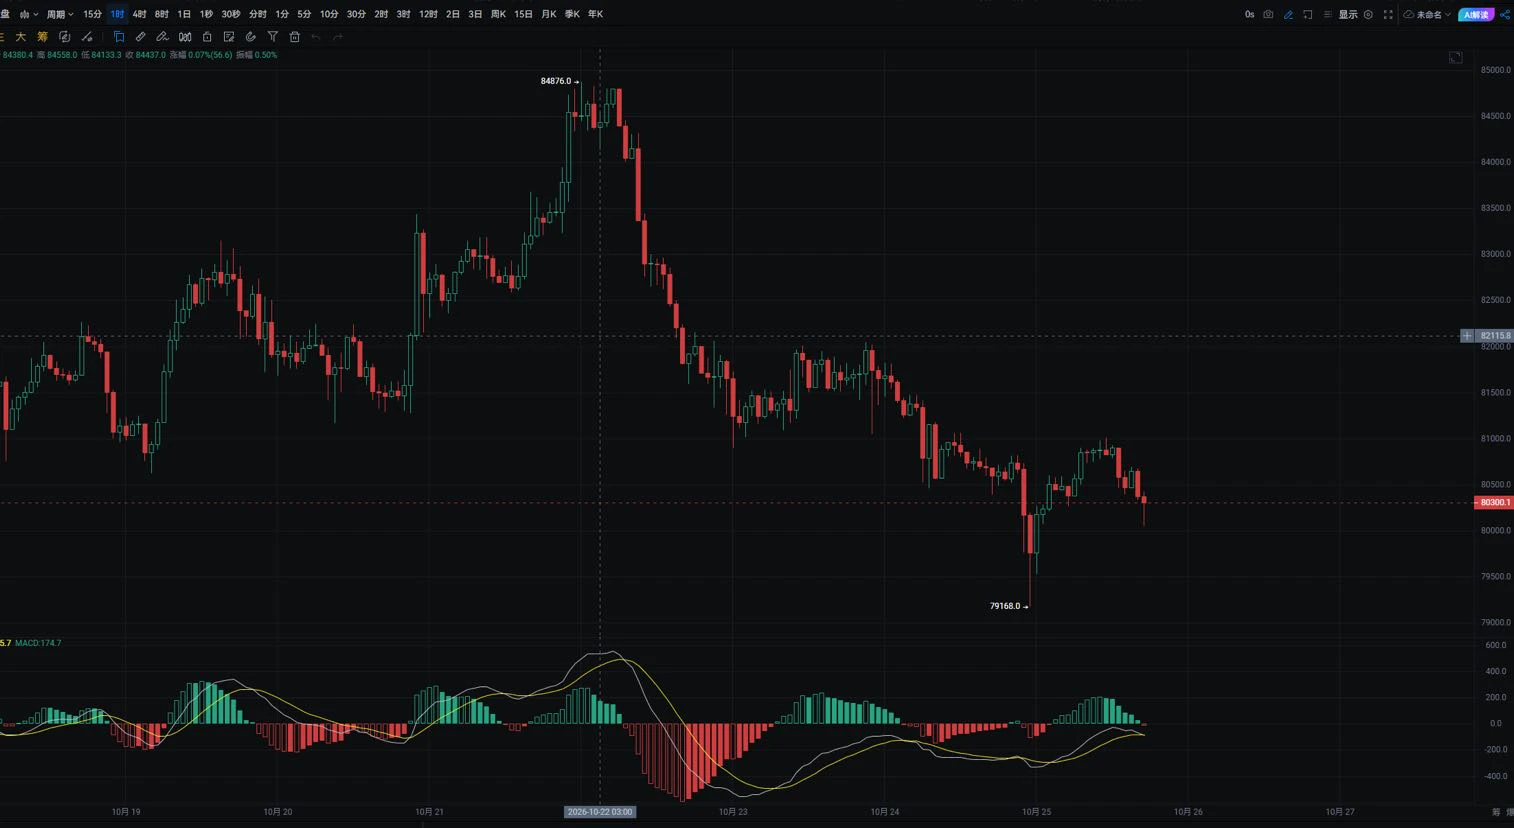
The market opened a strong rebound from the low of 79732.3, with the rally reaching a high of 82639.2 before losing momentum. The price then entered a range-bound consolidation phase. The Bollinger Bands gradually flattened, with the upper and lower bands narrowing as the market repeatedly oscillated within the channel. In terms of indicators, long and short forces have tended toward equilibrium, with no clear one-sided direction. This is a high-level range-bound consolidation pattern following a sharp rally. 82639 is the key resistance level, while support
post-image
BTC+1.15%
#USSeptemberPPIBeatsExpectations 🇺🇸 US September PPI Beats Expectations: Inflation Concerns Return to Global Markets
The United States has released its September 2026 Producer Price Index (PPI) report, delivering a stronger-than-expected reading and bringing inflation back into focus for investors, economists, and cryptocurrency traders. The latest data suggests that price pressures across the US economy remain elevated, creating fresh uncertainty around the Federal Reserve’s future monetary policy decisions.
According to the US Bureau of Labor Statistics, the Producer Price Index for final
post-image
BTC+1.10%
ETH+2.43%
GAS-0.42%
#USSeptemberPPIBeatsExpectations CPI and PPI Both Run Hot: Is the Market Entering a New Inflation Shock?
The inflation debate has taken another serious turn. After stronger-than-expected U.S. CPI data, September’s Producer Price Index (PPI) has added further pressure to an already sensitive macroeconomic environment. With producer inflation reportedly rising to 6.3% year-over-year and 1.3% month-over-month, investors are being forced to reconsider one of the most important questions in financial markets: Is inflation becoming more persistent than expected, and what does that mean for risk asse
post-image
  • 1
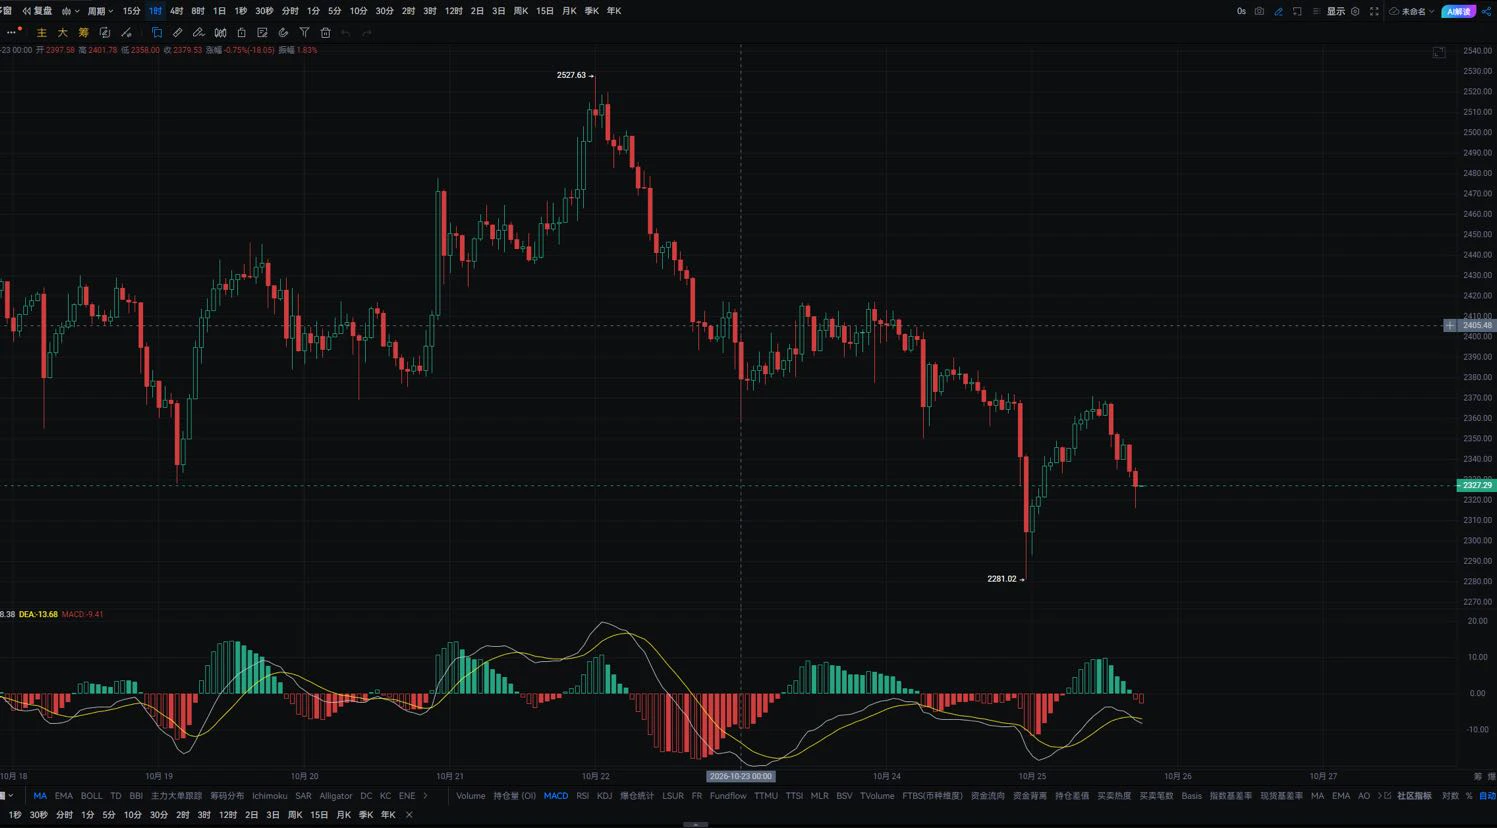
Friday morning BTC/ETH strategy by Zhong Ling on 10.16
The MACD has formed a golden cross below the zero axis, releasing some short-term rebound momentum. However, the indicator as a whole remains below the zero axis, and the broader bearish structure has not reversed. The current rise is essentially a technical oversold recovery following the release of CPI data.
Trading plan
BTC: Short around 82300-82800, target: around 80K
ETH: Short around 2450-2470, target: around 2330
$BTC $ETH #GateWCTCS9全球交易赛 #Solana大升级定档 #美国9月PPI大超预期 #Ledger被植入间谍芯片
BTC+1.15%
ETH+3.13%
10.16 BTC Public Strategy
$BTC Short Strategy
  Entry range: Light short near 828–832 on a pullback
  Stop-loss defense: Around 838 (a wick above is highly likely; set according to position size, and execute planB⬇️ after a breakout)
Take-profit levels
  First take-profit: Around 820 (high-volume trading area)
  Second take-profit: Around 812
Third take-profit: Around 802 (support at the lower Bollinger Band)
Long-term target: Below 795 (long-term target; monitor if the third target is broken)

Rationale: The rebound began after the market bottomed at 79732. The cur
BTC+1.15%
$BTC Earlier today, I mentioned that late shorts were at risk of getting squeezed.
This is exactly what we’ve seen now, resulting in price pushing up roughly 3.5% from the lows.
However, that does not mean that longs are safe yet.
BTC still needs to reclaim $84.4k first in order to break bearish structure and shift momentum back in favor of buyers.
Until there is a confirmed break back above that level, another retest of the lows remains possible.
That said, with all the unswept lows taken out and the majority of the remaining liquidity now resting above price, I would still slightly favor a f
post-image
BTC+1.10%
Why did every cryptocurrency crash at exactly the same time?
This isn’t natural selling; it’s pure manipulation.
$BTC ‌
post-image
BTC+1.15%
$BTC is rising, but I think the exact opposite is true. September’s PPI rose 1.3% month over month, versus expectations of just 0.6%, marking the second-largest increase in 15 years and pushing the annual rate up to 6.3%. Inflation at the wholesale level hasn’t been brought under control, so expectations for rate cuts will have to be pushed back. Grid trading thrives on this kind of volatility, scalping back and forth within the range. Weekend trading volume is only 30% of weekday levels, so even a slight increase in volume can push the market up. Let’s wait until the weekend to see the outco
post-image
BTC+1.10%
Got up early and studied English for an hour
Feels so difficult☹️
Especially listening and speaking
post-image
$SNDK Hey, I stared at this chart for a while, and now I want to share a few heartfelt words with you guys.
Looking at the market, you can't just see that it's up 2.21% and start celebrating. Let's dig into the chart and see what clues we can find.
First, the market's overall “climate” is off.
Look at the scrolling news in the chart: “Trader Loracle's Nasdaq short position has turned profitable.” What's the implication? The broader environment is falling! The shorts on U.S. tech stocks are popping champagne and counting their money. As a stock token, no matter how strong SNDKG is, can it withs
post-image
SNDK-0.56%
  • 2
  • 1
live market update
live-cover
LIVE2,111
Tesla can fly—it really can fly
Go buy another Tesla to support Mr. Ma
@Tesla @elonmusk
post-image
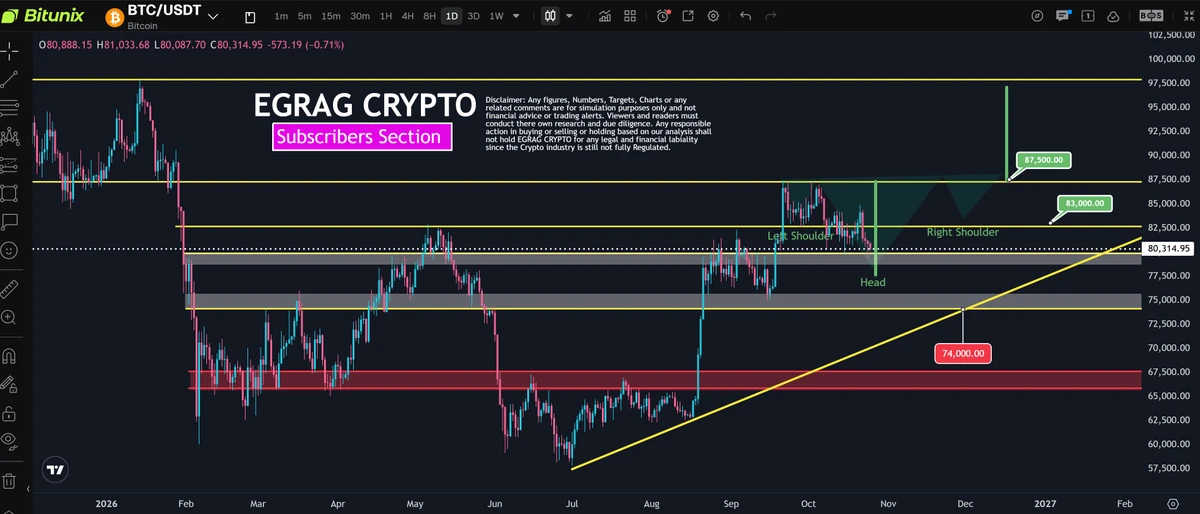
#BTCBreaksBelow82K
🚨 BTC Breaks Below $82K — What’s Next?
Bitcoin has slipped under the key $82,000 level multiple times this week, putting the short-term structure under pressure.
Quick Snapshot
Recent range: $79,700 – $84,200
Current zone: hovering around $82,000 – $82,200
Major tests: dipped toward $80K on the back of hot inflation data
Why the Sell-Off?
Hotter-than-expected September CPI + strong PPI reignited rate-hike concerns
Rising Treasury yields & stronger USD
Spot BTC ETF outflows
Risk-off spillover from Asian markets
Heavy long liquidations
Key Levels to Watch
📌 $82,000 – $82,50
BTC+1.10%
  • 4
Going with the trend is the right move: long at 4163, exit at 4170, capturing a $7 range and $674!
$ETH $XAU #黄金 #Solana大升级定档
post-image
ETH+3.13%
XAU+0.44%
I’ve turned off the $WAL gainers-and-losers list for now, and that leaves just one issue on the chart: $WAL moved first on the 1-hour chart, but the 4-hour chart still hasn’t acknowledged it.
$WAL is currently at 0.05138, down 10.66% over 24 hours. The 1-hour support is 0.05023, resistance is 0.066, and current volume is 0.06 times the average volume of the past 20 candles.
My view for now is this: I’ll treat the short timeframe as a reminder, not take it as a conclusion outright; if the larger timeframe doesn’t follow, the direction can still reverse. Moving up doesn’t count as a win just be
post-image
WAL-24.37%
Load More

Join 40 M users in our growing community

⚡️ Join 40 M users in the crypto craze discussion

💬 Engage with your favorite top creators

👍 See what interests you

Trending Topics

USSeptemberPPIBeatsExpectations

91.35k Views1.9k Discussing

US September PPI came in at 6.3% YoY, well above the 5.3% market expectation, pointing to renewed producer-side inflation pressure. Weekly jobless claims were 199K, broadly in line with forecasts. Could hotter inflation further reduce room for rate cuts, and what does it mean for $BTC, US stocks, and gold?

GateWCTCS9GlobalTradingCompetition

37.87k Views6.4k Discussing

WarshIMFSpeech

62.4k Views744 Discussing

View More