Share your thoughts
placeholder
Article
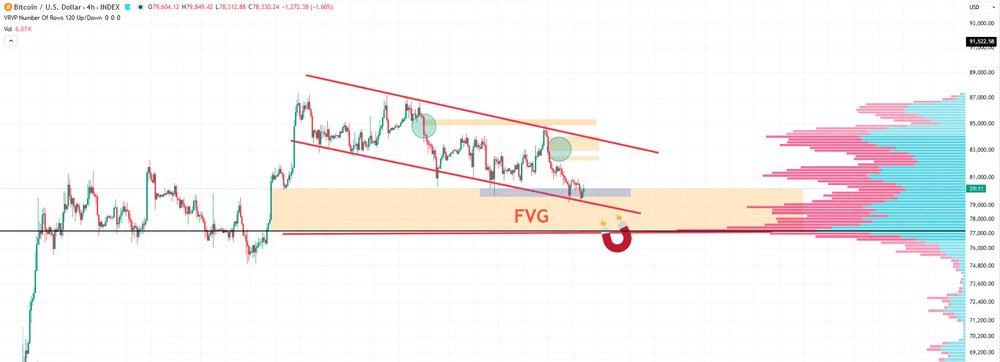
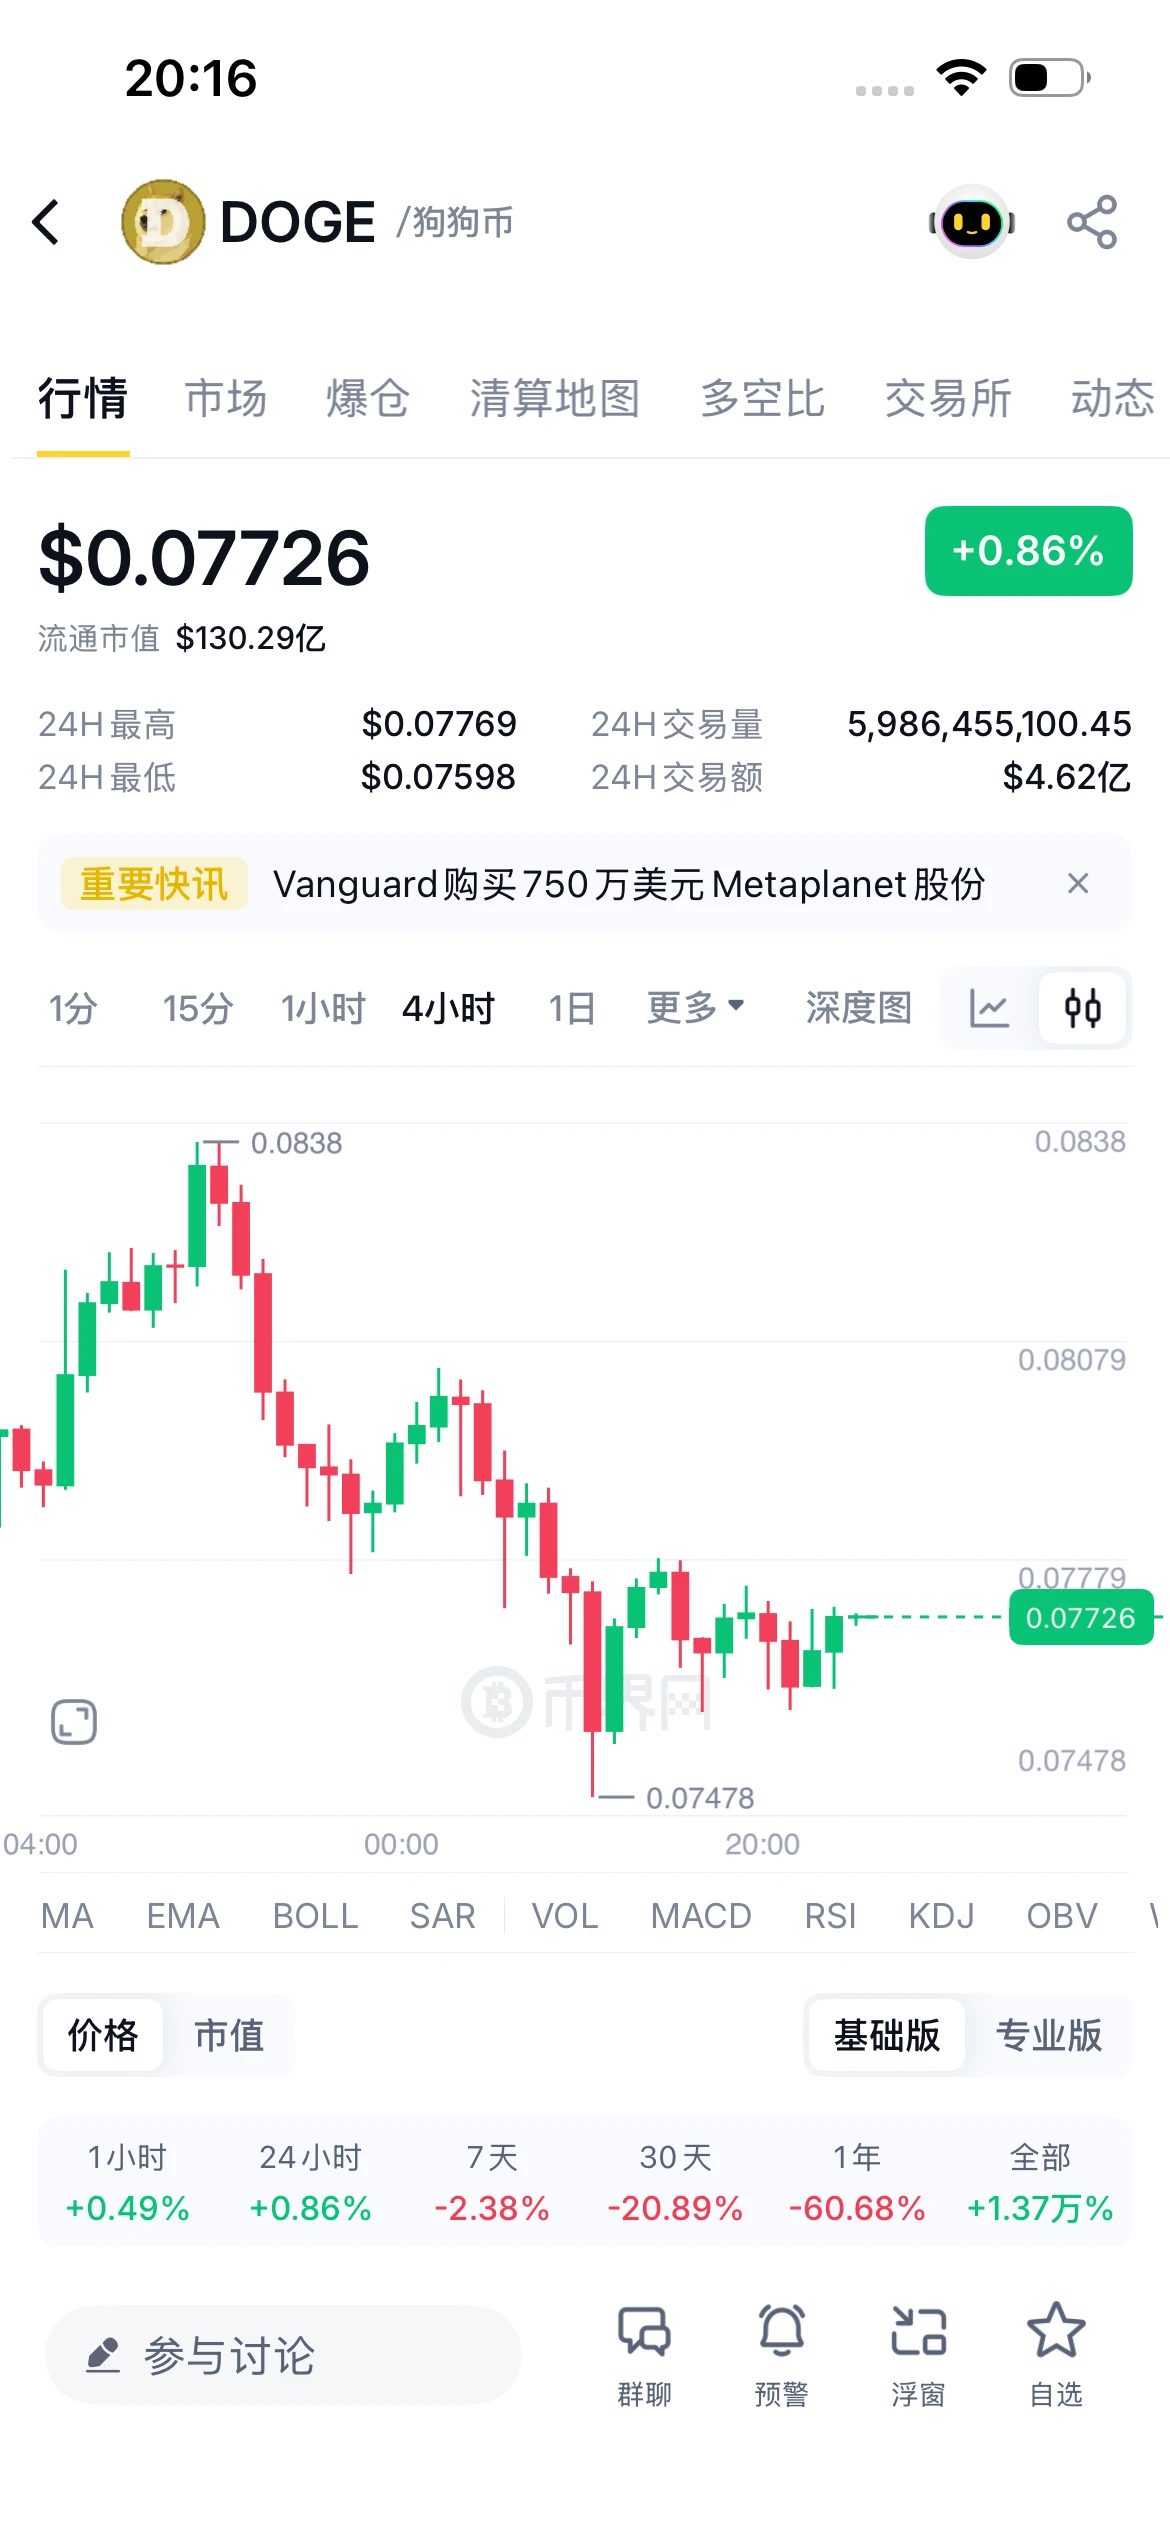
The silence after the revelry: the price is still at the same level, but the positions are definitely not what they were before—some doubled their accounts in one trade, while others were wiped out in a single trade! There’s not much to see in the weekend market, so get some good rest. If you want to run short-term trades, just buy low and sell high between 778 and 765; making a little profit shouldn’t be a problem.
post-image
  • 1
#每周来晒 GT Market Analysis (September 12, 2026)
GT is currently priced at approximately **$9.23**. After recovering from the $6-$8 range, it is now in a critical post-breakout consolidation phase. On September 5, it briefly reached a high of $9.57-$9.62 before pulling back and consolidating around $9.10-$9.20.
📊 Technical Analysis: Short-Term Bullish, but Overbought Pressure Needs to Be Digested
GT has moved above MA5 ($8.33), MA10 ($8.15), and MA30 ($8.05), with the moving averages in a **bullish alignment**, confirming that short-term momentum favors buyers. The long-term resistance zone at $
GT+2.18%
I wasn't watching the chart or thinking about it; it went down on its own, as if working overtime for me. A few days ago before bed, $AIOT the rebound was weak and resistance above was obvious. I saw that every push upward fell just short, so I casually placed a short at 0.04561.

Volume failed to follow; no one was buying on the way up, and it reeked of a bull trap. With a structure like this, not shorting it would have been a disservice to the chart.

Don't lose patience in a range, only to try to win back your dignity in a one-way move. Don't let profits inflate, and don't despair over d
post-image
AIOT+0.58%
XRP+1.08%
ETH+2.77%
Yang Guang bit | September 12 $SOL CPI surged sharply back to 102, with the 100 level fluctuating ahead of FOMC
【Today’s Plan】
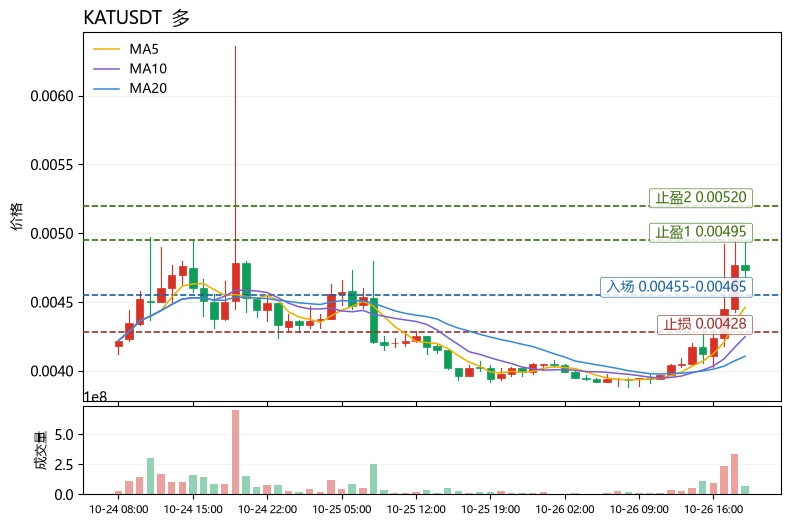
Entry timing: Position for shorts on a rebound into the 103.3—104.0 range
Stop-loss: Above 104.8
Staggered take-profit:
First target: 101.3—101.8
Second target: 100.0—100.5
Key conclusion
Geopolitically, the US-Iran conflict is trending toward becoming protracted; however, SOL, as the high-beta altcoin leader, has virtually no safe-haven appeal. Geopolitical conflict suppressing risk appetite constitutes an indirect bearish factor, and its high beta means that once the
post-image
SOL+3.29%
NEAR is about to expose the biggest trap in crypto right now

$NEAR /USDT - LONG

Trade Plan:
Entry: 2.3970 – 2.4340
SL: 2.2380
TP1: 2.5487
TP2: 2.6374
TP3: 2.7706

Why this setup?
Why now? The daily trend is firmly bullish, setting the stage for a decisive move higher. The 1h ATR of 0.073973 shows this pair is in an active volatility phase, meaning the next leg is likely explosive. The 15m RSI at 29.73 signals deep oversold conditions that often precede sharp reversals. With the entry zone anchored at 2.4155 and targets at 2.5487 and 2.6374, the setup offers a high-reward profile for patie
NEAR-4.65%
Pi Desktop 0.6.3 just made nodes look less like validators and more like home servers.
SoloHost = one-click self-hosted apps on your machine. Data stays local. Apps are not exposed to the public internet.
New: real-time usage rankings, My Apps, readiness checks, better Docker tools, and AI agent documentation.
Included: Hermes, OpenClaw, Atlassian MCP Server.
The question is shifting from “What does a Pi node validate?” to “What can the computer running the node do for you?”
That is a much larger product.
#PiNetwork $PI
PI-0.97%
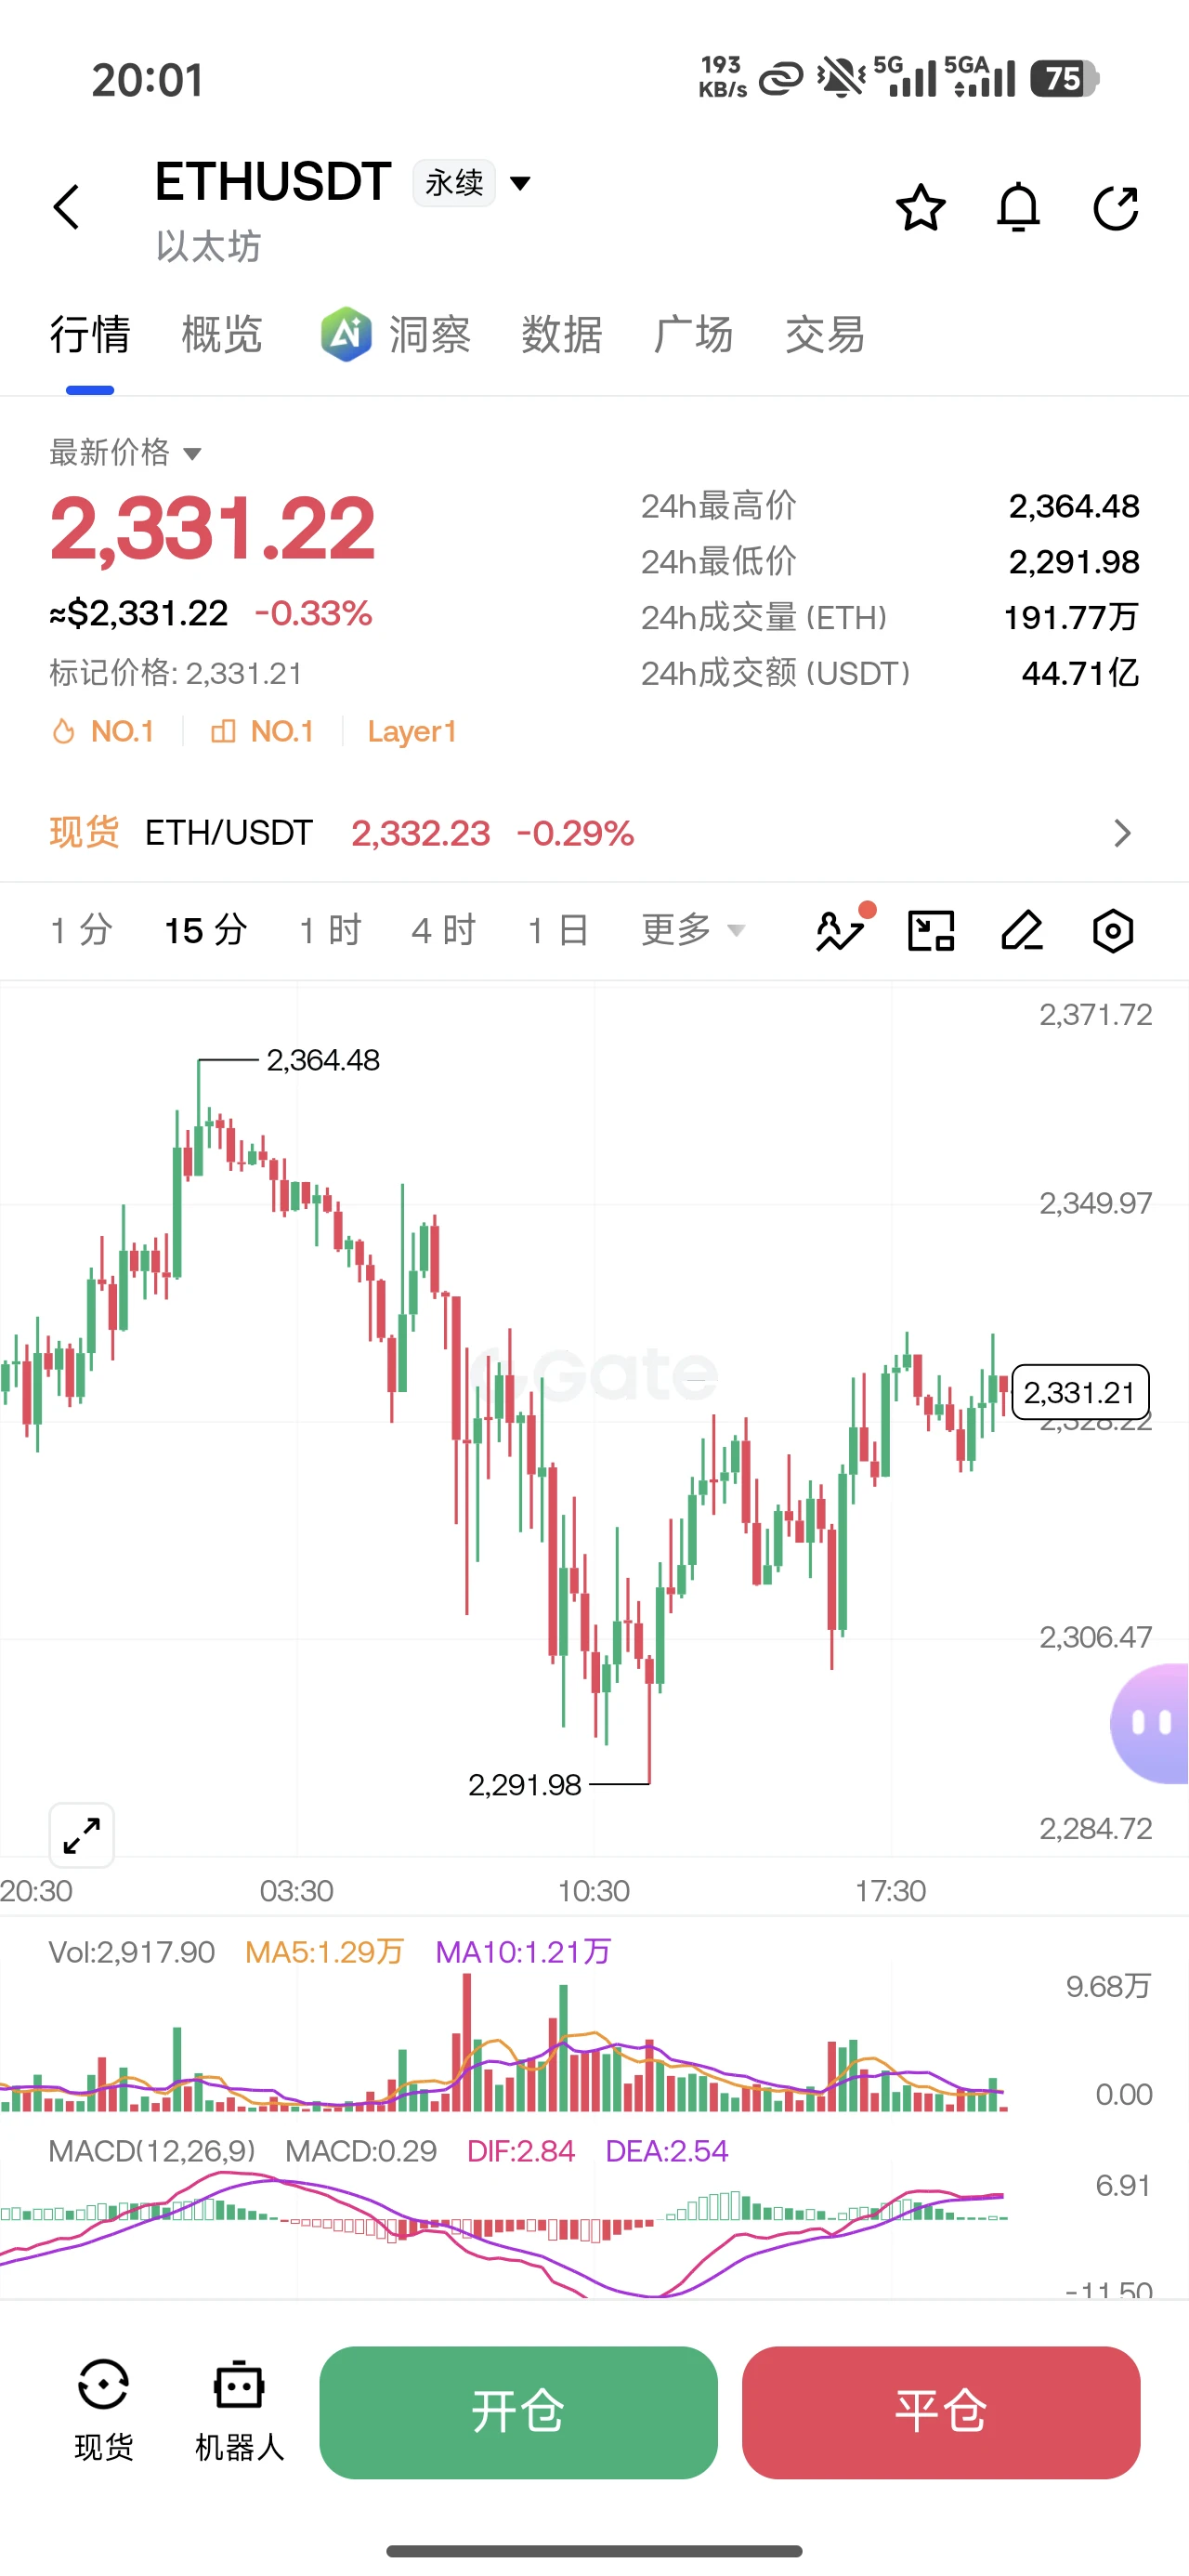
It’s been called for nearly a month, yet it still hasn’t reached 2200.
post-image
JsBigShark
$2,200 is coming!
This spike
Wiped out the short whales completely.
repost-content-media
The most comfortable rhythm for shorting is stagnation followed by a breakdown. A few days ago, $BTC rebounded to near its previous high without any increase in volume, instead repeatedly closing with small candlesticks; funds that chased longs at the highs were tied up, while selling pressure clearly overwhelmed buying support.
I opened a short around the key level, with the stop-loss above the previous high. Since there is still room for a pullback below, as long as the breakdown takes shape, the short has enough room to run; if a small rebound occurs midway, I’ll hold as long as it does not
post-image
BTC+0.62%
ADA+0.19%
XRP+1.08%
$BEAT Signal】Go long + 1H momentum continuation, upper-band breakout
$BEAT 1H RSI 67.73, with the price at 0.0932 pressing toward the Bollinger upper band at 0.0948; short-term momentum has not faded.
🎯 Direction: Long
⚡ Entry/limit order: 0.093060 - 0.093200
🛑 Stop-loss: 0.092268
🚀 Target 1: 0.094598
🚀 Target 2: 0.095297
🛡️Trade management:
- Execution strategy: Take 50% off at Target 1 and move the stop-loss up to breakeven. If the price falls back to the entry level, exit automatically to protect the principal.
In-depth logic: 1H MACD 0.0023, signal line 0.0002, histogram 0.0021, wi
post-image
BEAT+21.01%
BTC+0.62%
ETH+2.76%
SOL+3.29%
#PiNetwork The mainnet dashboard is loading… but the blockchain is telling a different story.
Recent on-chain activity shows:
💸 123.68 → 112.80 → 128.30 $PI payments
👤 New account funded with 0.98 $Pi🔄 Claimable balances are being claimed
🐋 1,263 Pi transferred to a sub-address
The metrics are not yet fully visible.
But transactions are still continuing. ⛓️🥧
With only a few days left until Protocol 27, one question is becoming increasingly difficult to ignore:
What exactly is happening beneath the surface of the Pi Mainnet?👀🔥
Routine activity… or is the network quietly preparing for its
post-image
PI-0.97%
CRYPTO THINGS YOU MAY HAVE MISSED — LAST 24 HOURS | 11 SEPTEMBER 2026
Ripple launched a new institutional product—but the real market mover was inflation pushing Fed-hike odds to 86%.
🧵👇
1/3 — RIPPLE EXPANDS INTO AI TREASURY
Ripple Treasury introduced governed AI agents that can analyse cash, liquidity and risk, cite the company policy behind each recommendation, and route actions through human approval.
This expands Ripple’s institutional-finance footprint following its GTreasury acquisition—but it does not automatically create demand for $XRP. Ripple Treasury
2/3 — CPI PUT THE FED BACK IN
post-image
Why is everyone suddenly watching SYMBOL at 11.475?

$LINK /USDT - LONG

Trade Plan:
Entry: 11.433 – 11.517
SL: 11.073
TP1: 11.776
TP2: 11.977
TP3: 12.279

Why this setup?
Why now? The daily trend is bullish and the 1h price is sitting at 11.475, which also lines up with our entry reference. The 15m RSI is at 39.34, meaning the short-term pullback is deep enough to attract buyers without being oversold. The 1h ATR is 0.167437, so a clean move from the 11.433 entry low to the first target of 11.776 is a realistic one ATR expansion. The second target sits at 11.977, and the entire trade gets
LINK+0.31%
[New Streamer] Market Prediction
live-cover
LIVE55
The hawks are here, and so are the opportunities.
What deserves the most attention in this CPI report is not the 3.4% figure, but that inflation appears not to be falling as quickly as the market had imagined. August CPI rose 0.4% month-over-month and 3.4% year-over-year, while core CPI rose 0.3% month-over-month and 2.4% year-over-year. The rebound in energy prices was an important driver of headline CPI, but some service prices were also relatively strong. #每周来晒 and #AugustCPIDataReleased
This means it will not be easy for the Federal Reserve to shift smoothly toward easing in the short ter
BTC+0.62%
  • 13
The profits from this $CHIP short were mainly captured during the second phase. I did not chase the first drop, waiting instead for the price to rebound and confirm that the key level was holding before taking action. This was much more稳 than rushing to catch the first wave.

The rapid pullback after the breakdown can easily hurt those who chase shorts. I only confirmed that the conditions for a second short were ripe after the price returned below the key-level zone and showed signs of stalling, so the entry cost was still reasonable.

After entering, the price first rebounded slightly, the
post-image
CHIP+0.81%
ZEC+6.95%
BNB+2.12%
The rate-hike cycle is about to begin.
BTC and eth holding steady now is likely due to expectations of clear legislation.
BTC rose yesterday but failed to hold its gains; going forward, the strategy is still to short on rallies.
post-image
BTC+0.62%
ETH+2.76%
#AugustCPIDataIsOut
August CPI: One Inflation Report Could Set the Market’s Next Direction
The U.S. August CPI report is one of the macro events I am watching most closely because inflation data can quickly change expectations for the Federal Reserve, Treasury yields, the U.S. dollar, Nasdaq and, eventually, BTC and the broader crypto market.
The report is scheduled for September 11 at 8:30 AM ET.
Current expectations are around:
📌 Headline CPI: 0.4% MoM / 3.4% YoY
📌 Core CPI: 0.2% MoM / 2.4% YoY
July previously showed a 0.1% monthly increase and 3.4% annual inflation, while core inflation
Before you buy something look at the fees and price impact
robinhood:0x385f4f8ae47651ce5f58f5265395a669f8281e18 for example the price impact is 18.8% ! Youre not going to make much unless big whales go in or you go in with size otherwise you will bleed out
Today's Financial News and Crypto Updates
live-cover
LIVE80
I just switched the app to the background, and it shot right back up—are you playing hide-and-seek with me? I only went to grab a bite, and $LITE LITE suddenly surged, completing its launch right under my nose.

I already felt something was off when it was bottoming out intraday. It could barely fall, and after moving sideways for so long, volume was still shrinking. This wasn’t weakness—it was gearing up for a big move. Money was quietly flowing in, and I had just one thought at the time: don’t wait, get in first.

It was truly sluggish at first, but the breakout feels great. From 857.84 to
post-image
LITE-0.37%
SNDK-2.60%
LAB+62.65%
Load More

Join 40 M users in our growing community

⚡️ Join 40 M users in the crypto craze discussion

💬 Engage with your favorite top creators

👍 See what interests you

View More