
Share your thoughts
placeholder
Article
Market Alert

$PEPE /USDT - SHORT

Trade Plan:
Entry: 0 – 0
SL: 0
TP1: 0
TP2: 0
TP3: 0

Why this setup?
Technical setup found.

Debate:
Thoughts?

⚠️ Personal market analysis only. NFA — manage risk and DYOR.
Educational content, not investment advice or a recommendation to buy, sell, deposit, or withdraw any asset. No paid promotion or referral/affiliate links.
PEPE+5.71%
$XLM Conclusion first: bearish in the short term; reduce positions on rebounds and do not chase longs. Current volatility is in the mid-to-low range, but the structure is weakening, making the risk-reward ratio unfavorable for longs.
Rationale: MA5=0.1958 has fallen below MA20=0.19649, with the moving averages in a bearish alignment; the MACD histogram=-0.0005962 remains negative, indicating that momentum has not recovered; RSI=50.6 is neutral to weak, lacking momentum support for an upside breakout. The Bollinger Bands [0.191256, 0.201724] have limited width, and the price is trading near but
post-image
XLM-2.17%
Insiders are quietly setting up a massive short on $ONE /USDT right now.

$ONE /USDT - SHORT

Trade Plan:
Entry: 0.003551 – 0.003781
SL: 0.004772
TP1: 0.002836
TP2: 0.002283
TP3: 0.001453

Why this setup?
Why now? The 4h trend is range-bound, but the 1h ATR of 0.000461 shows enough volatility to fuel a sharp move lower from the entry zone near 0.003666. With the 15m RSI at 46.56, momentum is already leaning bearish without being oversold, which means room to run toward TP1 at 0.002836 and deeper toward TP2 at 0.002283. The daily range structure keeps the path clear to these targets, but the
ONE+83.69%
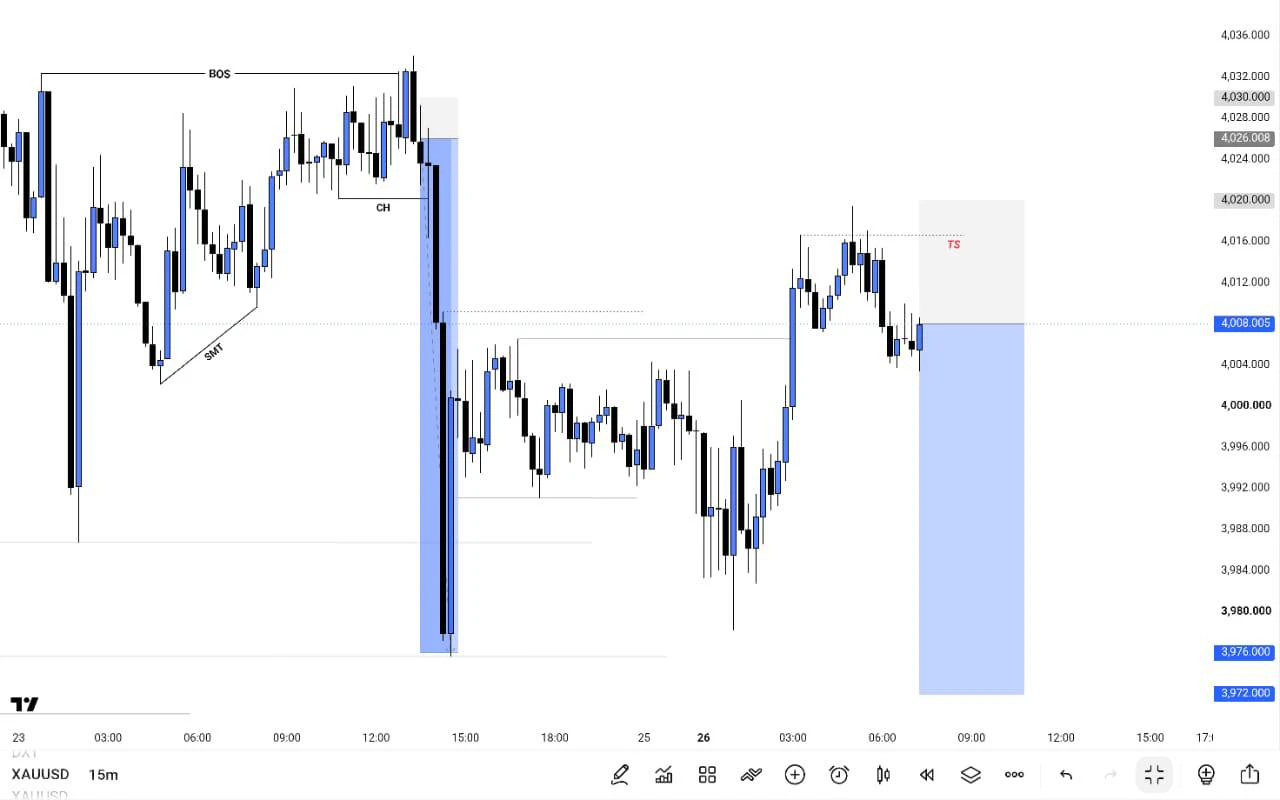
If you're wondering why the last few months have been quite slow on indices with lower trade frequency,
Look at the higher timeframe here
We have been chopping for majority June/July/August/September with few trending days between.
Conditions for smooth continuations just havent been there.
Does it mean its impossible to make money in these conditions?
Absolutely not.
There is still plenty of opportunities.
You'll need to be much more nimble and tame expectations. Just want to put everything into perspective for those who are new 🫡
post-image
9/20 ETH‖Prince Strategy‖
After surging to 2669 earlier, the price quickly retreated under pressure. The Bollinger Bands are opening downward, and the price is moving along the lower band. Multiple rebounds have met resistance, but the bullish structure has not been broken.
Key levels
Resistance: 2635-2650
Support: 2612-2600
If support at 2612 holds, a small short-term rebound recovery will occur, with the price testing resistance near 2625;
If support at 2612 is directly broken, the bearish move will continue, with the price probing further toward the 2600 level.
Without further ado, today's
post-image
ETH-1.51%
【Mid-Autumn】🔹 OpenAI CEO to brief the UN Security Council on AI
live-cover
LIVE1,868
9.20 BTC Market Analysis

Long: around 80500-81000, stop loss 80000, targets 81800/82300

BTC is currently at 81063.7.

On the 15-minute timeframe, the low stabilized after a pullback, and the short-term moving averages gradually flattened after converging. The market maintains a bullish structure.

On the one-hour timeframe, BTC has continued rallying from the lows, with all short-term moving averages pointing upward. It is currently consolidating at high levels. The 80500-81000 range represents strong support, while the previous high at 81800 is the first immediate resistance.
The previo
post-image
BTC-0.97%
$JTO – Buyers are starting to regain control again 🚀
Bullish on $JTO Entry: 0.49 – 0.50 Stop-loss: 0.45 Take-profit: 0.55 - 0.60 - 0.65 After weakening recently, JTO is now showing a healthier reaction, with demand gradually returning around the current range. The structure is beginning to become more solid, and stronger buying pressure could turn this consolidation base into a meaningful upward move. Disclaimer: "This is only my personal opinion and does not constitute investment advice, nor is it directed at Vietnamese people."
post-image
JTO+6.90%
9.20 ETH trade setup
  Entry range: Around 2640 for a short position (Bollinger middle band and previous support/resistance level)
  Stop-loss defense: 2670 (exit immediately if the breakout-and-retest-of-the-previous-high setup is invalidated)
  First target: 2610 (reduce position by 50% near the previous low)
  Second target: 2580 (the next level after breaking below the round-number 2600 mark; exit the entire position)
  ETH is in a pullback consolidation phase after a sharp rise on the 30-minute timeframe. After rising unilaterally from around 2380 to a high of 2669, it came under pressure
post-image
ETH-1.51%
Today's ETH morning outlook
Operation:
Go long around 2590-2570
First target: 2610-2630
Second target: 2650-2690
Set a stop loss
ETH has repeatedly moved lower to touch the lower Bollinger Band, while the Relative Strength Index has entered the oversold zone. Short-term bearish momentum has been somewhat released, creating a need for a rebound. In my view, it is not advisable to blindly chase shorts at this time, but the broader trend remains weak, so longs can only be viewed as a bet on an oversold rebound. Do not bottom-fish directly; wait for a clear stabilization signal before cautiously t
post-image
ETH-1.51%
Market Alert

$AR /USDT - LONG

Trade Plan:
Entry: 4.257 – 4.367
SL: 3.779
TP1: 4.711
TP2: 4.978
TP3: 5.377

Why this setup?
Technical setup found.

Debate:
Thoughts?

⚠️ Personal market analysis only. NFA — manage risk and DYOR.
Educational content, not investment advice or a recommendation to buy, sell, deposit, or withdraw any asset. No paid promotion or referral/affiliate links.
post-image
AR+5.35%
$33 million in unrealized losses, yet he keeps adding to his position—the “doomsday bet” by ZEC’s largest short seller. ZEC broke through $1,584, setting a new all-time high. Behind this market rally lies an extreme countertrend battle between major players.
The market’s top ZEC short holder is suffering massive unrealized losses, yet has chosen to keep adding to the position and holding against the trend. The whale holds approximately 38,000 ZEC short, with a total position value of nearly 59 million and an average entry price of 665.8. As the price continues to rise, unrealized losses have k
post-image
ZEC-5.22%
ETH-1.50%
#GateSquareMidAutumnReunion #SNDK #‌$SNDK
SNDK Market Analysis — Strong Momentum, But Volatility Is Rising
SNDK has delivered an impressive recovery and the current structure remains technically strong. Using your reference price of $1,782, the stock is holding well above its major moving averages, while recent momentum has accelerated sharply. On September 18, SNDK gained around 11%, showing powerful buying interest and renewed strength across the semiconductor/storage sector.
Market data also shows unusually high activity, with roughly 17.8M shares traded in the latest session.
The bigger
SNDK+11.05%
  • 1
9.20 Long BTC around 80500, defense at 80000, targets 81800/82500
BTC surged to 81933 on the 1H chart before consolidating at higher levels; current price is 80874.
Short-term moving averages are in a bullish alignment. The 80,000 level has shifted from resistance to support, so buying on a pullback confirmation is safer than chasing the rally.
On the news front, the Federal Reserve raised rates by 25 basis points for the first time, with another hike possible this year. Prolonged high interest rates are suppressing valuations.
However, the SEC’s innovation exemption has opened the doo
post-image
BTC-0.97%
Watching the market until I got annoyed, I actually saw things more clearly after turning it off. Once my eyes stopped staring at it, my heart stopped feeling anxious too. A few days ago in the afternoon, $FOLKS consolidated sideways at the bottom for a long time, then held firm after a pullback. The feeling of funds quietly entering was obvious, so I suggested gradually taking long positions.
During the repeated intraday fluctuations, many people were shaken out, but I chose to hold a little longer. Entered at 1.975, now at 2.072, with an unrealized gain of +236.69%. Nailed the rhythm—feels
post-image
FOLKS-2.79%
SNDK-0.92%
SOL-4.30%
With market action, the more impatient you are, the more it grinds you down—until you give up, then it finally moves.
When I checked the charts after lunch, $ONE was bottoming without breaking down. The key level held, so I said longs could be tried with proper risk management—don’t go all-in and force it. From 0.000713 to 0.00374, +8365.4% secured. Feels really good; time for a nice meal.
The market is the cure for all forms of defiance, especially for those who think they’re the smartest. Don’t let profits inflate your ego, and don’t despair over drawdowns.
Take 80% off the table first, and
post-image
ONE+83.69%
ADA-4.23%
SOL-4.30%
The knock-off season has arrived, with the TOTAL3 index surging over 22 in 30 days, indicating a con
live-cover
LIVE1,803
$BTC 🔴 BTC Short Trade Signal
Entry: 80,600–80,750⚡ Leverage: 100x maximum🎯 TP1: 79,800🎯 TP2: 79,250🎯 TP3: 78,500🛑 SL: 81,350$BTCVietnamPlansFirstCryptoLicensesIn2026Bias: Bearish below 81,000–81,200. The 4H chart shows rejection near 81,951, with short-term downside momentum strengthening. Please manage risk carefully with high leverage.
post-image
BTC-0.97%
Load More

Join 40 M users in our growing community

⚡️ Join 40 M users in the crypto craze discussion

💬 Engage with your favorite top creators

👍 See what interests you

Trending Topics

MSTRTopsNasdaq100

72.4k Views2.6k Discussing

Strategy (MSTR) has gained about 48% over the past month, making it the best-performing stock in the Nasdaq 100, while Bitcoin rose roughly 12% over the same period. The company holds 845,050 BTC with a cumulative cost basis of about $63.73B. MSTR is not a pure Bitcoin proxy — its price swings can be more extreme. Can this rally last?

BTCRetakes80K

56.14k Views59.79k Discussing

GarrettJinHolds320MInZEC

37.24k Views1.4k Discussing

View More