Square
Following
Hot
News
Profile
Share your thoughts
placeholder
Article
JUST IN: MSCI to remove Michael Saylor's Strategy $MSTR from its indexes.
MSCI+2.49%
MSTR+5.58%
Intraday, Ethereum pulled back toward around 2480, hitting a low of 2322 before recovering and rebounding, but the broader bearish trend remains unchanged. The rebound is only a brief bounce during the decline, with clear overhead selling pressure.
From the current chart, the main bearish structure on the daily timeframe remains intact. This rebound is merely a brief recovery after the rapid dip, while MACD remains bearish.
On the 4-hour timeframe, the price has risen close to the upper Bollinger Band, while bullish momentum is gradually fading and the rebound is weakening. On the 1-hour timef
post-image
ETH+1.29%
🔴 Strategy (MSTR) could be excluded from major MSCI indices (such as the MSCI USA, MSCI World, or MSCI ACWI) starting in late November 2026.
MSCI is one of the largest index providers in the world. Thousands of billions of dollars are invested in funds that automatically track these indices. If a stock is removed, these funds are required to sell it.
This is not yet certain: MSCI has introduced “buffers” to limit abrupt changes. A company already in the index, such as Strategy, will only be removed if it fails to meet the new criteria for two consecutive years. The final list of affected secu
post-image
MSTR+5.58%
MSCI+2.49%
On October 16 $ETH , the ETH strategy is actually very similar to the BTC view; both are headed in the same direction, as discussed during the livestream.
Currently, 2545 is the resistance level. After the decline from the October 7 starting point, there was a natural rebound high when the price fell to 2545. This high, 2586, is tentatively set as an anchor point. From the price action, 2545 was broken and reclaimed twice. The second time, the price did not touch the area above 2545, so we will enter short in the area of selling pressure here, taking shorts in the 2500–2530 range.
The hard sto
post-image
ETH+1.29%
  • 1
Everyone watching SYMBOL long is about to get blindsided by a sharp drop.

$MU /USDT - SHORT

Trade Plan:
Entry: 927.98 – 934.84
SL: 964.38
TP1: 906.68
TP2: 890.19
TP3: 865.47

Why this setup?


Debate:
Are we testing TP2 or is 994.50 about to flip this setup?

⚠️ Personal market analysis only. NFA — manage risk and DYOR.
Educational content, not investment advice or a recommendation to buy, sell, deposit, or withdraw any asset. No paid promotion or referral/affiliate links.
MU+2.12%
Who is truly leading the gains in the same sector? The answer points to $INJ
.
A horizontal comparison makes it clear: $INJ rose 10.92% over 24h, with a trading volume of 24.0M USDT, while $JTO fell 3.94% and $DOGE barely moved (-0.28%) over the same period. All three have an MA5 crossing above MA20, but only $INJ ’s RSI surged to 71.2, with the MACD histogram expanding significantly to +0.136. Its price of 8.379 is already approaching the Bollinger upper band at 8.618, and its 30-candle amplitude of 17.89% shows far greater volatility elasticity than the other two. The funding rate of +0.0
post-image
INJ+10.96%
JTO-3.42%
DOGE-0.46%
SOL oscillated downward from the earlier high of 124.99, with the intraday low dipping to 100.51 before a slight rebound, reaching a high of 106.49. This rebound is merely a minor corrective bounce during the decline; the overall broader downtrend channel remains intact, and a rebound to resistance presents an opportunity to enter short.

From the chart, the daily highs have been gradually moving lower, and the bearish trend structure remains intact. This rebound is only a brief pause amid the decline. MACD remains weak and trending downward, while heavy pressure from previously trapped posit
post-image
SOL+1.14%
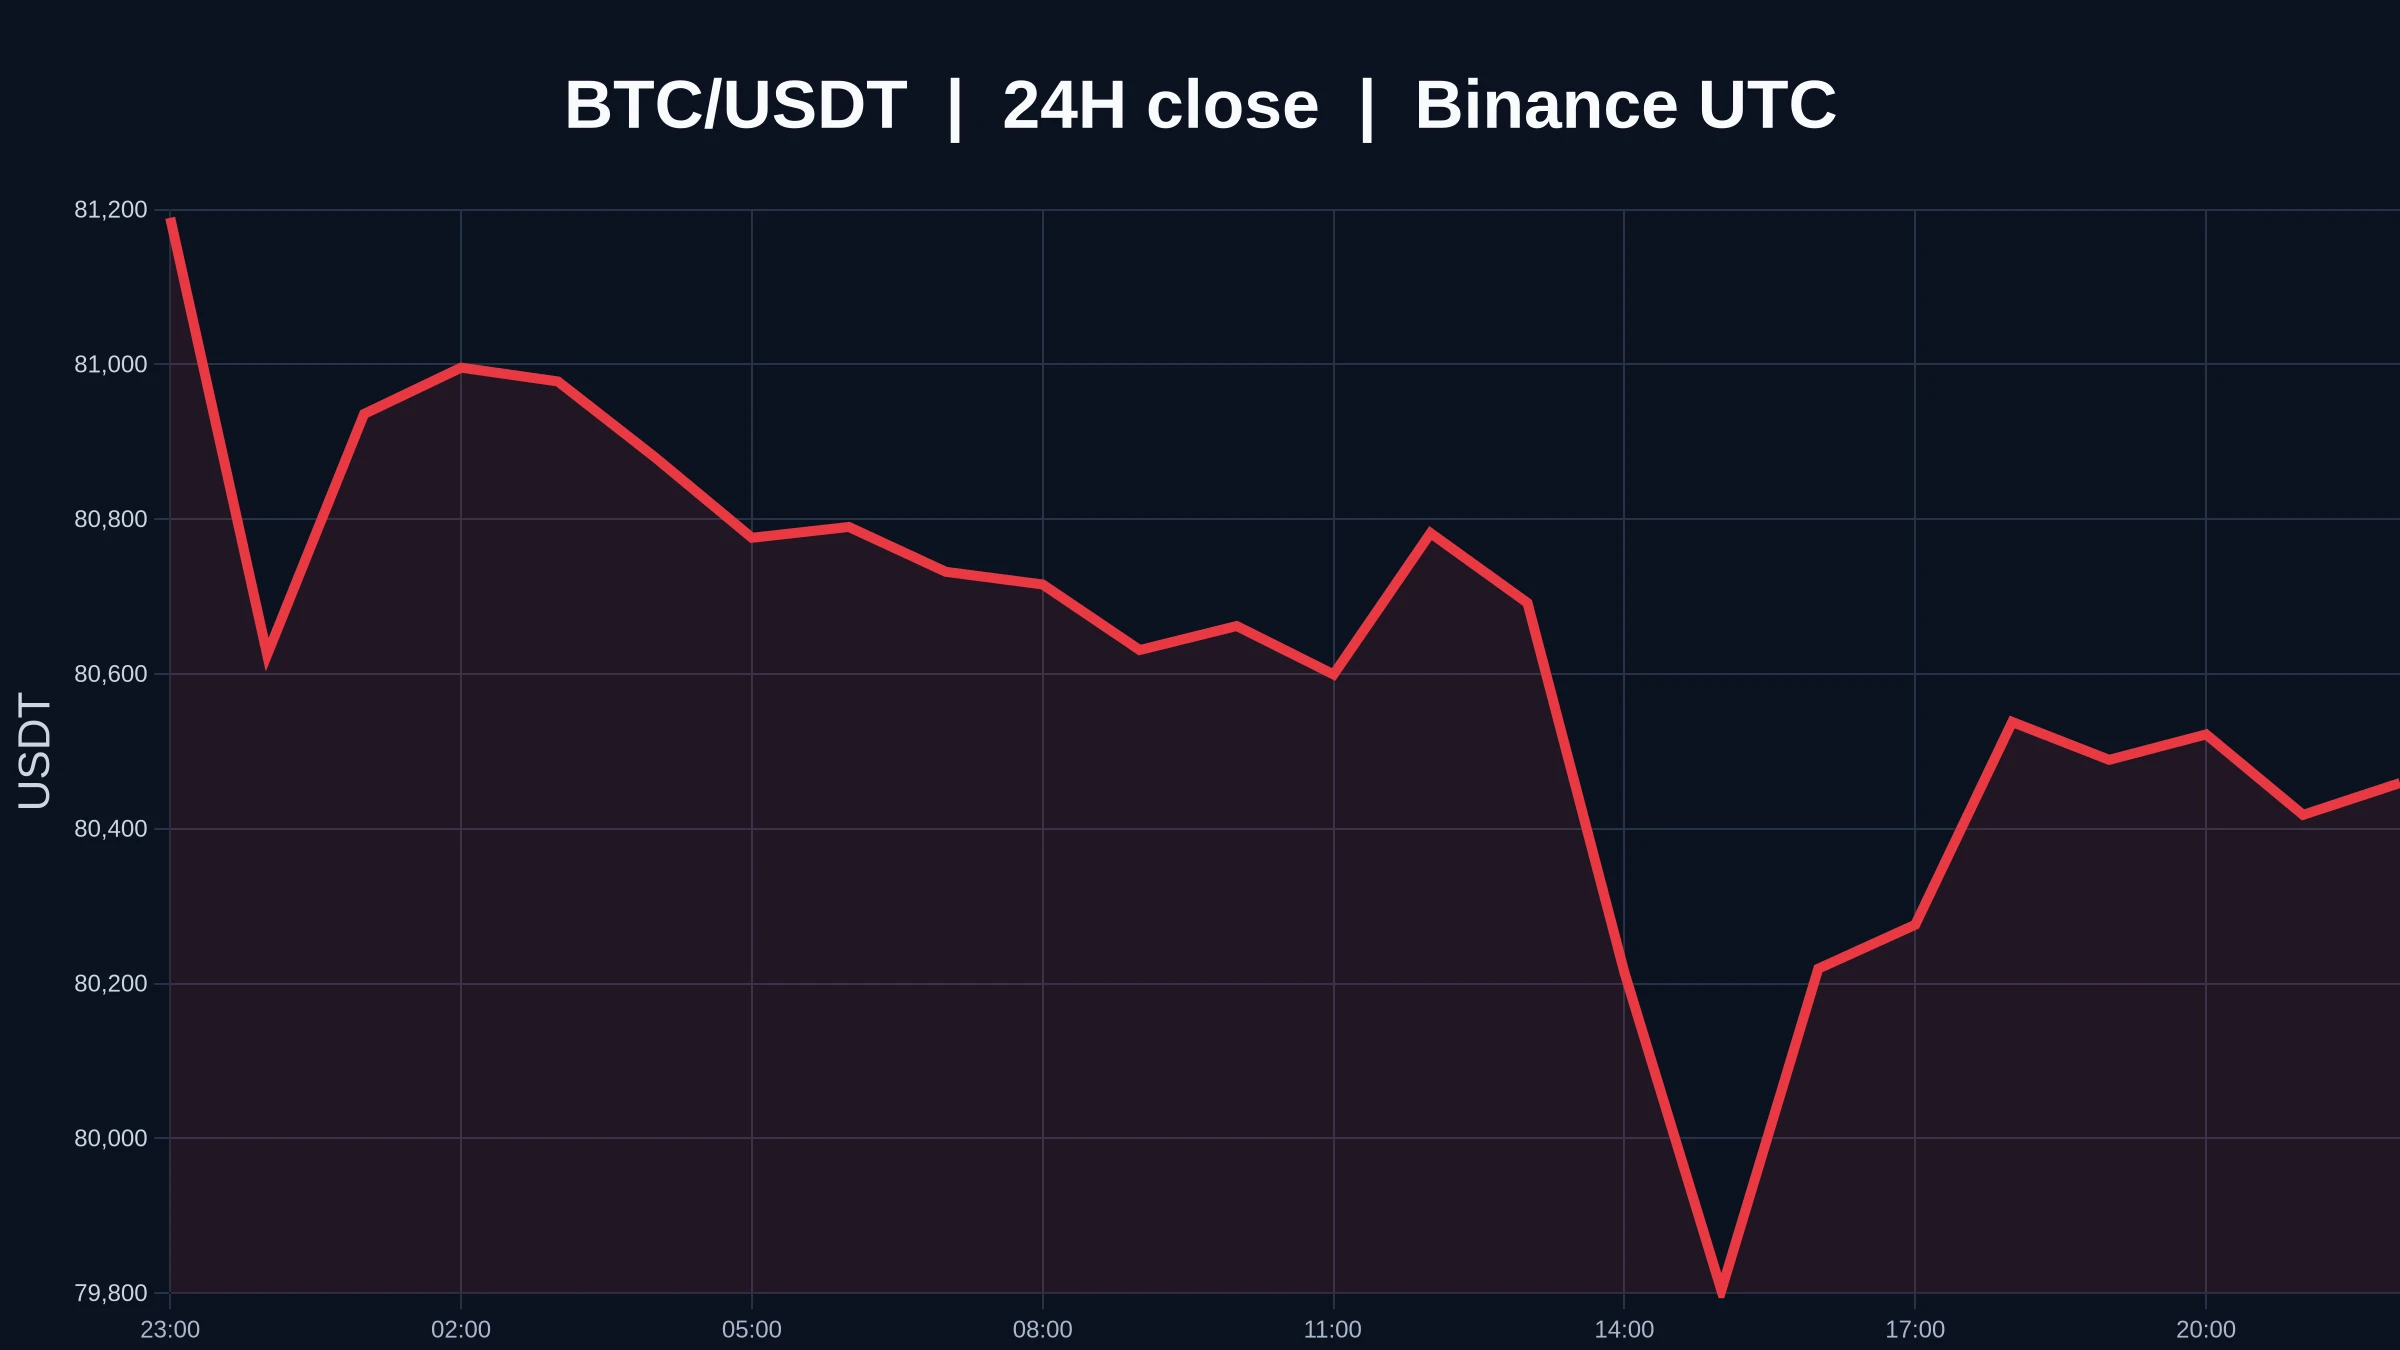
As Bitcoin attempts to hold its ground at the $82,400 level, the market is simultaneously navigating a heavy flow of macroeconomic data. Over the past 24 hours, the price dipped to as low as $79,795 before recovering to test the $82,630 mark. This movement cannot be attributed to a single factor; rather, several distinct pressures have come into play at once.
PPI surprise and interest rate expectations
The Producer Price Index (PPI) data released in the U.S. for September came in significantly higher than anticipated. On an annual basis, the PPI rose by 6.3%, reaching its highest level in four
post-image
BTC+0.46%
GT+0.28%
ETH+1.40%
SOL+1.16%
XRP+0.59%
  • 13
  • 2
Pepe have magikal skillz of riding things down to $0 & then back up again with gainz 🚀🌙
solana:EEpng77ZPn9FT4xsRjwuxNCcMBYq3HTwEscyTpump MFs get in 🚀🚀 we riding this to the moon 🌖
EEpng77ZPn9FT4xsRjwuxNCcMBYq3HTwEscyTpump
#crypto
post-image
PEPE+1.94%
SOL+1.16%
Layout: Bitcoin, Ethereum, Dogecoin
live-cover
LIVE880
  • 4
Those who went long on SanDisk around 1280 should reduce their positions around 1440.
$SNDK
post-image
SNDK-0.16%
peak lighting on the streets of north kolkata
CPI Comes in Hotter Than Expected
live-cover
LIVE40
Open a large long position on $WAL
! 🚀Entry range: 0.04995 - 0.05107Take-profit 1: 0.05335Take-profit 2: 0.05562Stop-loss: 0.04795The price is currently testing the 24-hour low of 0.05021, showing signs of stabilization on the 15-minute chart and potentially forming a double bottom. RSI(6) is 44.73, and with the funding rate negative, a short-term trade reverting upward toward the MA25 resistance at 0.05211 is currently the highest-probability strategy. Click here to trade 👇👇👇Other tokens: $SKHYNIX : Current price 981.58 - 24-hour change: -4.95%$AGT : Current price 0.032281 - 24-hour chan
post-image
AGT+113.65%
With the same 1,000U, some people doubled their money on $STRK last night, while others rushed in at today’s open and got trapped at the top. Which outcome would you choose?
Let’s look at the data first. $STRK is currently at 0.0881, up 14.3% in 24 hours, with a high of 0.0988, a low of 0.0717, and $465 million in trading volume. What does that mean? An intraday range of 38%, with trading volume several times the circulating market cap. This isn’t an ordinary rally—it’s a meat grinder for bulls and bears.
Bullish logic: STRK’s current move started around 0.07, with genuine volume coming in rat
STRK+16.15%
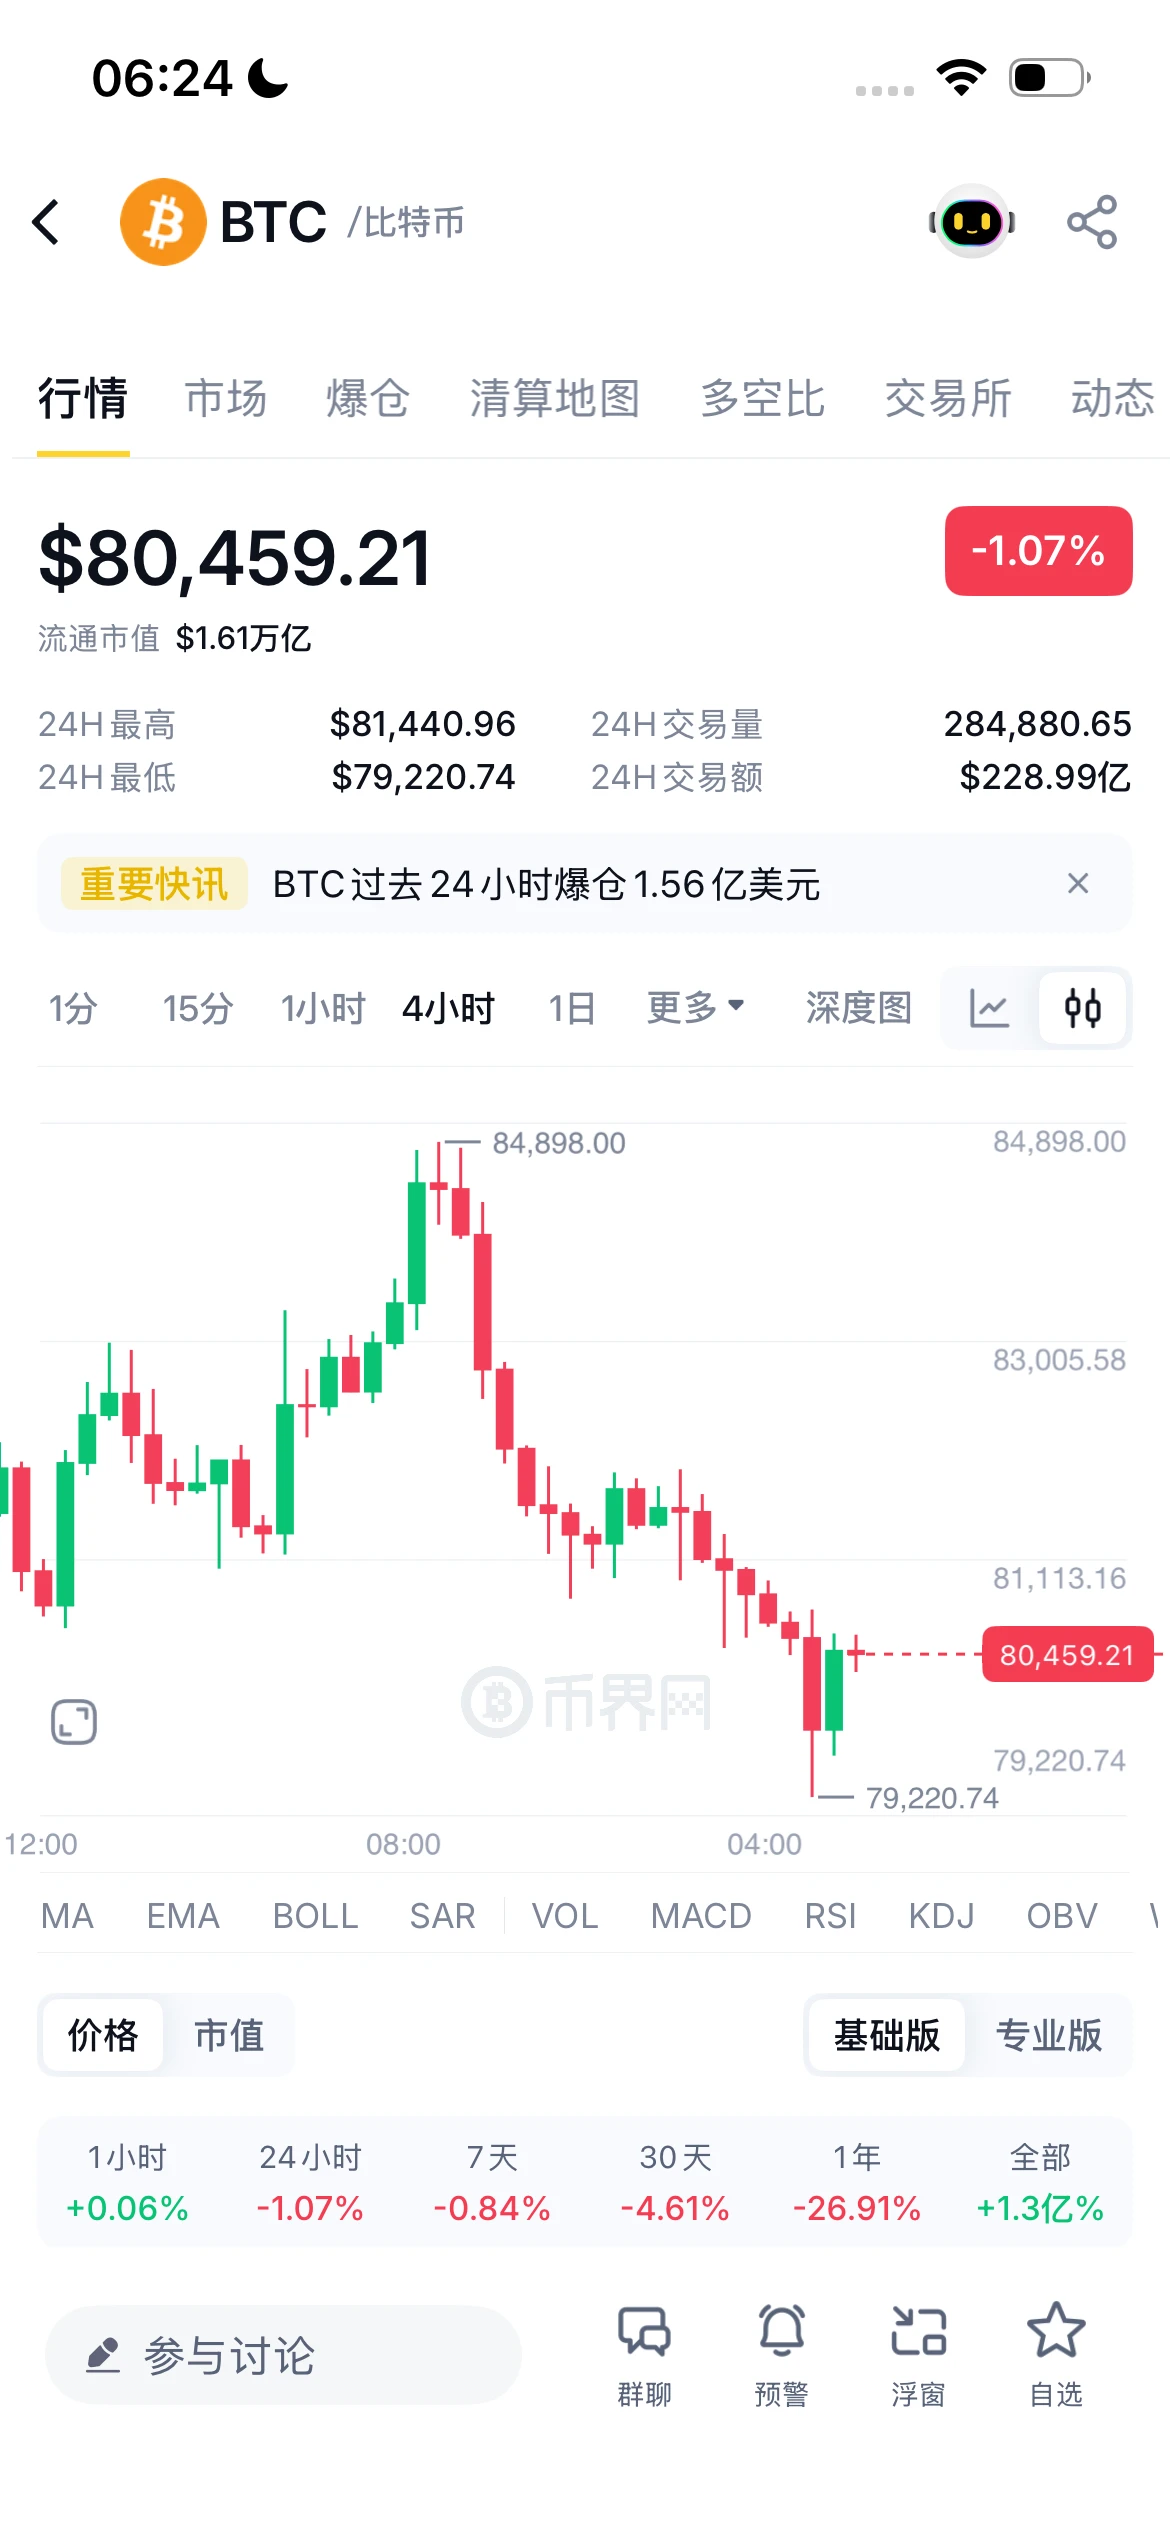
BTC is currently around 82400; after the previous pullback, it has staged a short-term corrective rebound, but the upside follow-through is weak. This is a technical recovery after the decline, with no trend reversal signal appearing for now. The broader structure remains range-bound with a bearish bias.

On the 4-hour chart, the price is below the moving averages, and rebound volume is insufficient, indicating a weak consolidative recovery. The overhead resistance zone is substantial. As long as the price fails to firmly hold above resistance, this rebound is more likely to be a continuation
post-image
BTC+0.47%
$FET took me through a trade like this: the hardest part is knowing when to exit.
This feels like a good spot. Close the position right here. Watching these two today: $SO and $BAT .
post-image
FET+4.90%
BAT+28.31%
$ETH Going To Push Up For More 👀
post-image
ETH+1.40%
Short-Selling Analysis of the Biggest Decliners: Real wealth is hidden in the red candlesEveryone is mesmerized by green candlesticks. Chasing pumps, chasing hot trends. But where is the real opportunity? It is right in front of you—in the red candles. Most people are too afraid to touch them. These four coins are weakening sharply. The market structure has already broken down. Sellers are fully in control. This is not a pullback, but a trend. Smart money positioned itself long ago. I have carefully examined every chart. No hype, just letting the charts speak. $TRUT
Risk level: HighEntry price
post-image
Broke $5K in profits today! ✅️
Looking at a $500 prize! 🎊
Copy Trading Available Soon!
Come trade with me on AlphaX!
NFA, DYOR ⚠️
#Crypto #Trading #ETH #AlphaX
post-image
ETH+1.40%
Load More

Join 40 M users in our growing community

⚡️ Join 40 M users in the crypto craze discussion

💬 Engage with your favorite top creators

👍 See what interests you

Trending Topics

USSeptemberPPIBeatsExpectations

91.35k Views1.88k Discussing

US September PPI came in at 6.3% YoY, well above the 5.3% market expectation, pointing to renewed producer-side inflation pressure. Weekly jobless claims were 199K, broadly in line with forecasts. Could hotter inflation further reduce room for rate cuts, and what does it mean for $BTC, US stocks, and gold?

DrLinHanSpeaksAtOxfordUnion

135.63k Views1.86k Discussing

JapanAndKoreaStocksPlunge

47.27k Views1.76k Discussing

View More