Share your thoughts
placeholder
Article
Everyone’s staring at NEAR’s dip—but the 95% confidence score says this pullback is the trap.

$NEAR /USDT - LONG

Trade Plan:
Entry: 2.1571 – 2.1813
SL: 2.0529
TP1: 2.2564
TP2: 2.3146
TP3: 2.4019

Why this setup?
- RSI on the 15m is crushed at 33.82—oversold fuel for a bounce, not a breakdown.
- 1D trend remains bullish; this 4h setup is a classic retest of 2.1692 support.
- With ATR at 0.048, the squeeze is primed: TP1 at 2.2564 is just 4% away, but TP2 at 2.3146 is the real prize.
- Why now? The entry window (2.1571–2.1813) is open, and momentum is coiling for a vertical push.

De
NEAR+2.32%
Dare to make a prediction, dare to share your results! This time, let the market grade your judgment
The most exciting moment in trading is often not placing the order, but waiting for the result.
The Gate event contract trade-sharing challenge made me think of a very practical question: We usually like to say that we understand the market, but publicly sharing our direction, timeframe, and rationale is another matter entirely.
Because once you share your trade, the market becomes your “grader.”
I pay more attention to trades like these: a clearly defined asset, timeframe, and direction, along
  • 29
Everyone’s watching 54.17 on $LTC /USDT—but the real trap is what happens below 52.79.

$LTC /USDT - SHORT

Trade Plan:
Entry: 54.02 – 54.32
SL: 56.01
TP1: 52.79
TP2: 51.87
TP3: 50.49

Why this setup?
- 1D trend is *range*, yet 4h momentum is screaming SHORT with 77% confidence.
- RSI on 15m sits at 50.5—no bounce fuel left; price is stalling right under resistance.
- ATR (0.59) shows low volatility—perfect setup for a slow bleed to TP1 (52.79) before a quick flush to TP2 (51.87).
- Why now? Entry zone 54.02–54.32 is a magnet for late longs, but invalidation at 51.03 is far—room to ru
LTC+8.36%
I didn’t enter immediately during the first wave of decline because after this kind of rapid sell-off, there is often an exaggerated rebound, and chasing shorts can easily result in getting stopped out badly. So at the time, I only marked a key zone at the highs and didn’t rush to act. The price did rebound afterward as expected, but near the key zone, it failed to show the rebound strength it should have had, with each lower-timeframe candlestick weaker than the last. Only then did I enter short in the direction of the decline. Since the entry was relatively close to the key zone, setting the
post-image
ETH+1.05%
BNB+6.17%
Lacking perspective, I can't hold on; the profit on this trade is as thin as paper, but I love it. A few days ago, the last thing I checked before bed was the market. $BMNR had clearly moved sideways around 24.39 all day, and every time it was pushed down, buyers happily stepped in to catch it. The signs of bottoming consolidation were plain to see. While others were fearful, I was greedy. I figured there wasn't much room to fall further from that level, so I opened a long position and got in early.
When I opened the app this morning, wow—it had been pushed straight up to 25.26, and at the key
post-image
BMNR+0.96%
SNDK+1.99%
LAB+0.12%
Pretty happy—I got to eat #晒出我的持仓收益 after sleeping.
post-image
Bitcoin just rallied from $62k to $82k
That makes me insanely bullish right now
Let’s hope for an all time high by end of year!!
post-image
BTC+0.11%
Everyone’s chasing PEPE longs—but my 4h tape just flipped a quiet SHORT signal.

PEPE/USDT - SHORT

Trade Plan:
Entry: 0 – 0
SL: 0
TP1: 0
TP2: 0
TP3: 0

Why this setup?
Why now?
- Range-bound on the daily = no trend to trust, only mean reversion.
- 15m RSI at 59.24 shows mild bullish pressure, but that’s exactly the trap before a dump.
- Confidence sits at 55.4—not screaming, but enough to fade the next pump.
- With ATR near zero, volatility is coiled; the breakout direction is down.
- Status: “Waiting”—so we’re early, not late.

Debate:
Is PEPE dropping to retest range lows, or
PEPE+2.75%
I was just about to go to the forum and start cursing, but then I looked at my balance and thought, never mind—the market is always right. I placed the order before bed a few days ago and thought it would go to waste, but today $SUI gave the answer directly—entered at 0.7362, now at 0.8054, with an unrealized gain of +452.99%. Feels great, guys.
I didn’t use any fancy analysis this time; I just looked at whether the buying support was strong enough. Before the market had fully started moving, every pullback held the level, which meant someone was buying underneath. Since someone was buying, I
post-image
SUI+5.71%
BTC+0.11%
ADA+3.89%
Everyone’s staring at the 1D range—but the 4h is quietly setting a trap on $BNB /USDT.

$BNB /USDT - SHORT

Trade Plan:
Entry: 767.9 – 771.3
SL: 790.3
TP1: 754.1
TP2: 743.7
TP3: 728.2

Why this setup?
- Price pinned at 769.6 with RSI(15m) at 46.96—no momentum to break upward.
- ATR(1h) at 6.63 means volatility is compressing; shorts love this setup before expansion.
- Targets are stacked: TP1 754.1, TP2 743.7, TP3 728.2—room to run if 767.9 fails.
- Why now? The 1D range gives false comfort, but the 4h signal (Conf 77) says the next leg is down.

Debate:
If BNB loses 767.9, are you r
BNB+6.17%
I originally planned to cut my losses as a sacrifice to the heavens, but the ritual never happened—the meat roasted itself.
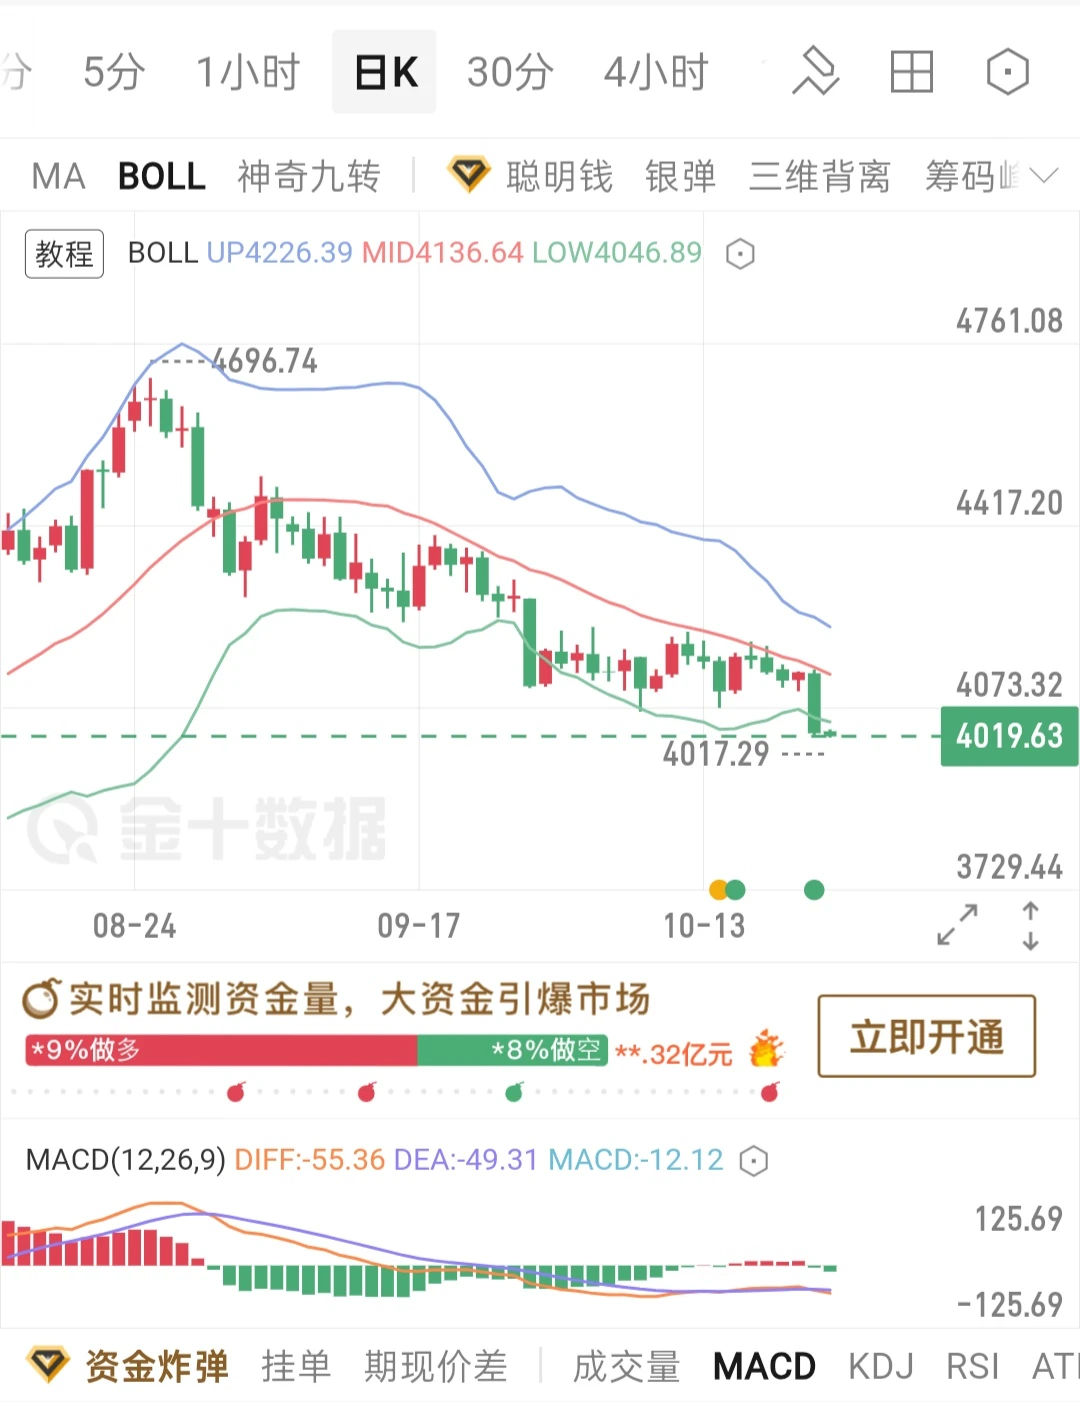
With green filling the screen, $XAU kept oscillating around 4474.29, while the sell walls grew thinner each time. There was clearly no big money looking to take the other side. The rebound lacked volume and support, so I followed the trend and entered a short.
I switched over casually and saw it had already dropped to 4438.98, giving me a full +72.11% on paper. That was real meat on the table. It dragged its feet earlier, but the result tastes just as good.
Take profits
post-image
XAU+0.07%
XRP+1.20%
BNB+6.17%
Goldie sends his regards 🚬
$TROLL WAV
post-image
TROLL-22.36%
[New streamer BTC]
live-cover
LIVE54
I originally wanted to cut my losses and sacrifice to the heavens, but the sacrifice never happened—the meat cooked itself. When the market plunged, the move hadn't fully gotten underway yet. I watched the volume for several minutes; no matter how hard the price tried to surge, it couldn't break higher, while sell orders kept coming in wave after wave. This kind of market is just handing points to the bears, and hesitating only makes it easy to miss out.
I'd rather miss a limit-up than catch a falling knife and end up with blood all over my hands.
So I placed a short order at 0.43133 and waite
post-image
DOGE+6.05%
BTC+0.11%
Crypto Signals and Trding Insights
live-cover
LIVE1,369
I remain bullish on this market cycle, and I don't think we're at the end of the bull market. Instead, it looks more like the main uptrend is beginning to spread from BTC to altcoins.
Why do I see it this way?
Because what is happening in the market is no longer just one or two coins performing independently.
ZEC keeps making new highs, DASH and XMR are beginning to accelerate, and platform tokens like GT are rising in succession. This shows that capital has started flowing out of BTC, ETH, and the earlier Meme rally, and is once again searching for the next batch of assets with attractive ris
NVDA+0.87%
The hand that set the stop-loss a few days ago trembled slightly; this morning, I realized that was unnecessary filial piety. Before bed, I placed the short order for $TUT , and when I woke up, the candlestick had already completed most of the move for me 😏
Watching the market at the time, the rebound had no volume, and every push upward felt weak. The selling pressure above was obvious—someone was rushing to exit every time the price tested a high. This structure was not a breakout, but a bull trap. I set the entry at 0.042201 in advance; when it was time to short, I shorted without hesitati
post-image
TUT+21.75%
SNDK+1.99%
BNB+6.17%
CRYPTO THINGS YOU MAY HAVE MISSED — LAST 24 HOURS | 5 SEPTEMBER 2026
The market looked weak—but institutions quietly poured more than $1.2B into bitcoin:native and $ETH funds last week.
The price and capital flows are telling different stories.
🧵👇
1/2 — ETF DEMAND SURVIVED THE MACRO SHOCK
US spot ETFs recorded approximately:
🟢 bitcoin:native: $986.7M weekly net inflow
🟢 $ETH: $215.3M weekly net inflow
🟢 Combined: $1.20B
Friday alone added $174.6M to Bitcoin funds and $25.9M to Ethereum funds—even after the stronger payroll report increased Fed-hike risk.
Investor takeaway: institutions co
post-image
BTC-2.35%
ETH-2.49%
HBAR+2.91%
XLM+2.77%
XDC+1.30%
MARKET ALERT - GIGGLE
15-Minute Timeframe Analysis (Short-Term Correction)
The current price (40.89) is below EMA20 (41.30) and EMA50 (41.73), indicating a short-term corrective trend after touching a peak of 44.62. However, the price is holding just above the strong EMA200 support (40.62).
​Trading Opportunities:
​Long Scalping: Buy on weakness near the EMA200 area (40.20 - 40.60). Quick take-profit (TP) target around EMA20/EMA50 (41.50 - 42.50). Set a tight stop loss (SL) below 40.00.
​Further Option: If EMA200 breaks down, a Short opportunity opens toward the 37.50 area.
​1-Day Timeframe An
post-image
GIGGLE+0.99%
SOL+1.32%
DOGE+6.05%
  • 1
The opportunity is still there, be patient.

$ADA $SOL
post-image
ADA+3.89%
SOL+1.32%
Load More

Join 40 M users in our growing community

⚡️ Join 40 M users in the crypto craze discussion

💬 Engage with your favorite top creators

👍 See what interests you

View More