
Square
Following
Hot
News
Notifications
Profile
Share your thoughts
placeholder
Article
Market Update
live-cover
LIVE1,050
BTC-0.67%
The rebound after ETH and BTC plunged was driven by relatively passive factors:

A natural recovery after panic reached an extreme: The Fear and Greed Index had fallen to single digits (extreme fear territory), and bears had made substantial profits in a short time. Some chose to close their positions and take profits, bringing in buybacks.

Technically oversold: Bitcoin fell rapidly from above $62,000 to $55,130. The short-term decline was too steep, creating an inherent demand for a pullback toward the moving averages or previous lows.

A weekend liquidity vacuum amplified volatility: While
post-image
ETH-9.05%
BTC-5.94%
Trenches
FIONA
F
bade
b
FIONA
B34n...pump
Market Cap
$.
Change
.
24h Vol
$.
Holders
.
PIEVERSE
P
bade
b
PIEVERSE
0x0e...25a9
Market Cap
$.
Change
.
24h Vol
$.
Holders
.
IDOL
I
bade
b
IDOL
0x3b...ab07
Market Cap
$.
Change
.
24h Vol
$.
Holders
.
CLAUDIA
C
bade
b
CLAUDIA
2j5S...W2ZM
Market Cap
$.
Change
.
24h Vol
$.
Holders
.
Singularity
S
bade
b
Singularity
7R4M...pump
Market Cap
$.
Change
.
24h Vol
$.
Holders
.
CRYPTO MARKET TRENDS
live-cover
LIVE1,314
BTC-0.67%
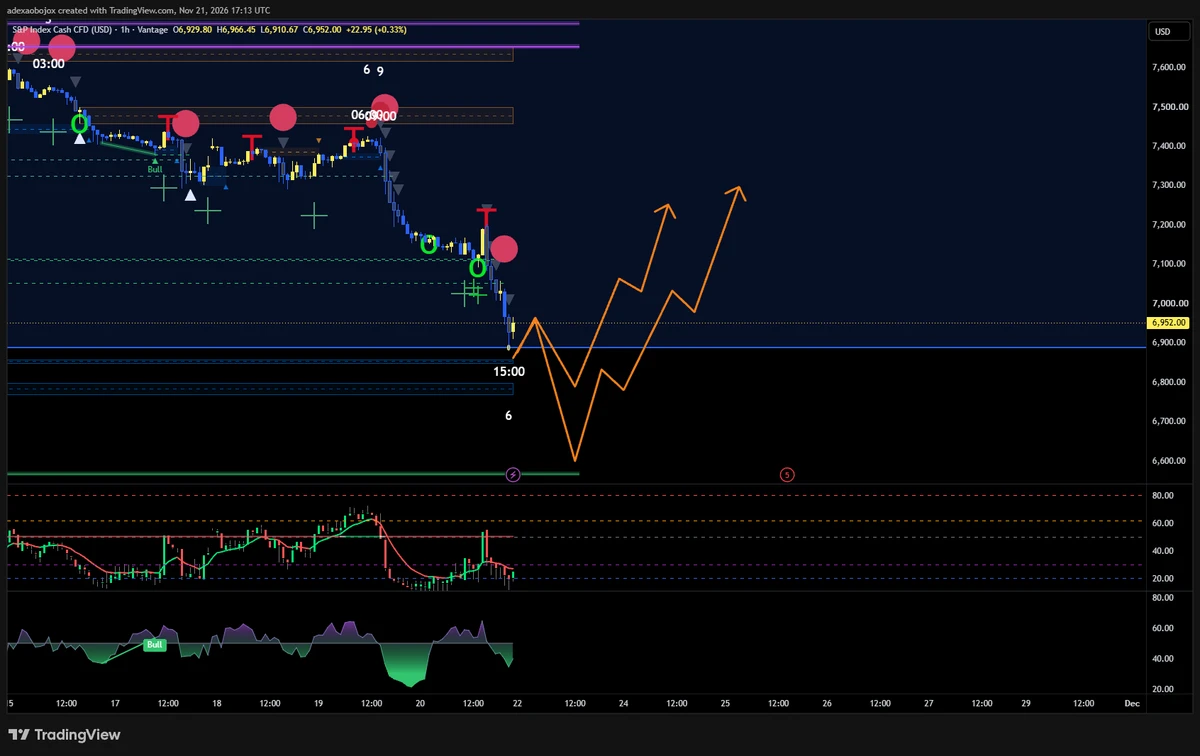
sp500 bottom will be in monday imo most likely all past 4 major dumps bottoms on mondays 6600-6800
post-image
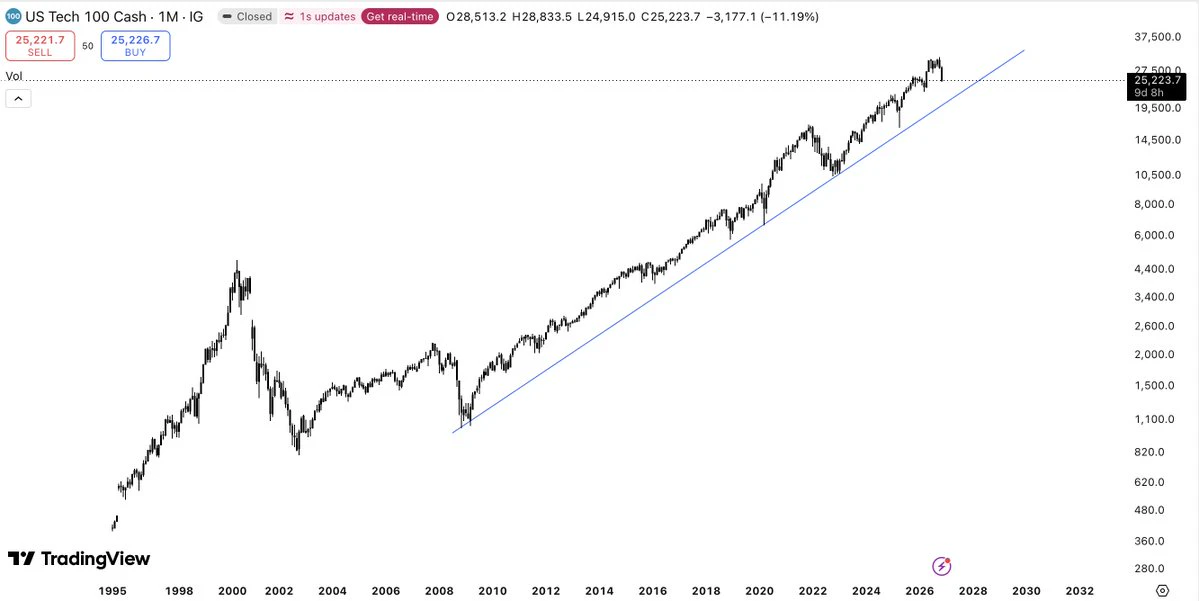
NASDAQ looks like this and the timeline is acting like the world is ending.
we could drop another 20% from here and the multi-decade uptrend would still be fully intact.
if anything, this is a great buying opportunity for anyone with a long time horizon.
just chill ffs.
post-image
NDAQ-0.95%
  • 1
Spending the weekend in the Belgian Ardennes!
So, how are the markets doing? We at 0 yet?
2026.11.22
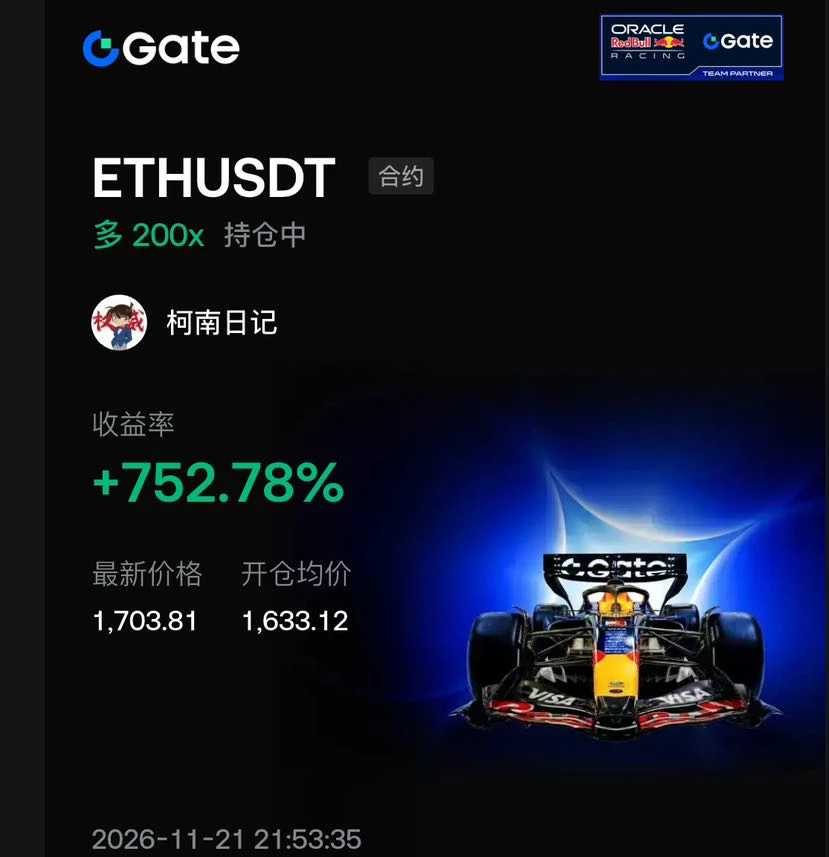
Daily chart entry point: 1683
Resistance levels: 1701-1710-1716-1726-1736
Support levels: 1680-1671-1656-1647-1636
1626-1616-1600-1580-1550-1543-1536
At the first break of any support or resistance level, stop out; if it holds, look for a rebound. Once price stabilizes, follow the trend. This is personal advice for reference only. Pay attention to 1716-1626-1543-1536.#BTC跌破6万美元关口 $ETH
post-image
ETH-1.23%
Crypto Market Academician: 11.22 Ethereum (ETH): Can a lower wick save the trend? Bearish alignment remains unbroken, and oversold momentum is fading!
For several days in a row, I’ve mentioned 1650 as the first step for spot positioning; the second step at 1550 has also been entered. The first medium- to long-term target is above 3000. It doesn’t matter how long I hold—in any case, it’s money I’ve set aside for my own funeral. I tried going long with futures five or six times and got stopped out. Fortunately, I always leave myself room to be wrong: if my call is wrong, I exit with a small loss
ETH-1.23%
Let me show you the Las Vegas storm, and you'll see. At the bottom of the previous cycle, the Las Vegas channel, plus this cycle's Las Las Vegas channel #BTC跌破6万美元关口 Bitcoin near 44000 $BTC
BTC-0.65%
  • 1
11.16—11.20 Ace's Weekly Live Trading Log

It was a busy week, with setups on both BTC and ETH, switching between long and short positions and catching most of the moves.

BTC gained a total of 16,302 points, and ETH gained a total of 560 points.

Over five days, we logged 28 live trades. The market went up and down, and we adjusted our positions accordingly. The market never lacks opportunities; the key is not to just watch the action, but to know when to make a move.

This week's results speak for themselves. Next week, we'll continue following the market and looking for opportunities with y
BTC-0.65%
ETH-1.23%
I shorted $ENA $ENA, but was stopped out. The trade didn't develop as planned. BTC rose 3.64%, while ENA's maximum move was only 0.83%, falling short of the 1.86% required for TP1. Check BTC's movement before trading altcoins in the same direction. Details: - The 0.095232–0.095726 range was filled exactly at the limit order price - The maximum favorable move was 0.83%, falling short of the 1.86% required for TP1 - SL at 0.098442 was hit about 1 hour and 15 minutes after entry - The stop loss was triggered by a wick, and the candle closed back inside the range - BTC's gain during this period: +3
post-image
ENA+8.04%
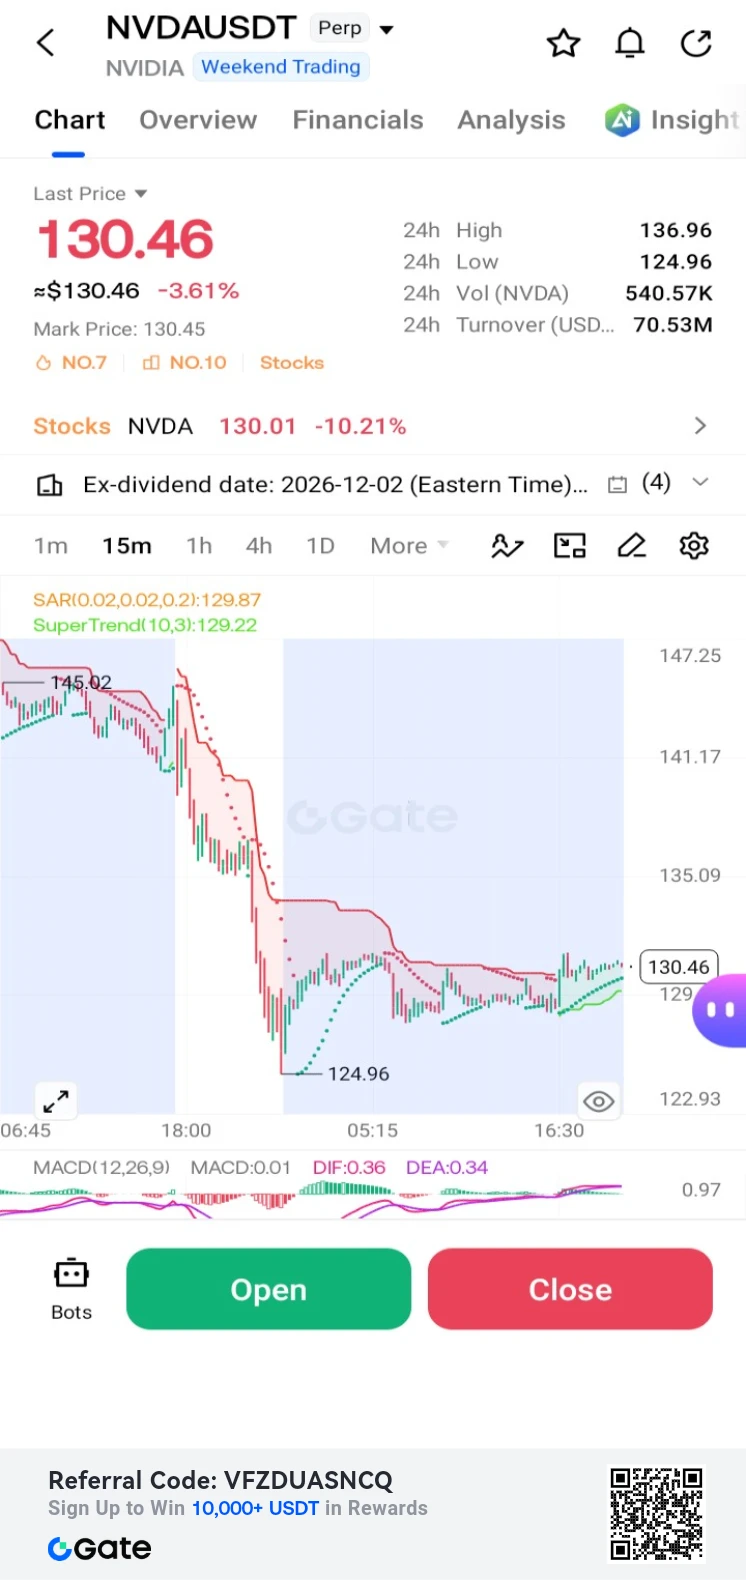
$NVDA /USDT Perp – "Volatile Rebound – Long"**
Trading Plan Long $NVDA
Entry: 130.46
SL: 124.96
TP1: 135.09
TP2: 136.96
NVDA is down -3.61% but recovering from the 124.96 low. MACD is crossing bullish; targeting a retest of the 135.09 EMA cluster.
post-image
NVDA-0.35%
#美联储理事库克支持进一步加息 The Fed is most likely to prioritize containing inflation next. A sharp stock market decline alone is unlikely to make it pivot to a bailout; it is more likely to slow the pace of rate hikes, while keeping policy on a tightening path.

Why inflation comes first
· Inflation remains sticky: Core PCE has stayed around 2.8% for several months, still far from the 2% target.
· The labor market hasn’t loosened: Unemployment is low, so the Fed doesn’t need to rush to protect jobs.
· Officials lean hawkish: Cook believes financial conditions remain too loose and that the 25-basis-point
post-image
BTC-0.67%
NDAQ-0.95%
XAU+0.38%
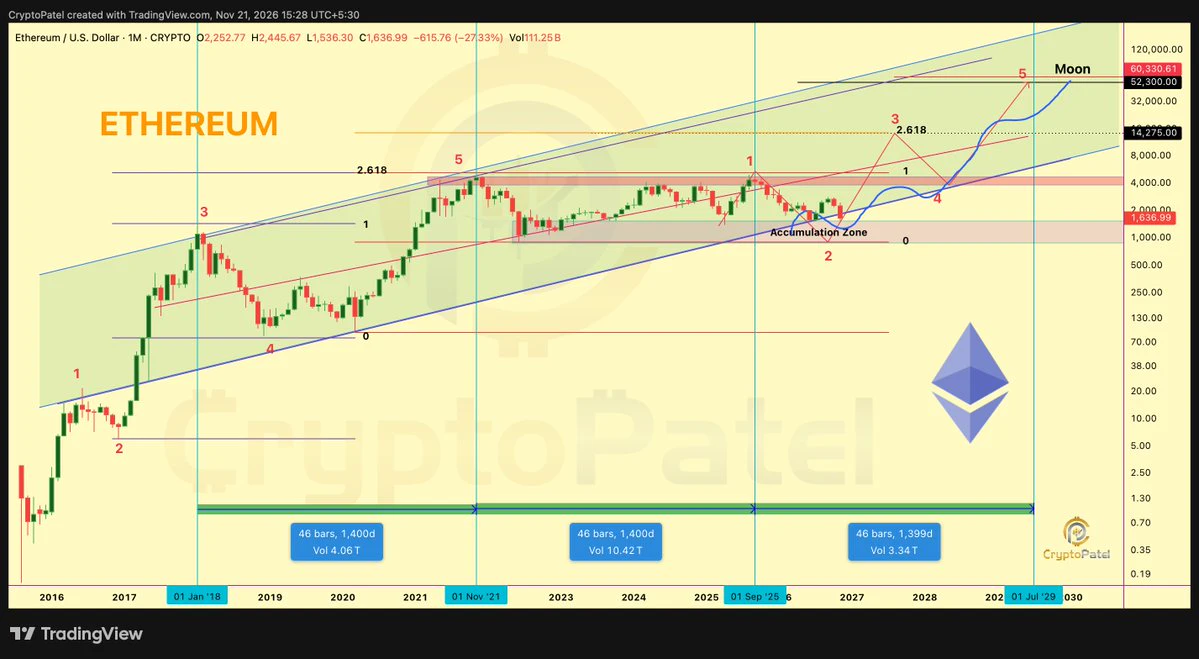
ETHEREUM ($ETH ): NEXT BOTTOM & ATH PROJECTION
I analysed Ethereum's historical ATH-to-bottom corrections and cycle durations. Here's what the mathematics suggests.
Historical Corrections:
🔸 2016: -72.45%
🔸 2018: -94.33%
🔸 2021: -81.92%
🔸 2025–26: -69.51% (June low)
Previous cycles recorded an average correction of 82.90% and a median of 81.92%.
Next Potential Bottom:
Based on the August 2025 ATH of $4,954:
🔸 Average model: $846
🔸 Median model: $1,300
Next ATH Scenarios:
🔸 Conservative: $5,500–$6,000
🔸 Base case: $6,000–$8,900
🔸 Aggressive: $9,000–$11,000
Potential Timeline:
🔸 Further
post-image
ETH-1.26%
$MSTRB Diverges Between the Short and Longer Term—Which Will Change First?
$MSTRB The current price of $MSTRBUSDT is 80.22, down 1.775% over the past 24 hours, with an intraday range of 72.36 to 82.52. The 1-hour chart is showing strength, with the price above the EMA20 (79.1409). The RSI14 is 55.99, in neutral-to-bullish territory, and the volume ratio is 1.96, indicating signs of active buying support in the short term. The 4-hour chart remains weak, with the price still below the EMA20 (84.9559). The RSI14 is only 20.47; while not deeply oversold, momentum is lacking, and resistance is far
post-image
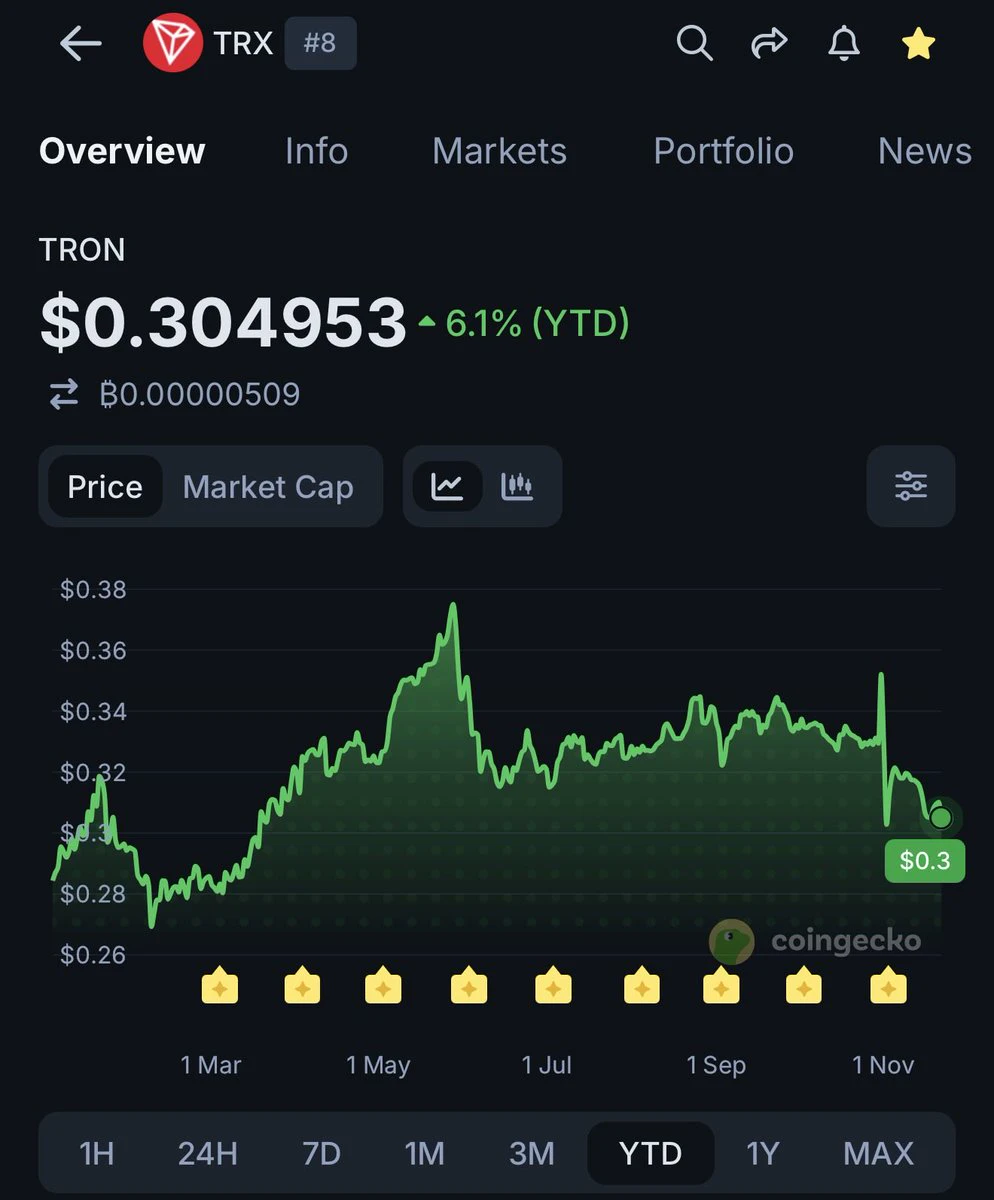
tron:native
For a whole year, it basically hasn't dipped 🫡
post-image
TRX+0.42%
#BTCBreaksBelow60K #ShareWeekly

Bitcoin at $58,252: Selling Pressure Intensifies as ETF Outflows Continue and Rate Expectations Shift

Bitcoin is facing another important test as its price remains below the psychologically significant $60,000 level. At the latest market snapshot, BTC is trading around $58,252.10, with a 24-hour high of $62,183.40 and a low of $55,123.00. This wide trading range reflects considerable volatility and suggests that market participants are still struggling to establish a clear direction.

In my view, the current situation is more complicated than an ordinary pric
post-image
$ADA 0.1452, up 3.86% in 24 hours. It has surged to the 1-hour resistance at 0.1456. RSI is at 73, but volume has shrunk to 0.4x, so short-term bulls are starting to run out of steam. The 4-hour timeframe is still weak, and the conflicting signals between the two timeframes are the most challenging. For now, keep an eye on 0.1456; only if it holds steady can we look toward 0.1566. If it pulls back, first watch for support at 0.1333. Not investment advice
#ADA #Cardano
post-image
ADA-1.48%
London Solana Breakpoint ‘26
- Sent from my digicam
SOL-0.77%
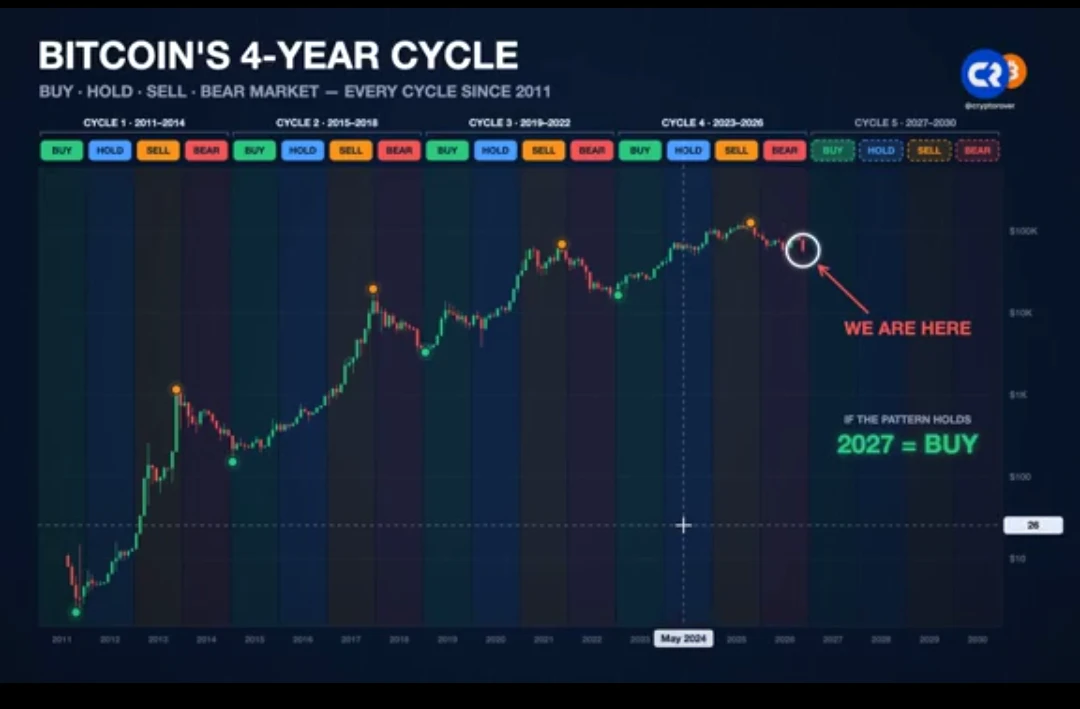
Bitcoin 4-Year Cycle Continues:

Cycle 1 (2011–2014)

2011 — Buy
2012 — Hold
2013 — Sell
2014 — Bear Market

Cycle 2 (2015–2018)

2015 — Buy
2016 — Hold
2017 — Sell
2018 — Bear Market

Cycle 3 (2019–2022)

2019 — Buy
2020 — Hold
2021 — Sell
2022 — Bear Market

Cycle 4 (2023–2026)

2023 — Buy
2024 — Hold
2025 — Sell
2026 — Bear Market ← WE ARE HERE

Cycle 5 (2027–2030)

2027 — Buy
2028 — Hold
2029 — Sell
2030 — Bear Market

So far, the 4-year cycles have played out perfectly.

With the pattern continuing, the best buying time is NOW.

#BTCBreaksBelow60K #GateDirectIPOPhase3ANTAllocates92100Shar
post-image
BTC-0.67%
Load More

Join 40 M users in our growing community

⚡️ Join 40 M users in the crypto craze discussion

💬 Engage with your favorite top creators

👍 See what interests you

Trending Topics

BTCBreaksBelow60K

2.1M Views29.9K Discussing

BTC fell below $60,000 on November 20 for the first time since July, alongside a tech stock selloff and broader pressure on risk assets. Will $60K become resistance, or can BTC quickly reclaim it? What price or volume signals would convince you that selling pressure is easing?

GateDirectIPOPhase3ANTAllocates92100Shares

779.2K Views4.9K Discussing

NvidiaDropsNearly14Percent

326.7K Views7.6K Discussing

View More