








Share your thoughts
placeholder
Article
The CME market is pricing roughly 60.4% odds of a September hike.
Seth argues they will pause.
So the question becomes: do you follow Seth’s read, or the CME curve and the pro traders placing real money on Kalshi and Polymarket?
post-image
CME-0.25%
KALSHI-0.68%
I originally wanted to cut my losses to appease the heavens, but the ritual failed and the meat cooked itself.

The last thing I looked at before bed a few days ago, $GWEI was testing that key level again. It was pushed back both times it moved up. Volume failed to follow, and an upper shadow remained before the close. This wasn't strength; someone was using the rebound to distribute. I set up a short position around 0.029983, placed the stop-loss above the breakout level, and left the rest to time. I woke up not too late today, opened the chart, and saw that the price had quietly reached 0.
post-image
GWEI-5.27%
DOGE+0.22%
SNDK+0.35%
I did nothing but use the restroom, and by the time I came back, the K-line had already done the work for me. During the intraday bottoming process, $BNB repeatedly retested the level without breaking down. I saw buying pressure gradually strengthening, so I immediately called it out and opened a long position. Entered at 641.25, now at 739.65, +1089.03%—taking off directly, perfectly catching the rhythm. This profit feels so good; staying up late was worth it, brothers. Take 80% profit first and secure the gains, then move the stop-loss on the remaining 20% to the entry price and let the prof
post-image
BNB-1.77%
SOL-1.91%
SNDK+0.35%
With this price action, I don't even need to think—the account is dancing on its own.
When everyone else was running, I didn't follow because I saw that the market structure hadn't broken down. It moved sideways at the bottom for several days, and someone stepped in to buy every dip. That's not weakness; it's building strength while playing dead.
Everyone is still aboard, and $ENA has climbed from 0.09610 to 0.16495, with returns reaching +3452.72%. I handled this round perfectly.
Remember, pocket the bulk first: take 80% profit, and set the remaining 20% at the entry price for protection. Nev
post-image
ENA-6.12%
SOL-1.91%
ETH-0.60%
$ACE I kind of don't want to close the position. I'm continuously collecting funding fees—about 40+ U every 4 hours. It's hard to decide.
post-image
ACE+17.85%
Recently, $ZEC triggered a massive short squeeze following the listing of Grayscale’s spot ETF (ZCSH), with the price surging to around $1,250 and $34 million in shorts being liquidated. But once the bullish news materialized, it became bearish; after the high-leverage long positions ran out of funds, the price quickly retraced.
I decisively entered a 75x short at an average entry price of 1211.01. The exhaustion of buying pressure triggered a cascading sell-off, sending the price down amid volatility to the latest price of 1155.48.
The position currently has an unrealized profit of +325.36%.
post-image
ZEC-5.58%
BTC-0.86%
ETH-0.60%
$SPCX /USDT is range-bound on the daily trend but the 1h ATR whispers a short is forming.

$SPCX /USDT - SHORT

Trade Plan:
Entry: 150.04 – 150.28
SL: 151.35
TP1: 149.27
TP2: 148.67
TP3: 147.78

Why this setup?
Why now? The daily trend is range, which means the 1h price of 150.16 sits at a natural magnet for mean reversion. The 15m RSI reading of 48.86 confirms the short-term momentum is neither oversold nor overbought, allowing a clean entry within the 150.04 to 150.28 zone. The 1h ATR of 0.496517 quantifies the volatility contraction before a potential snap-back toward TP1 at 149.27. If t
SPCX-0.49%
$$IOST 40% gain hasn't caught up? Is it still worth chasing at the 0.0010 price level? When I was watching the market last night, it surged straight through from 0.0007, with $120 million in trading volume—not something retail traders could generate. This volume-driven rally is most likely major players rotating positions, but the 0.0010 round-number level happens to be a dense area of underwater positions from earlier, so if it fails to break through in the short term, it could become a meat grinder.
Scenario analysis: If it holds above 0.0011 over the next 4 hours, it could replicate the 30%
IOST+35.43%
My hand trembled slightly when I set the stop-loss a few days ago; this morning, I realized that concern had been unnecessary.

During the repeated intraday swings, I kept watching the strength of the rebound, and no matter how I looked at it, something was missing. The selling pressure was simply too strong, and trading volume was pitifully low. A rebound like this is just handing you a knife. I said it then: the resistance above was obvious, so don't buy into it.

Right after I finished reading the bearish news, the market indeed couldn't hold up. This wave of $BAS shorts entered at 0.028
post-image
BAS-2.03%
SNDK+0.35%
ETH-0.60%
$MU /USDT is quietly sitting on a trapdoor most traders will ignore.

$MU /USDT - SHORT

Trade Plan:
Entry: 1037.64 – 1039.74
SL: 1048.76
TP1: 1031.14
TP2: 1026.10
TP3: 1018.54

Why this setup?
Why now? The daily trend is range-bound, but the 1h ATR of 4.197159 shows enough explosive energy to fuel a short move once price breaks below the 1h price of 1038.96. The 15m RSI at 41.04 signals bearish momentum without being oversold, so the setup is still active. With the entry zone anchored at 1038.69 and targets at TP1 1031.14 and TP2 1026.10, the risk-reward favors patience. The invalidation l
MU+1.89%
Nobody is talking about the 1h RSI reading that changes the $SOL /USDT game

$SOL /USDT - SHORT

Trade Plan:
Entry: 103.72 – 104.16
SL: 106.02
TP1: 102.38
TP2: 101.34
TP3: 99.78

Why this setup?
Why now? The 1h price is sitting at 103.94, right on the entry_ref level, which means the setup has just armed itself at the top of the 1h ATR range of 0.867223. The daily trend is range-bound, so we are not chasing a breakout but fading a range top with a 15m RSI of 45.49 confirming bearish momentum. The target stack gives a clear path from TP1 at 102.38 down to TP2 at 101.34 and TP3 at 99.78, offe
SOL-1.91%
$RSTR
The move from 2M - 100M will be explosive.
There isn’t a world it doesn’t go mainstream, we saw it with Kabuto’s with pokemon cards.
This time we have the entire trenches working towards driving the price of Robinhood hats in RuneScape up causing all sorts of speculation across Reddit.
It’s literally the micro strategy of Robinhood.
Buying everything up driving the price astronomical.
The chart of the hat is WILD:
It’s legit a straight line up.
We all witnessed one guys efforts on pokemon, by himself. An army of degenerates with an austic dev live streaming the whole thing is the funnies
post-image
hot Topics updates
live-cover
LIVE82
The trenches just had the biggest volume week since $TRUMP.
We are so back.
post-image
SalahMode locks Instagram and TikTok at every prayer time, then unlocks only after AI verifies you actually prayed.
Prop your phone, complete one rakah, and on-device pose detection confirms standing, bowing, and sujud. Or scan your prayer mat, or check in at a mosque.
Would you let an app make you prove you prayed?
post-image
After stalling at a high level, price broke below the range, and I began focusing on short opportunities from that point. The rebound lacked strength and fell back below the previous low, so I entered a short position with the stop set above the previous high, taking profits from this downward structure.
The intraday decline was not decisive and went through several rounds of back-and-forth grinding. I took 80% off at the first support level, and continued trailing the remaining 20% with the stop. I exited during the final accelerated drop, and the profit on the single trade was considerable.
post-image
DOGE+0.22%
LAB-2.08%
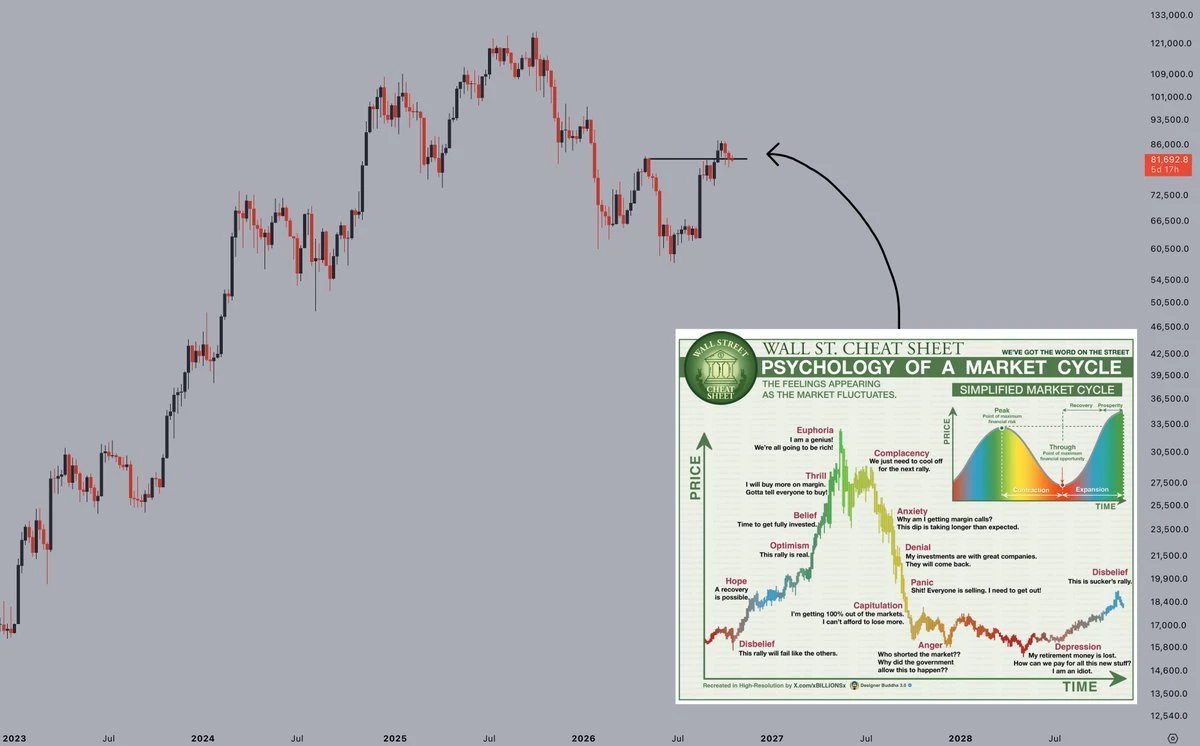
Me: “I used the last of our savings to buy bitcoin at $80,000, I hope you understand.”
My fiancé:
post-image
BTC-0.85%
[New Streamer] Market Prediction
live-cover
LIVE66
With this price action, I don’t even need to think—the account is dancing on its own.
$ICP surged from 2.964 to 3.045, putting +131.7% in the bag. Don’t ask—if you do, the answer is that the market showed me some respect, not that I have three heads and six arms.
During the repeated intraday swings, many people were shaken out, but I stared at that lower shadow for a long time. It kept holding firm on every pullback, and every low-volume drop was caught by buyers. Nobody wanted to dump at this level. So I only said one thing at the time: Hold on, don’t scare yourself out.

I’ve now taken pro
post-image
ICP+14.12%
SNDK+0.35%
ETH-0.60%
Everyone is sleeping on a massive short setup forming right now.

$SKYAI /USDT - SHORT

Trade Plan:
Entry: 0.0560 – 0.0564
SL: 0.0581
TP1: 0.0547
TP2: 0.0538
TP3: 0.0523

Why this setup?
Why now? The daily trend is bearish, which sets the stage for a continuation move lower. The 1h RSI sits at 42.99, signaling bearish momentum without being oversold yet, so the drop is not exhausted. The 1h ATR of 0.000811 shows volatility is expanding just enough to fuel a decisive leg down. The entry zone of 0.0560 to 0.0564 aligns perfectly with the 1h price, offering a precise trigger. The first target
SKYAI-5.92%
Load More

Join 40 M users in our growing community

⚡️ Join 40 M users in the crypto craze discussion

💬 Engage with your favorite top creators

👍 See what interests you

View More