Square
Following
Hot
News
Profile

Cryptorphic

vip
Active for: 3.2y
Peak Tier 0
No content yet
0
Following
165
Followers
531
Liked
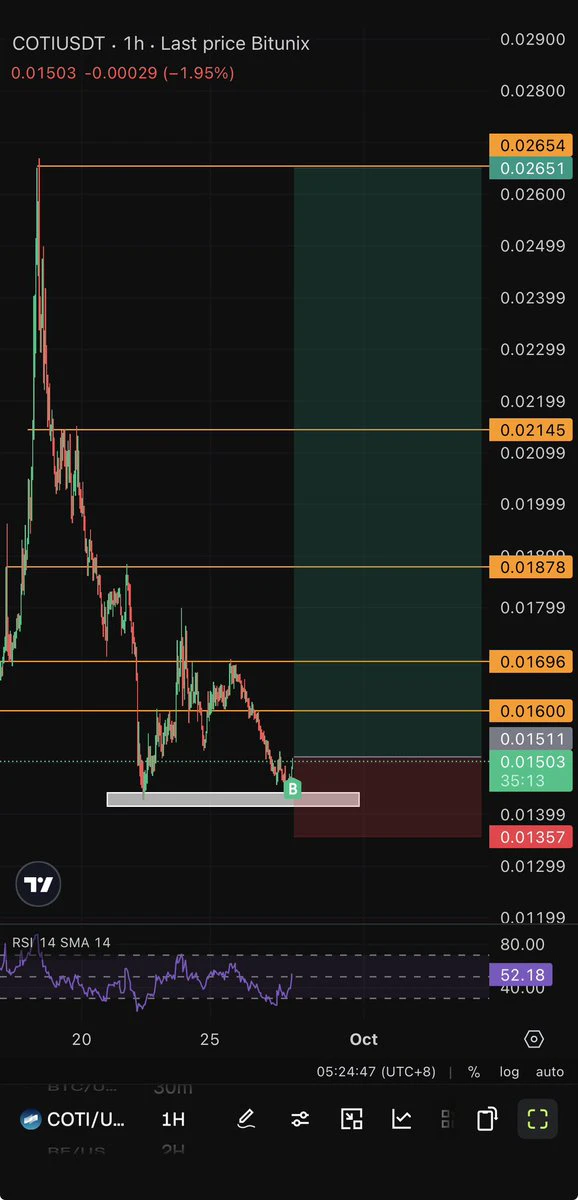
ethereum:0xddb3422497e61e13543bea06989c0789117555c5 : Double bottom forming on the hourly chart.
Even if it only retests the recent high this week, that would still be a ~75% move from CMP. Very lucrative R:R IMO.
DYOR, NFA.
post-image
ETH-0.30%
#Bitcoin is still playing out this bearish divergence warning signal. 🚨
BTC-1.27%
#BTC is still stuck below the upper resistance of this expanding channel.
Until we see a clean breakout and a daily close above this resistance, I’d expect BTC to either move sideways or see another pullback.
For now, some sideways consolidation looks possible as price cools off after the recent move. The key area to watch is this upper trendline a confirmed breakout could change the structure, while another rejection may bring BTC back toward the lower support zones.
For now, patience. Let the price confirm the next move.
BTC-1.27%
After the rejection from the upper resistance, ETH is now holding above this short-term horizontal support.
The recent cooldown looks pretty much as expected, and for now, price is moving sideways above this local support zone around $2,630–$2,650.
Let’s see how this support reacts. If ETH breaks below it, the next important support is around $2,535, which was a previous resistance area.
For now, $2,630–$2,650 is the key level to watch.
#Ethereum
ETH-0.30%
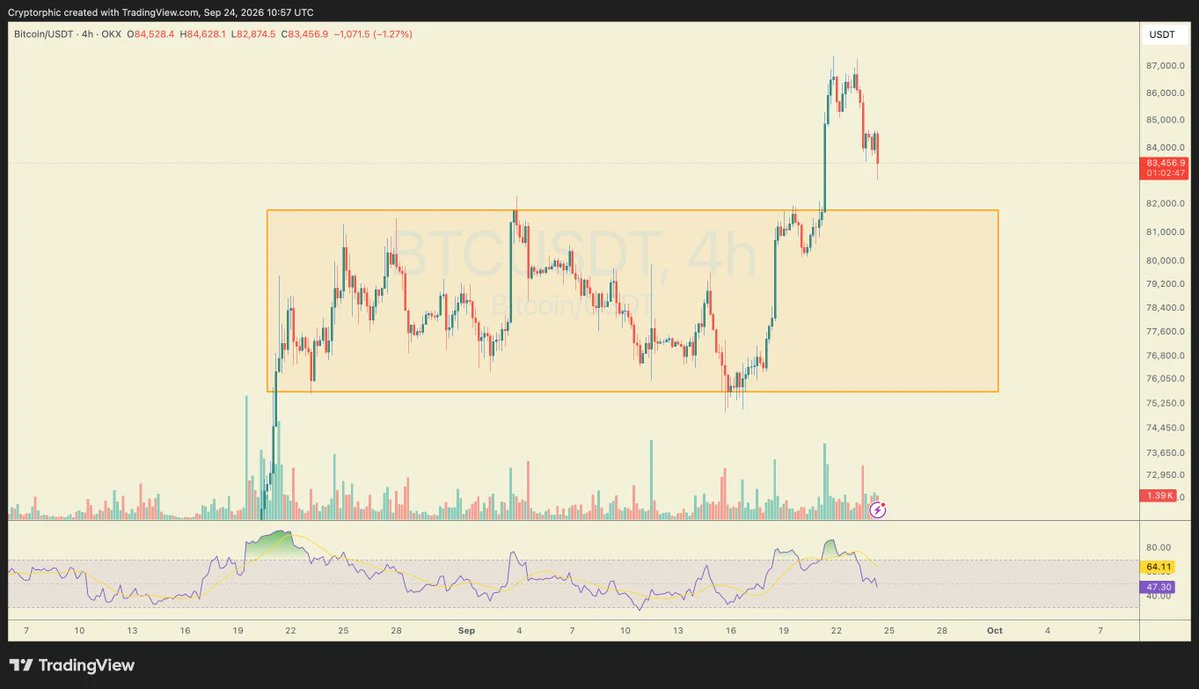
#Bitcoin is currently pulling back after reaching a high of $86.3K on Monday. In my opinion, this looks like a healthy retracement following the recent breakout.
It wouldn’t be surprising to see BTC retest the $80K–$82K zone, where previously broken resistance could now act as support. Breakouts often need time to consolidate, and a pullback alone doesn’t mean the bullish move is over.
The key is how price reacts around that zone. A successful defense would strengthen the bullish case and keep a retest of the recent highs in play.
A sustained move below it would weaken that outlook and raise
post-image
BTC-1.27%
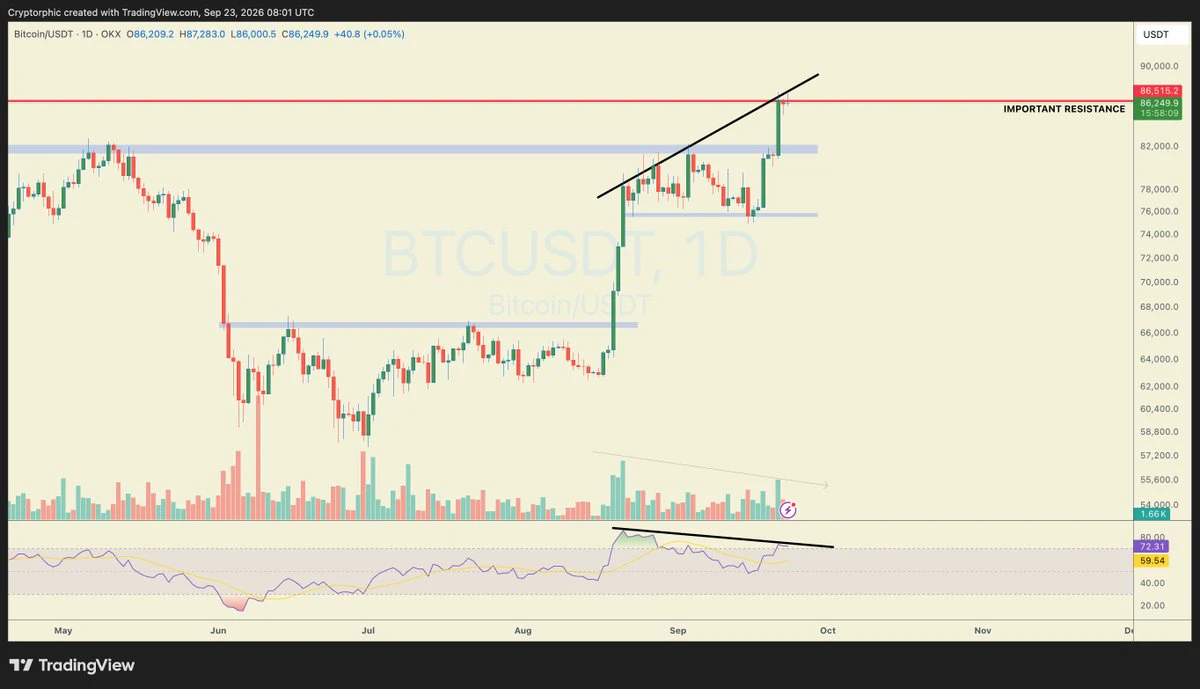
On the daily timeframe, this bearish divergence looks quite interesting. 👀
bitcoin:native is sitting right at an important resistance around $86.5K, while the daily candle is showing some weakness. At the same time, RSI is making a lower high as price pushes higher.
The divergence is not confirmed yet. We could see some sideways movement or a pullback that allows RSI to cool off from the overbought zone.
Until BTC gets a daily close above this key resistance, I wouldn’t ignore the bearish divergence.
Keep an eye on the next daily closes.
post-image
BTC-1.27%
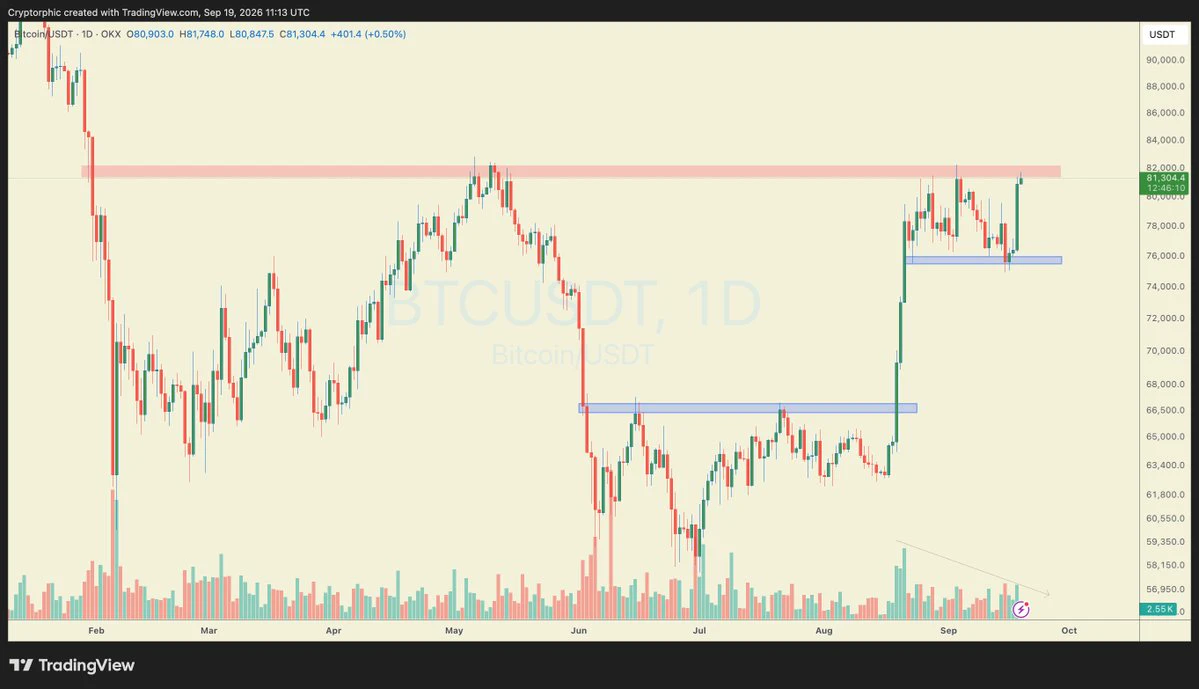
$BTC is back at a major resistance zone.
Price has pushed back above $81K and is now testing the $81K–$82K resistance area, which has rejected BTC multiple times before.
The key here is the daily candle close. A clean close above this zone could confirm a breakout and open the door for further upside. But if BTC gets rejected again, we could see another move back toward the $75.5K–$76K support.
For now, I’m watching this level closely.
The next daily close could be important.
post-image
BTC-1.27%
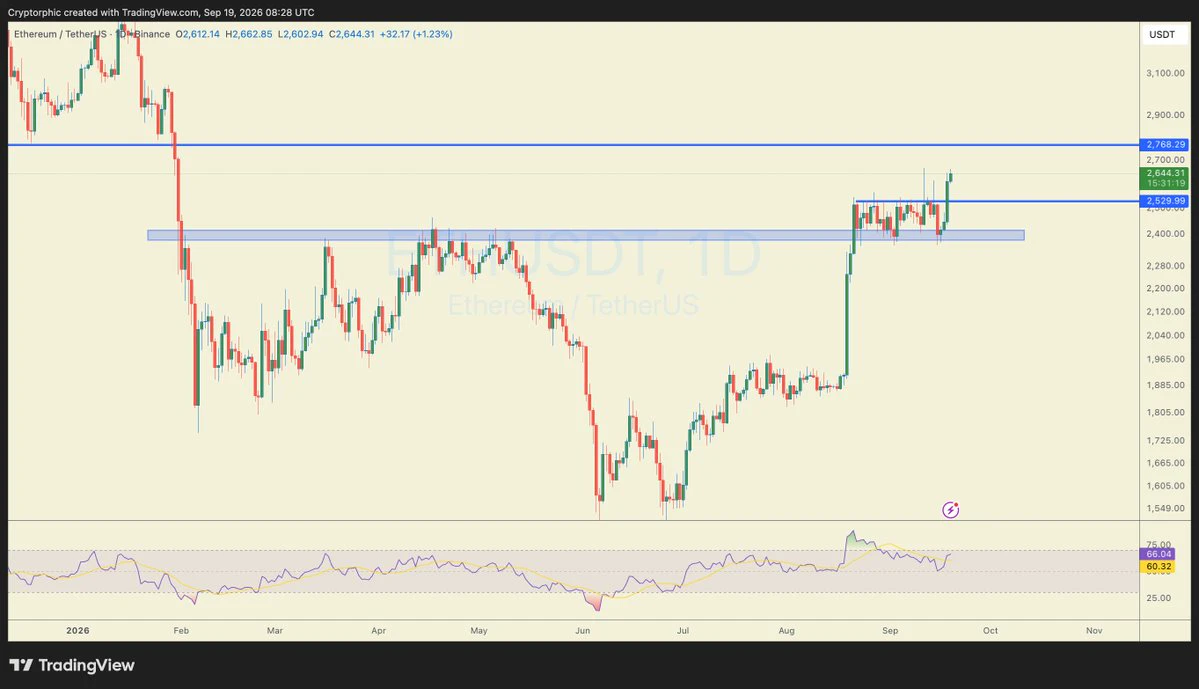
#Ethereum just broke out of its month-long sideways range.
ethereum:native has finally closed a daily candle above the key $2,530 resistance after spending almost a month moving sideways inside this range.
However, I wouldn’t call the breakout fully confirmed yet. We still need another daily candle to close and hold above this area. The market can always surprise, so waiting for confirmation makes sense here.
If ETH holds above $2,530 and the breakout continues, the next major resistance is around $2,768.
For now, the next daily close is the key one to watch.
post-image
ETH-0.30%
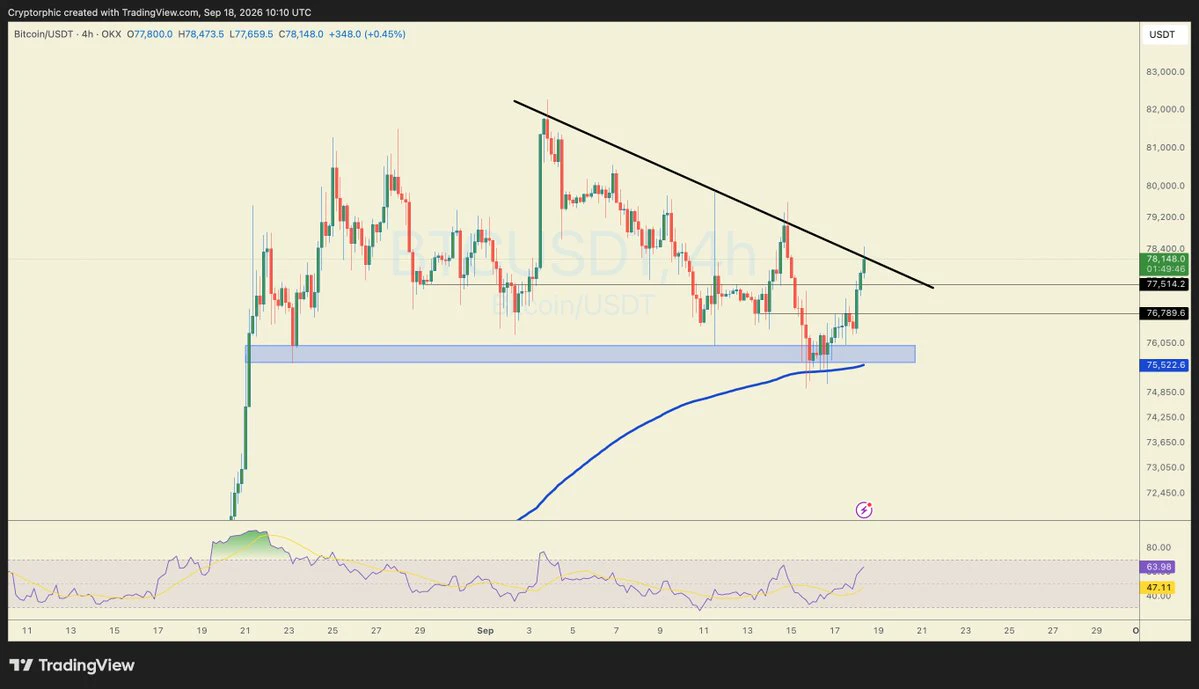
$BTC is back at a key resistance.
Price has bounced strongly from the $75.5K area and is now testing the descending trendline around $78K.
This 4H candle could be important. A strong close above the trendline may open the door for further upside, while rejection could bring another pullback.
Let’s see how this 4H candle closes.
post-image
BTC-1.27%
$BNB is pushing higher and is now testing the descending trendline around $730–$732.
Price has been making higher lows, but this trendline is still acting as resistance. RSI is also near the 63 level, so momentum is strong but not yet deeply overbought.
A clean breakout and hold above the trendline could open the way for another move higher. If rejected, we could see a short-term pullback before the next attempt.
This is an interesting level to watch closely.
#BNB
BNB-1.67%
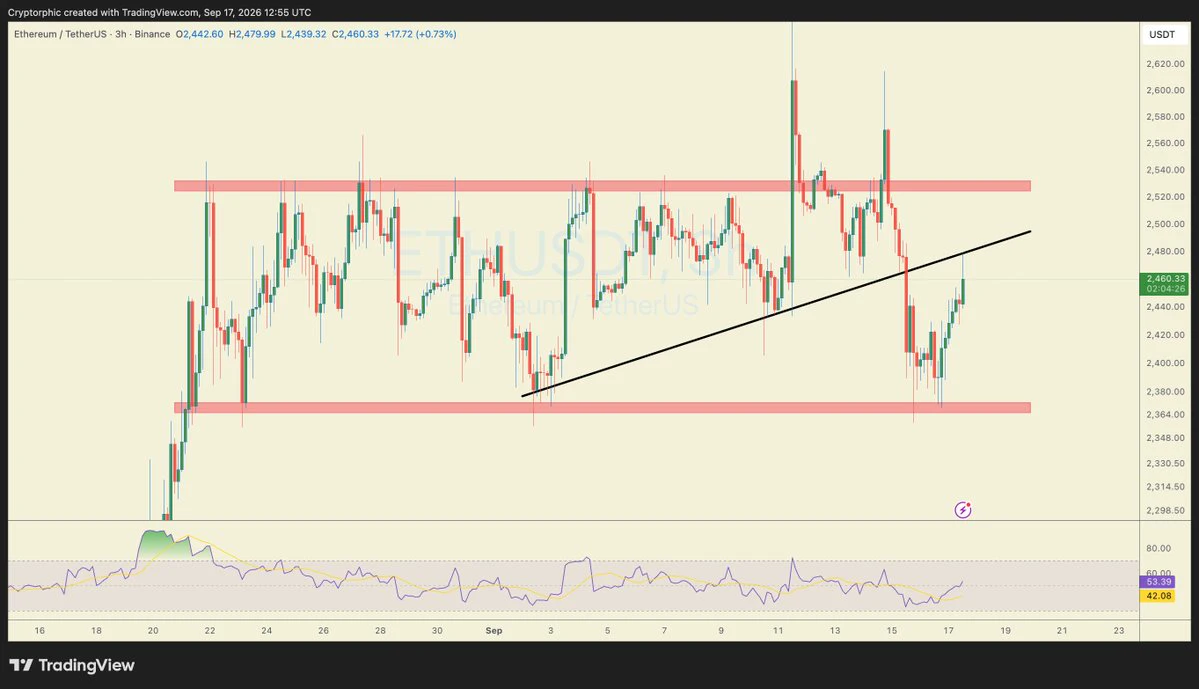
$ETH is bouncing from the key $2,365–$2,380 support zone after the recent drop.
Price is now testing the broken rising trendline around $2,460. Reclaiming it could bring another move toward the $2,520–$2,530 resistance, while rejection here may send ETH back toward support.
For now, the reaction around this trendline is the key thing to watch.
#Ethereum
post-image
ETH-0.30%
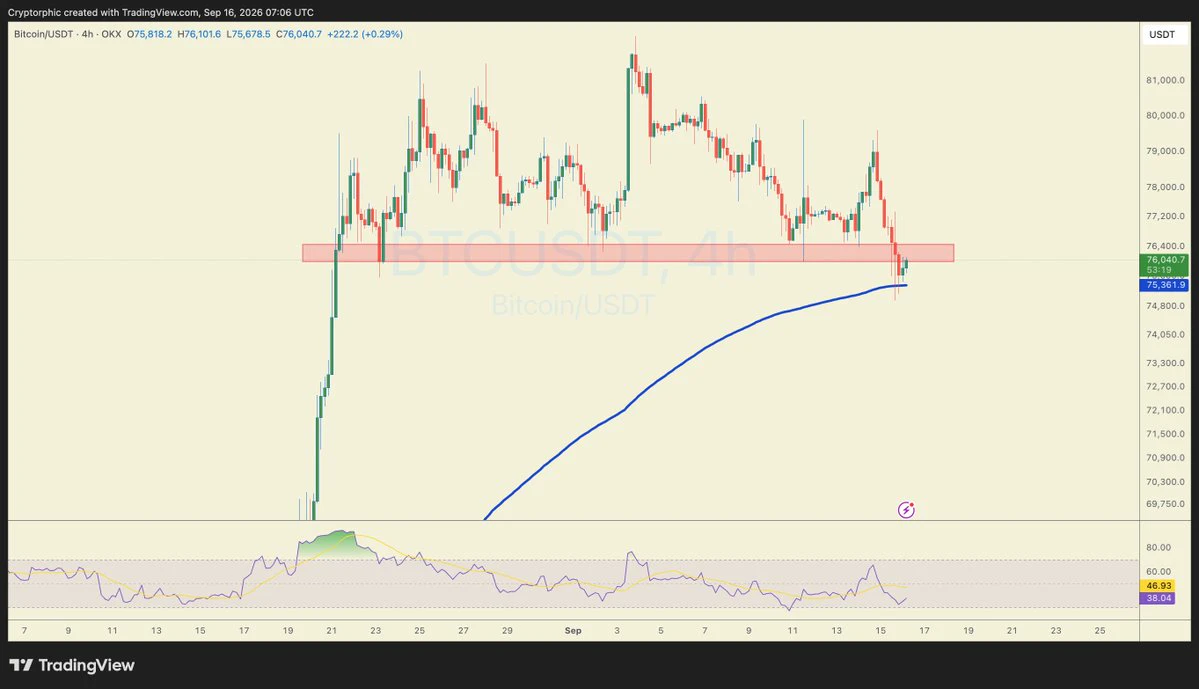
$BTC has lost the short-term horizontal support around $76K–$76.4K, which doesn’t look great.
But we’re still sitting near the 200 EMA, so this is an important area to watch.
The bigger trigger today is the FOMC decision. A rate hike could add more pressure, while no change could bring some relief and a bounce. The Fed’s September 15–16 meeting is scheduled to conclude today.
Expect volatility around the decision. I’d rather wait for the initial move to settle before looking for a clear direction.
Keep an eye on #BTC and the #FOMC. 👀
post-image
BTC-1.27%
Clarity act failed the procedural hurdle in the senate. Bearish for crypto in the short term.
Simply a “No trade zone” for me!
#ETH UPDATE
Price action yesterday and today has been pretty wack very choppy and not giving us much clean direction.
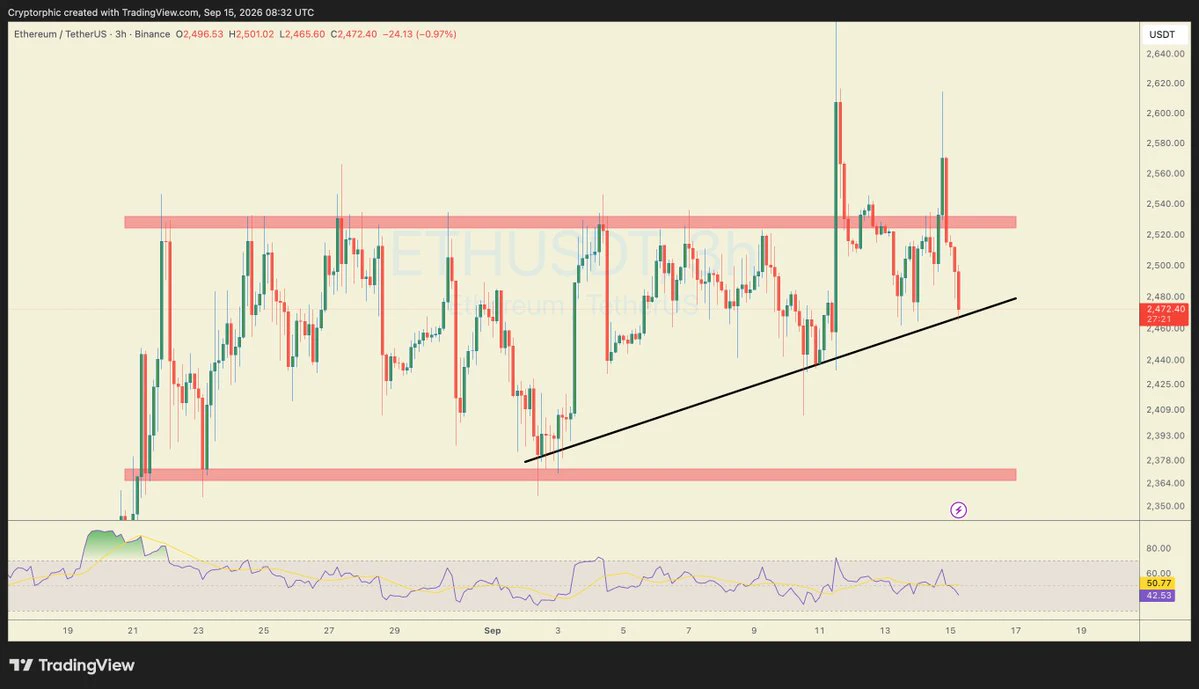
For now, I’m watching this 1H ascending trendline closely. Price is testing it around the $2,480–$2,490 area.
If ETH gets a clean close below this trend, I’ll be looking to short, ideally with confirmation/retest before entering. Until then, I’m staying patient and not forcing a trade.
post-image
ETH-0.30%
🚀 $ARB Breaking Out?
After a healthy pullback right into the 0.618 Fib zone (~$0.1308), ARB just broke above the upper trendline of its falling wedge on the 4H frame.
Key Trigger: Watch for a solid 4H close above $0.1455 (0.5 Fib) for momentum.
Targets: $0.1600 | $0.1780
Invalidation: Losing $0.1300 invalidates the setup.
Looks ready for the next leg if buyers hold the breakout line!
DYOR, NFA
#ARB
ARB-11.49%
$ETH UPDATE
ETH is once again getting rejected around the $2,530 resistance after the recent CPI-driven spike.
Price is struggling to hold above this area, while the 12H RSI continues to form lower highs, showing weakening momentum.
For now, I’m watching $2,530 closely. Until ETH can hold above this resistance, the rejection and cooling-off setup remains valid.
The weekly candle is about to close. Let’s see how it closes, we may get some confirmation from the weekly close.
#Ethereum
ETH-0.30%
#LINK is facing a strong rejection after reaching the $13.68–$14.07 area.
Price has now dropped back below the important $11.7–$12.1 resistance zone, which is a key area to watch. As long as LINK stays below this zone, the next levels on my radar are around $11.13 and $10.34, based on the Fibonacci retracement.
RSI has also cooled after the recent push, so I’d be watching how price reacts around these levels before expecting the next major move.
For now, $11.7–$12.1 remains the key resistance.
post-image