



Square
Following
Hot
News
Profile
Share your thoughts
placeholder
Article
Live trading - Analysis new crypto coin
live-cover
LIVE19
#ASMLTSMCQ3EarningsSoon
Both semiconductor giants represent critical bottlenecks in the modern AI and advanced chip supply chains; however, TSMC holds a fundamentally stronger position and offers a more distinct catalyst for near-term earnings.
Following ASML's earnings release and ahead of TSMC's upcoming earnings call, here is a comparison of the two companies' profiles:
1.ASML
ASML announced its third-quarter earnings on October 14, setting a new benchmark for lithography equipment demand.
Q3 Results and Highlights
* Earnings Beat: Earnings per share came in at $14.65 (market expectation
post-image
TSM-1.82%
ASML+0.52%
AMD-1.47%
NVDA-1.92%
AAPL-0.31%
🔹Whale Dumps BTC and Loads Up on ETH! After selling 237.8 BTC and buying 7,929 ETH, is big money be
live-cover
LIVE640
2026 Topps Update has been out for ONE DAY and people have already found two major player identification errors.
1) Kevin McGonigle’s Black Gold rookie insert features Jace Jung photo instead of McGonigle.
2) The Detroit Duo card appears to feature the wrong player labeled as Gleyber Torres.
How does @Topps let something like this get through quality control?
Which step is the easiest to be fooled by in this $PYTH rally?
When I looked at $PYTH again, I first covered up the 24-hour +13.69%. It’s not that this figure is unimportant, but it is too good at grabbing attention. What really needs explaining right now is that after $PYTH’s sharp 24-hour surge, momentum and continuation are not the same thing. I won’t extrapolate the large move that has already happened into the next leg; I’ll first see whether the price can hold in the new range.
Laying out the market, the current price is 0.09408, with a 24-hour range of 0.08063–0.10094. The 1-hour suppo
post-image
PYTH+11.73%
BREAKING: Centrifuge tokenizes New York Life Investment Management's actively managed U.S. high-yield corporate bond strategy as $HYB on Stellar.
Allowing the freely transferable $deHYB token to serve as collateral across lending and fixed-rate markets in DeFi.
@StellarOrg
CFG-4.38%
XLM+0.49%
$AAOI
The correction continues. If the index hadn’t made a liquidity sweep, the other path would have remained valid. Today, it pulled back to the monthly EMA21-$74. On the other hand, it has also dipped as far as the support band during previous corrections. I normally use the support band as my reference for trends anyway.
I still think it’s forming a handle here. There’s no topping structure like the one at the 2017 peak
post-image
AAOI-2.87%
INDEX-4.47%
Does a bullish moving-average alignment always mean you should chase long positions?
Not necessarily. The key is whether the price’s position relative to the moving averages is synchronized with momentum. Take $ZEC as an example: the current price is 1235.97, with MA5=1225.24 above MA20=1138.62, forming a standard bullish alignment and indicating a healthy trend direction; however, RSI has reached 70.2, nearing overbought territory, while the price is hugging the Bollinger upper band at 1248.36, making the risk-reward of chasing short-term highs unattractive. A reusable approach is: use movin
post-image
ZEC+7.81%
XPL+8.96%
INJ+11.40%
$CRV Current price is 0.3598, with the upper Bollinger Band at 0.3671 serving as the first resistance level; MA5 at 0.3590 and MA20 at 0.3435 form the short-term support zone. Up over 10% in 24h, the price is now tracking along the upper Bollinger Band, while RSI at 67.1 is nearing the overbought zone. The MACD histogram at +0.002132 remains bullish, but the funding rate at +0.0100% indicates that longs are paying to hold positions, with leveraged long overcrowding increasing and the risk of wick-driven liquidations accumulating accordingly. Trading volume is only 8.4M USDT, so liquidity is n
post-image
CRV+10.77%
BAT+25.54%
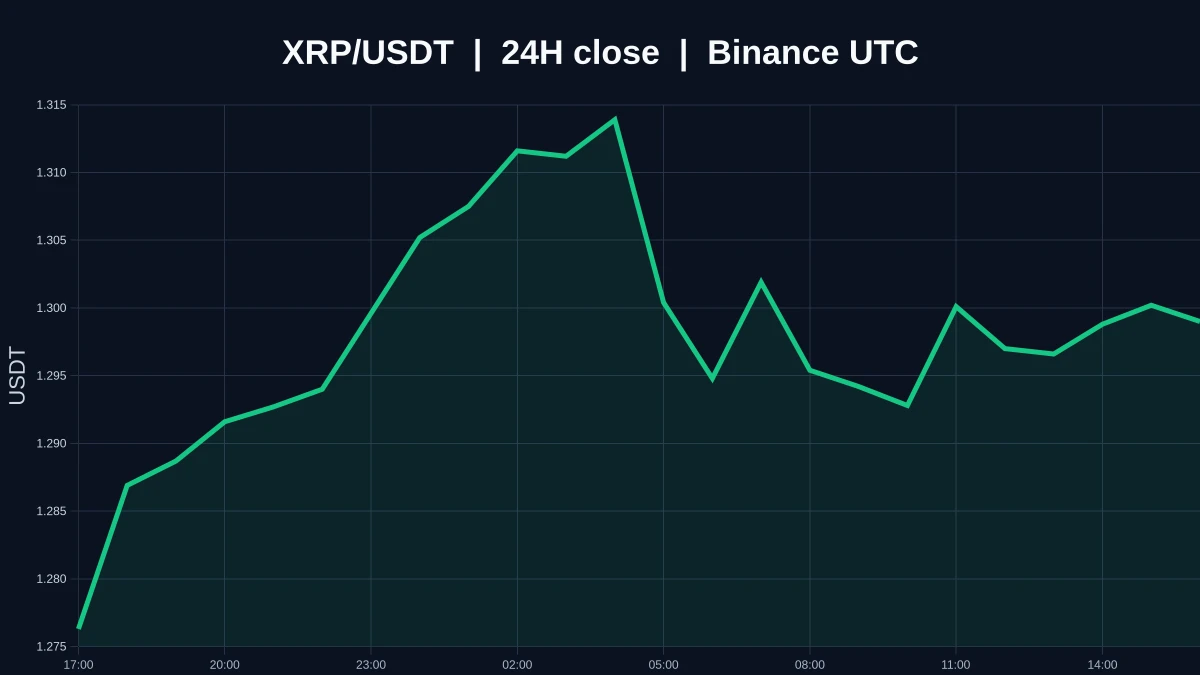
XRP+1.33%
$ETH Hits Targets! 💥🎯
post-image
ETH+1.62%
In 2006, bored out of my mind, I went online for the first time and casually bought 1,000 Bitcoin.
Back then, Bitcoin was worth jack shit, so I just treated it like in-game currency.
post-image
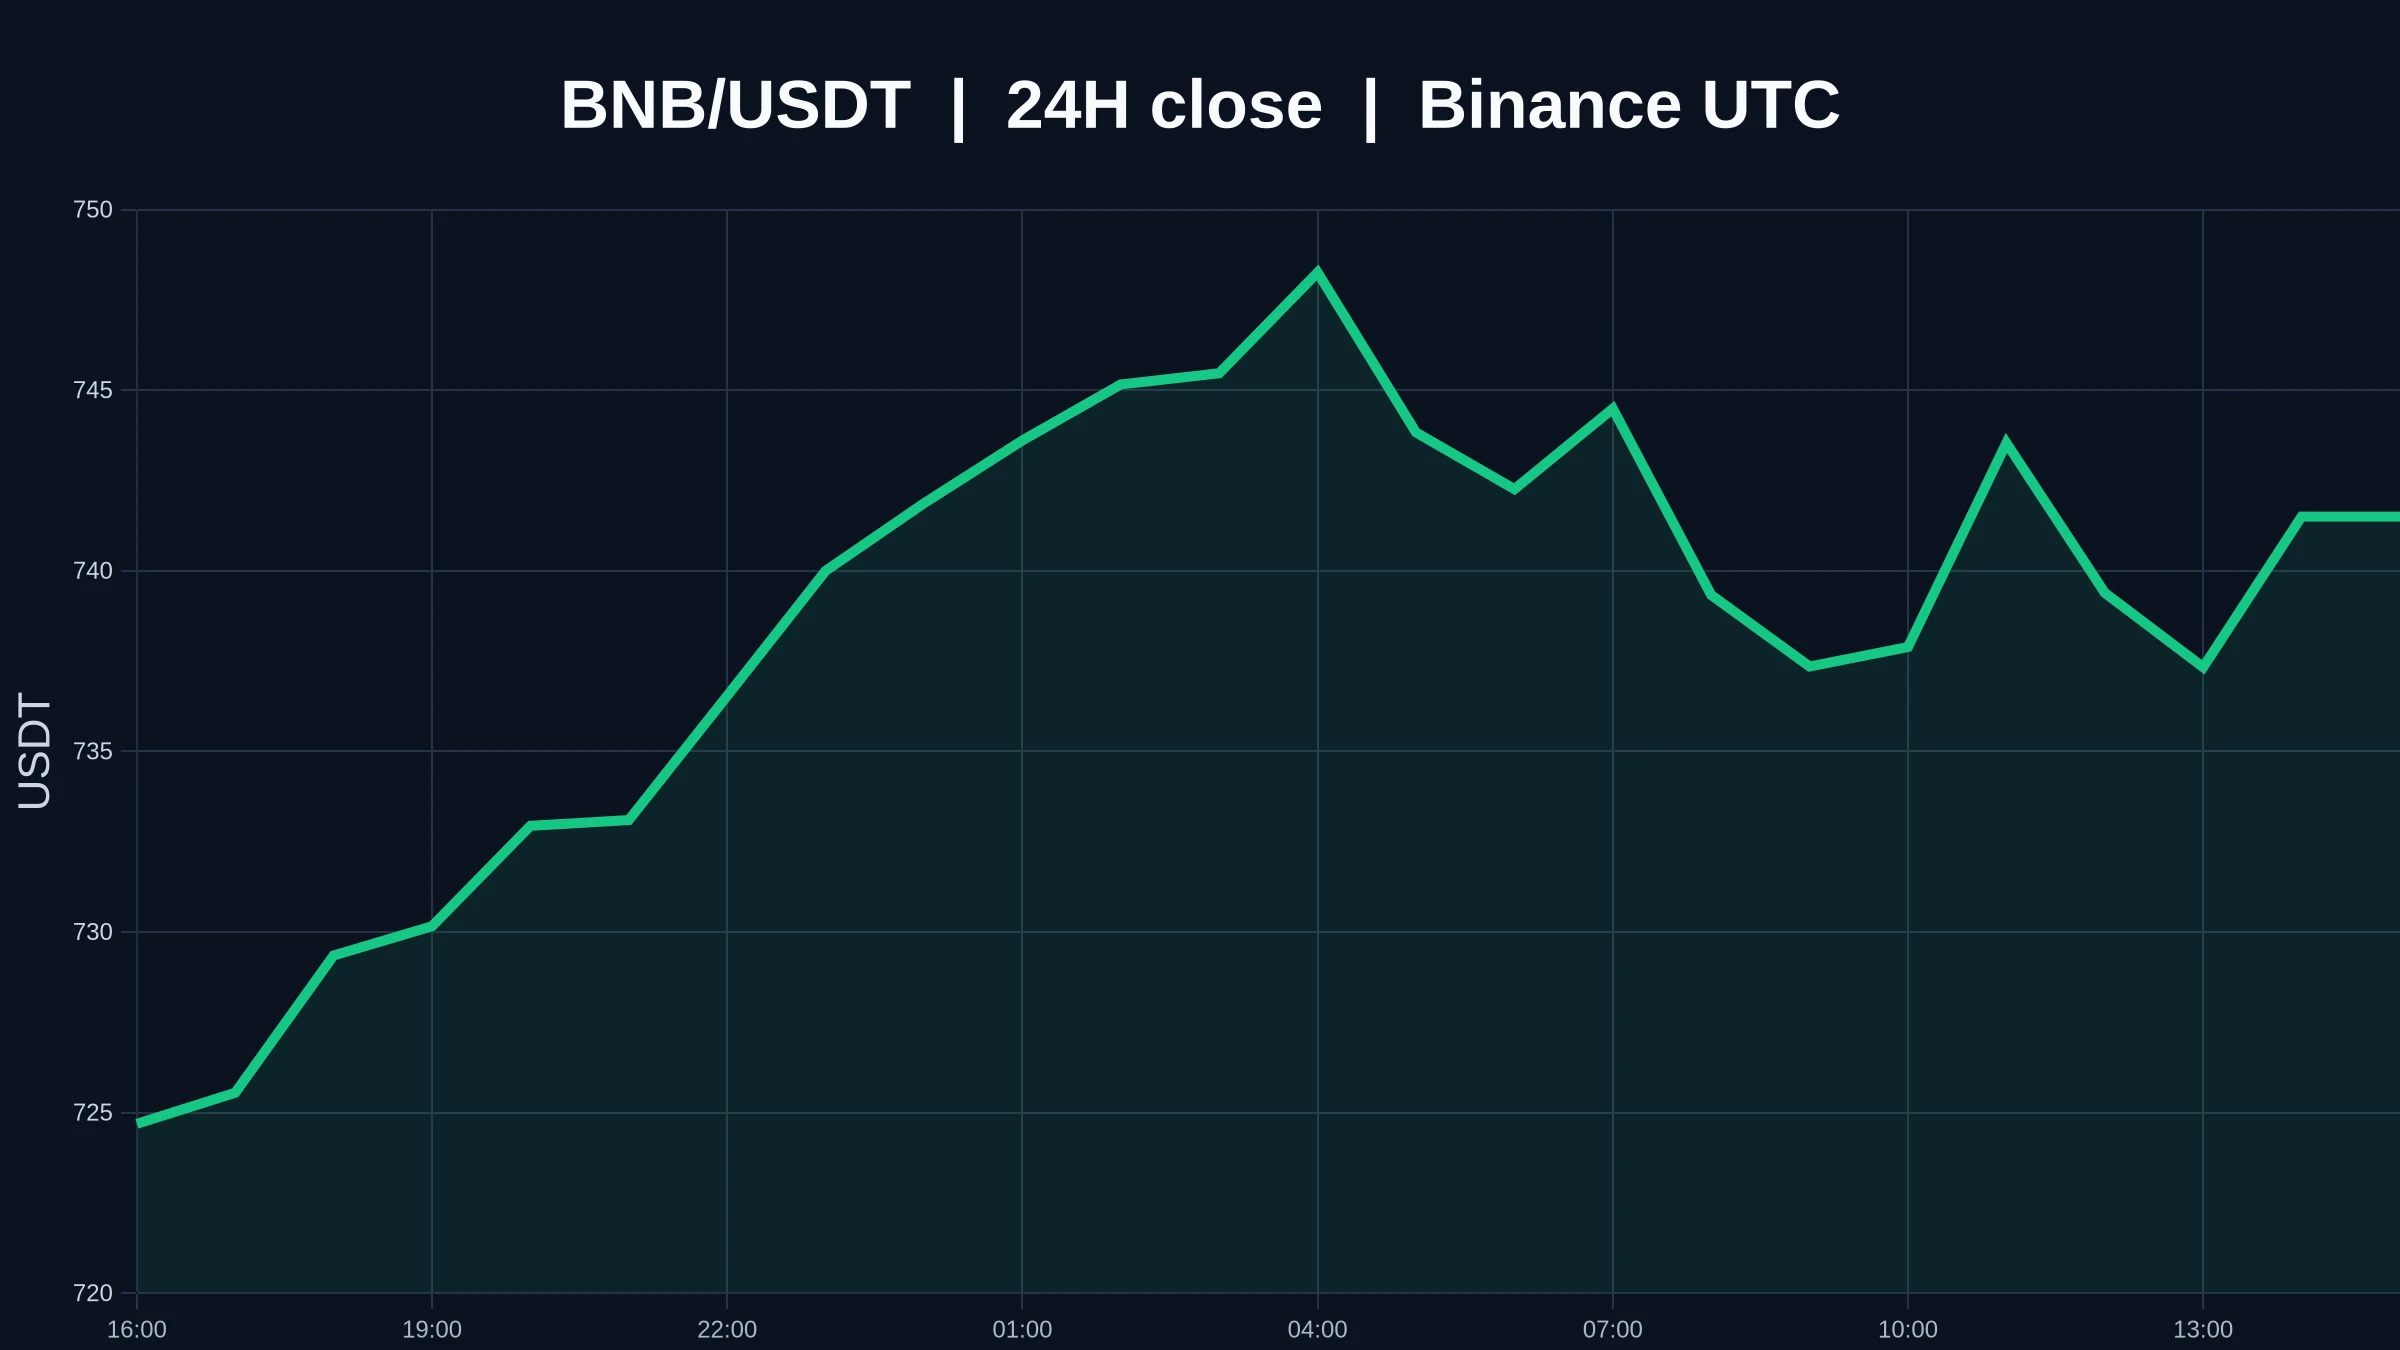
BTC+0.60%
$US Bought spot at a low yesterday, went long and bought the dip, winning across the board. As long as you hold, just wait for the pump to sell
US-4.31%
BTC is currently around 82400; after the previous pullback, it has staged a short-term corrective rebound, but the upside follow-through is weak. This is a technical recovery after the decline, with no trend reversal signal appearing for now. The broader structure remains range-bound with a bearish bias.

On the 4-hour chart, the price is below the moving averages, and rebound volume is insufficient, indicating a weak consolidative recovery. The overhead resistance zone is substantial. As long as the price fails to firmly hold above resistance, this rebound is more likely to be a continuation
post-image
BTC+0.59%
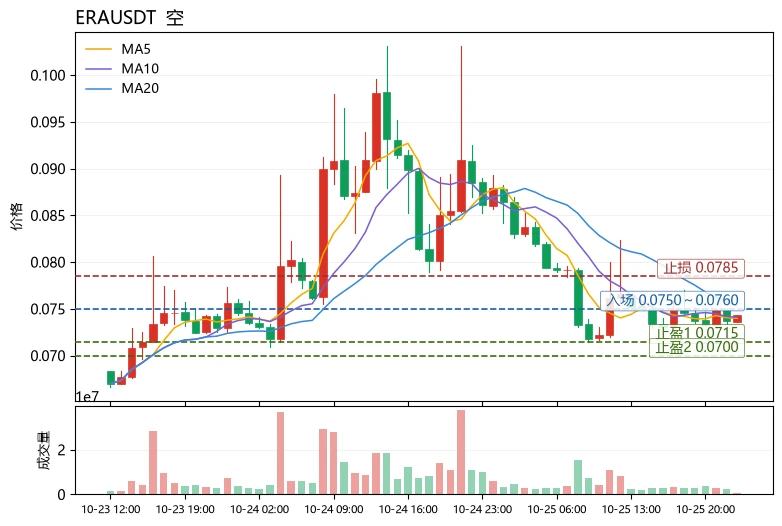
Everyone watching SYMBOL long is about to get blindsided by a sharp drop.

$MU /USDT - SHORT

Trade Plan:
Entry: 927.98 – 934.84
SL: 964.38
TP1: 906.68
TP2: 890.19
TP3: 865.47

Why this setup?


Debate:
Are we testing TP2 or is 994.50 about to flip this setup?

⚠️ Personal market analysis only. NFA — manage risk and DYOR.
Educational content, not investment advice or a recommendation to buy, sell, deposit, or withdraw any asset. No paid promotion or referral/affiliate links.
MU+2.37%
Everyone, listen‼️ Quickly open a second long position on $ETH
now.entry: $2,451 – $2,455targets: $2,465 / $2,480 / $2,500sl: $2,418
post-image
ETH+1.40%
$DOGE About To Make Some Gains!?
Just locked into a long on $DOGE!
NFA, DYOR ⚠️
#Crypto #Trading #DOGE
post-image
DOGE-0.57%
$JASMY coin looks like it is back to pumping vibes.
The recent drop now looks like it was just a backtest of the main support zone, From here a quick 5 wave structure looks like the trajectory in the short term.
JASMY+2.52%
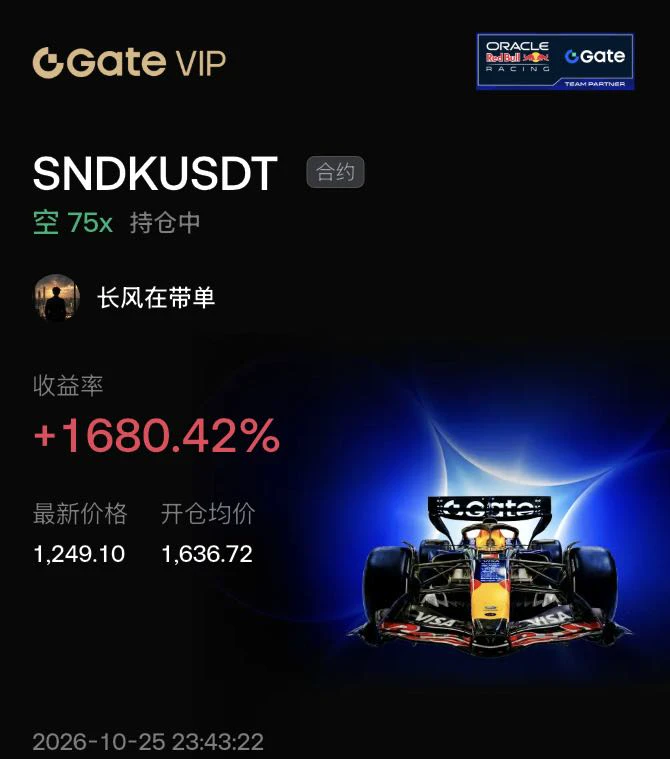
$SNDK
Key levels respected; bounced from the $1,279.29/share support zone
I will only pick this at $995.69/share, or I leave it
#NFA
SNDK-0.56%
$SKY
SKY and LUNA look like they were cut from the same mold. Once the flywheel starts turning, SDEV follows, and they rise like dancing twins💃. But as soon as the wind shifts, the two immediately drag each other down, falling like conjoined twins. History has a way of delivering a sudden roundhouse kick when things are at their most euphoric; only after the bubble bursts do people slap their thighs and shout, “So that’s what happened”😅.
post-image
SKY+0.78%
Load More

Join 40 M users in our growing community

⚡️ Join 40 M users in the crypto craze discussion

💬 Engage with your favorite top creators

👍 See what interests you

Trending Topics

USSeptemberPPIBeatsExpectations

91.35k Views1.88k Discussing

US September PPI came in at 6.3% YoY, well above the 5.3% market expectation, pointing to renewed producer-side inflation pressure. Weekly jobless claims were 199K, broadly in line with forecasts. Could hotter inflation further reduce room for rate cuts, and what does it mean for $BTC, US stocks, and gold?

DrLinHanSpeaksAtOxfordUnion

135.63k Views1.86k Discussing

JapanAndKoreaStocksPlunge

47.27k Views1.76k Discussing

View More