Square
Following
Hot
News
Notifications
Profile
Share your thoughts
placeholder
Article
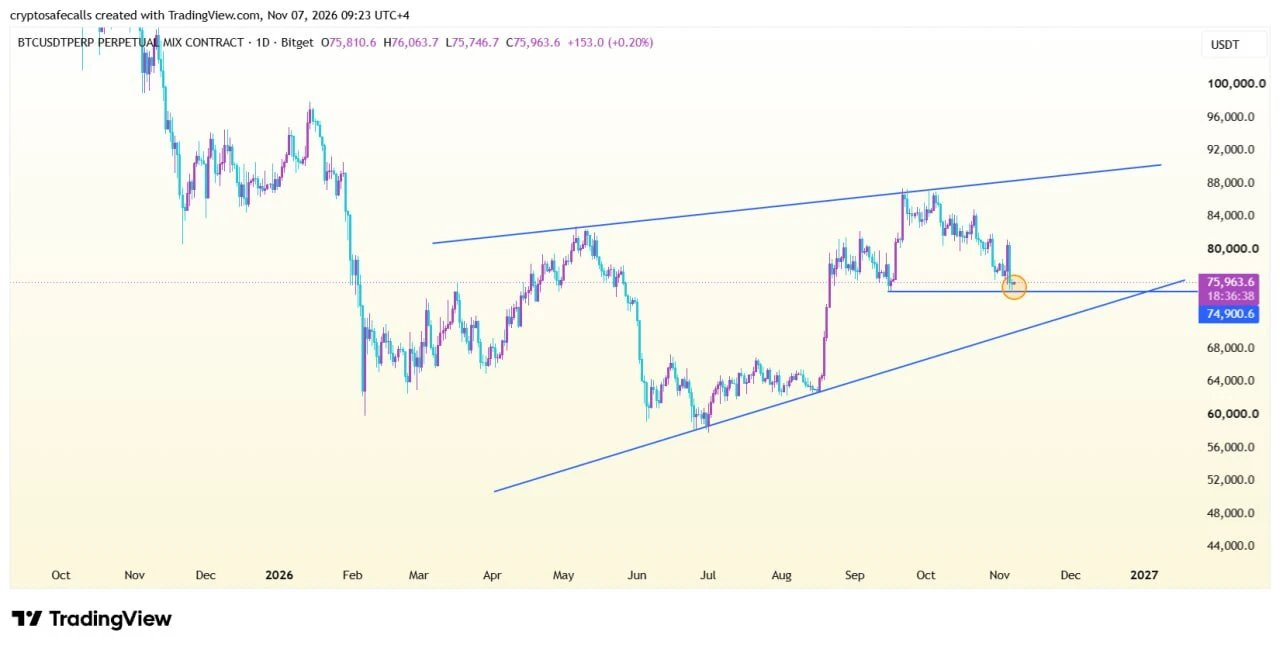
💰$BTC /USDT | 1D Update 🕯

BTC is holding just above $74.9K. A daily close below could trigger a major dump toward the lower trendline support.📉

📌 Wait for daily close confirmation!

$ONE $ZEC $IDOL $AKE #ShareWeekly #AITechSelloffPutsCryptoUnderPressure
post-image
BTC-0.65%
ONE-1.38%
ZEC+1.29%
IDOL-7.01%
AKE+6.39%
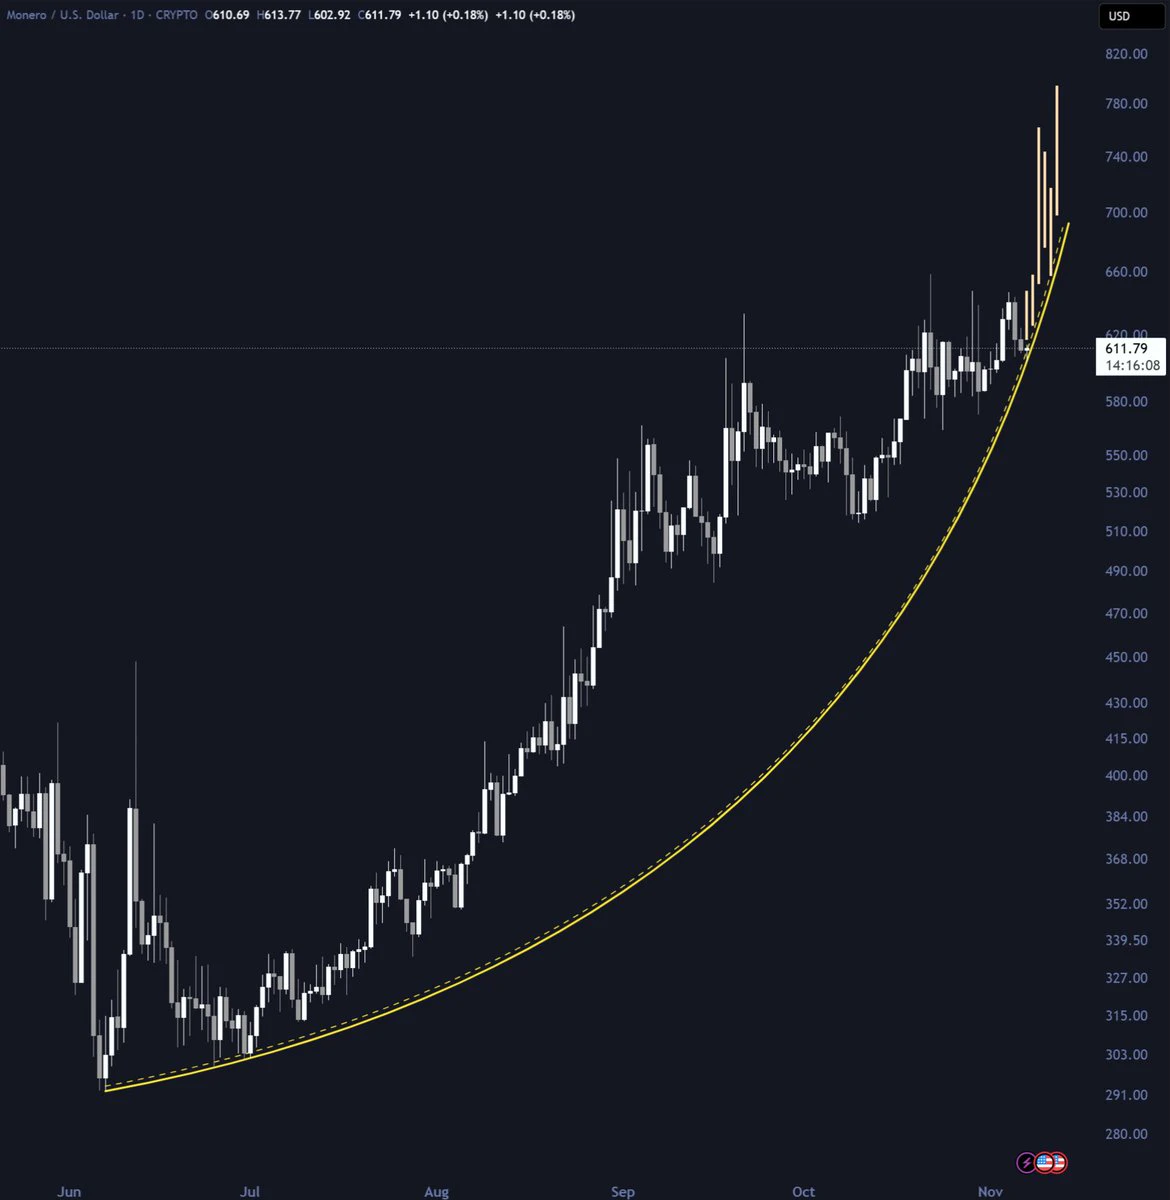
$XMR doesn't care about what's happening in global markets
Insane Strength
post-image
XMR+0.00%
Trenches
ZIG
Z
bade
b
ZIG
0x8c...1145
Market Cap
$.
Change
.
24h Vol
$.
Holders
.
BTC
B
bade
b
BTC
C5xp...pump
Market Cap
$.
Change
.
24h Vol
$.
Holders
.
Diamond
D
bade
b
Diamond
5VCE...pump
Market Cap
$.
Change
.
24h Vol
$.
Holders
.
DOGE
D
bade
b
DOGE
DoGE...fm7R
Market Cap
$.
Change
.
24h Vol
$.
Holders
.
STONK
S
bade
b
STONK
6GmA...UNgx
Market Cap
$.
Change
.
24h Vol
$.
Holders
.
Short-term and long-term views on gold
Gold is currently in a short-term downtrend. I personally think that the area around 3900 is not the bottom, and the short-term bottom should be around 3500. For spot trading, you can buy in batches below 4000.
Let me reiterate the logic behind my long-term bullish view on gold. Gold possesses long-term investment value, primarily based on two points:
First, the US debt continues to expand, and fiscal pressure is increasing, so the need for monetary easing and liquidity expansion may persist for a long time.
Second, breakthroughs in AI technology are expe
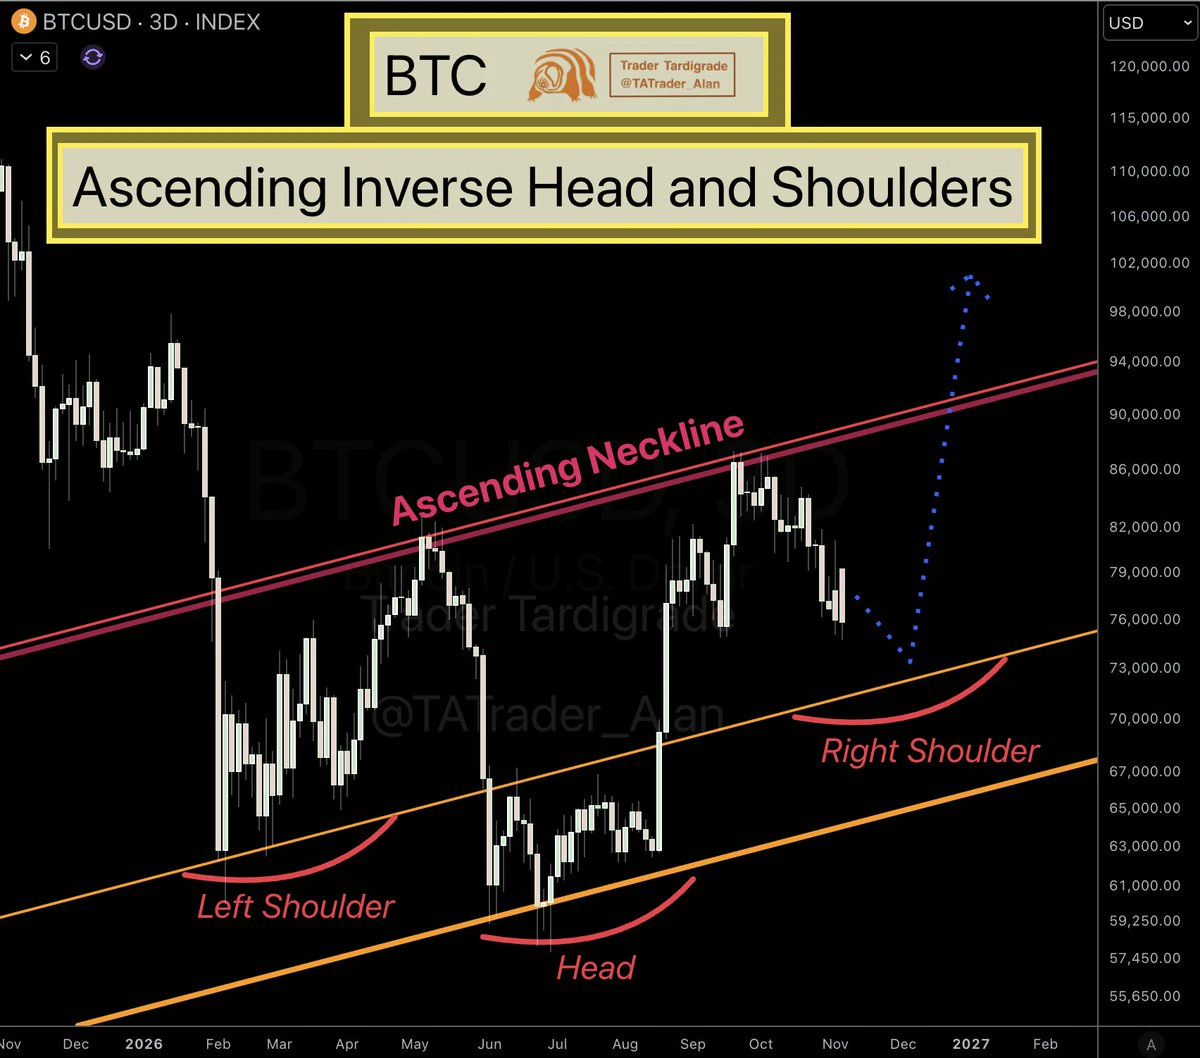
$BTC appears to be forming an Ascending Inverse Head and Shoulders.
🚨 Note: the development of the Right Shoulder is still ongoing. The low could come down near $73k, around the upper orange line.
✍️ An Ascending Inverse Head and Shoulders is a variation of the classic Inverse Head and Shoulders pattern in technical analysis. It is a bullish reversal signal that typically appears at the end of a downtrend and suggests the market may shift from bearish to bullish.
post-image
BTC-0.67%
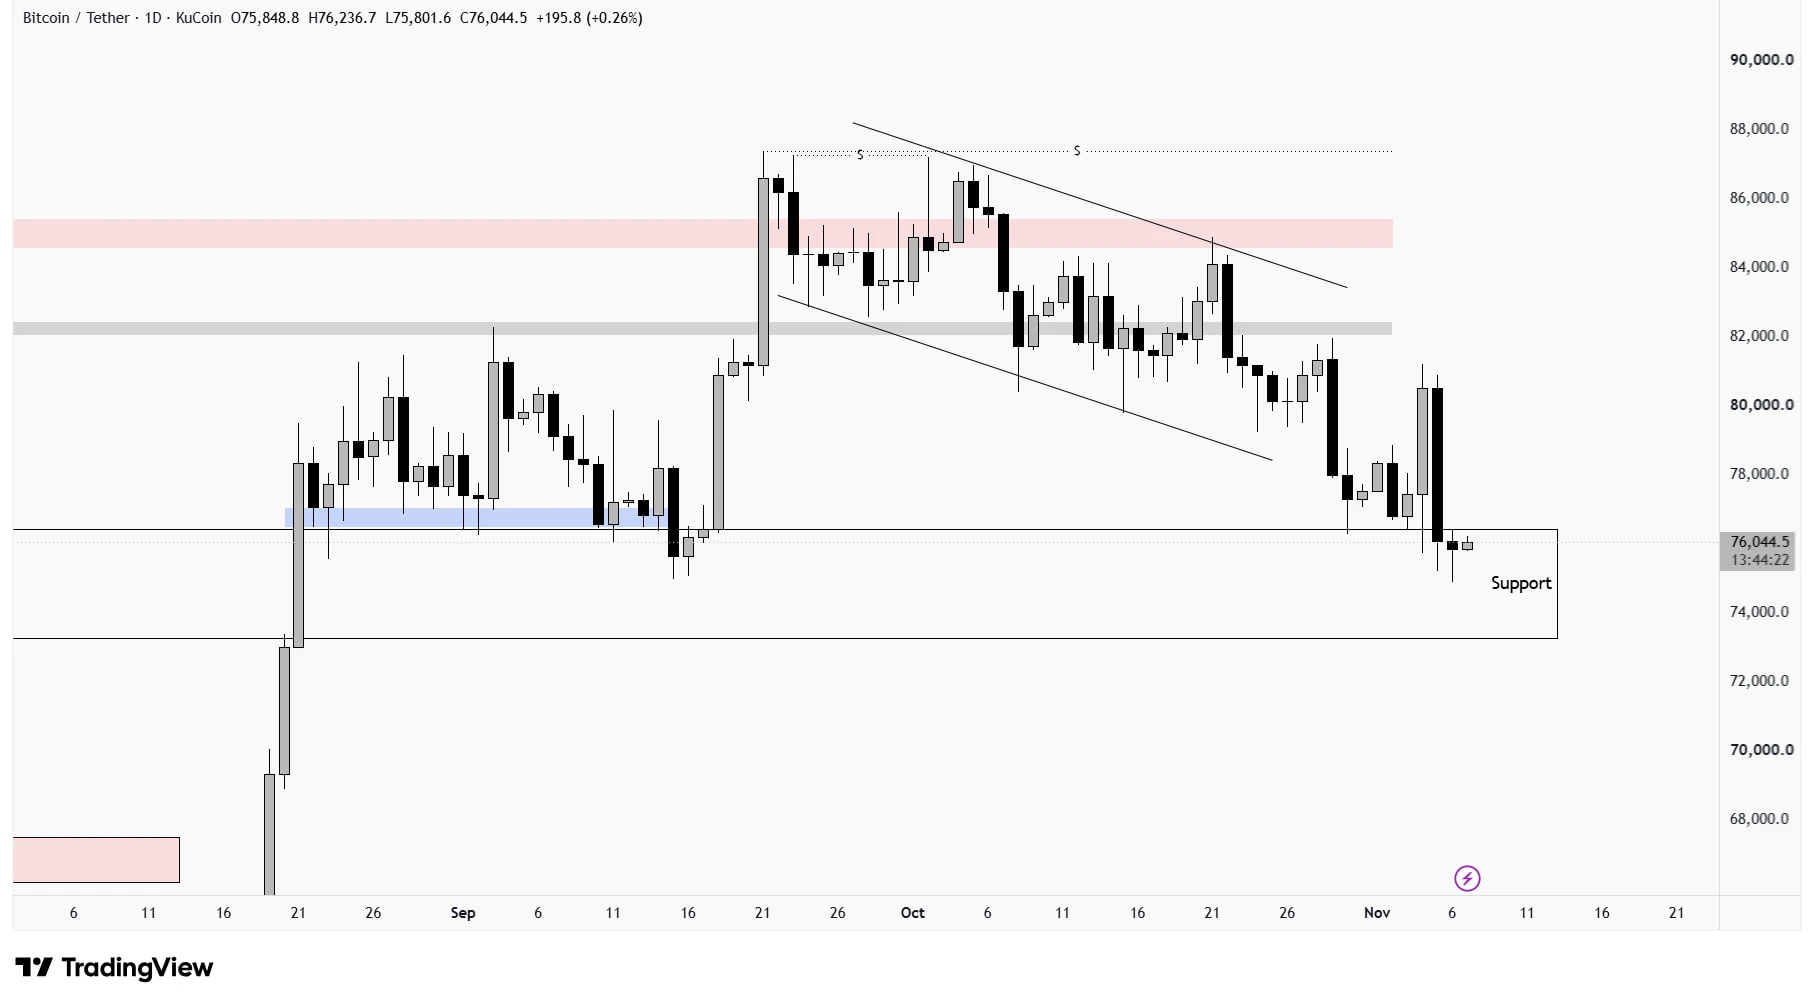
$BTC is testing a critical support zone once again, but the price action is becoming increasingly bearish.

Despite multiple bounces, Bitcoin is struggling to build strong bullish momentum. Sellers are still putting pressure on the market, and the ongoing sideways structure looks vulnerable.

A clean breakdown below support could trigger another major downside move, while bulls need a strong recovery to change the picture.

The next move could be decisive. Watch this level closely.
post-image
BTC-0.67%
“Smart Money Blogger Weekly Review” Episode 15 · Gold Strategy: All 20 Trades Entered, Uniform Stop-Losses, Steady as Clockwork

Keep losing money on your own trades? It’s not because you aren’t trying hard enough—you just need a reliable reference. Every week, we review well-known influencers across the internet, letting real results and data speak for themselves.

This guy posted 20 gold signals in half a month, and every single one could be entered. His trade setups are the most complete: entry range, two targets, and a stop-loss, all provided at once, with nothing left vague. The ranges ar
XAU+0.38%
🪙 NEW PREDICTION MARKET: Will Bitcoin dip below $75,000 in November?
The below-$75,000 outcome led at 87% in the Nov. 7 snapshot. Separate upside and downside contracts can both resolve Yes.
post-image
BTC-0.65%
【OpenSky · Daily Exploration Day 31】
OpenSky's exploration coordinates for today: “Keep pace, don't lose your place”
The most regrettable thing isn't missing the moment—it's when an opportunity comes along and you're no longer at the table.
The OpenSky 2.0 upgrade is accelerating, social app beta testing is speeding up, and the Safe4.0 ecosystem matrix is set to unleash its full force—the gears are beginning to mesh at high speed, and the foundation is being rolled out across the board. This isn't a breakthrough in just one area; it's the resonance of the entire network.
🔹 2.0 is a comprehens
post-image
$NESS It can't go up much higher anymore... the difference is enormous... a total loss... finally sold at auction😭😭😭
post-image
NESS+1.99%
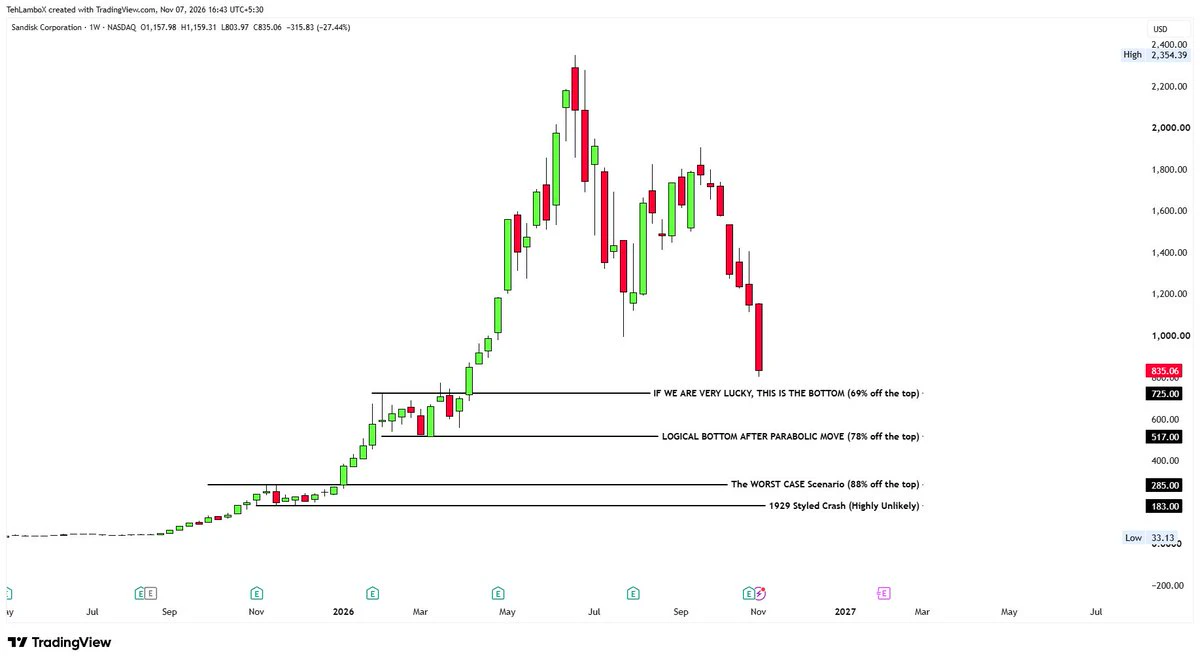
$SNDK Potential bottoms.
post-image
SNDK+3.53%
Is my husband just that skilled, or is technology getting better?🙈
post-image
#美股AI板块遭遇重挫

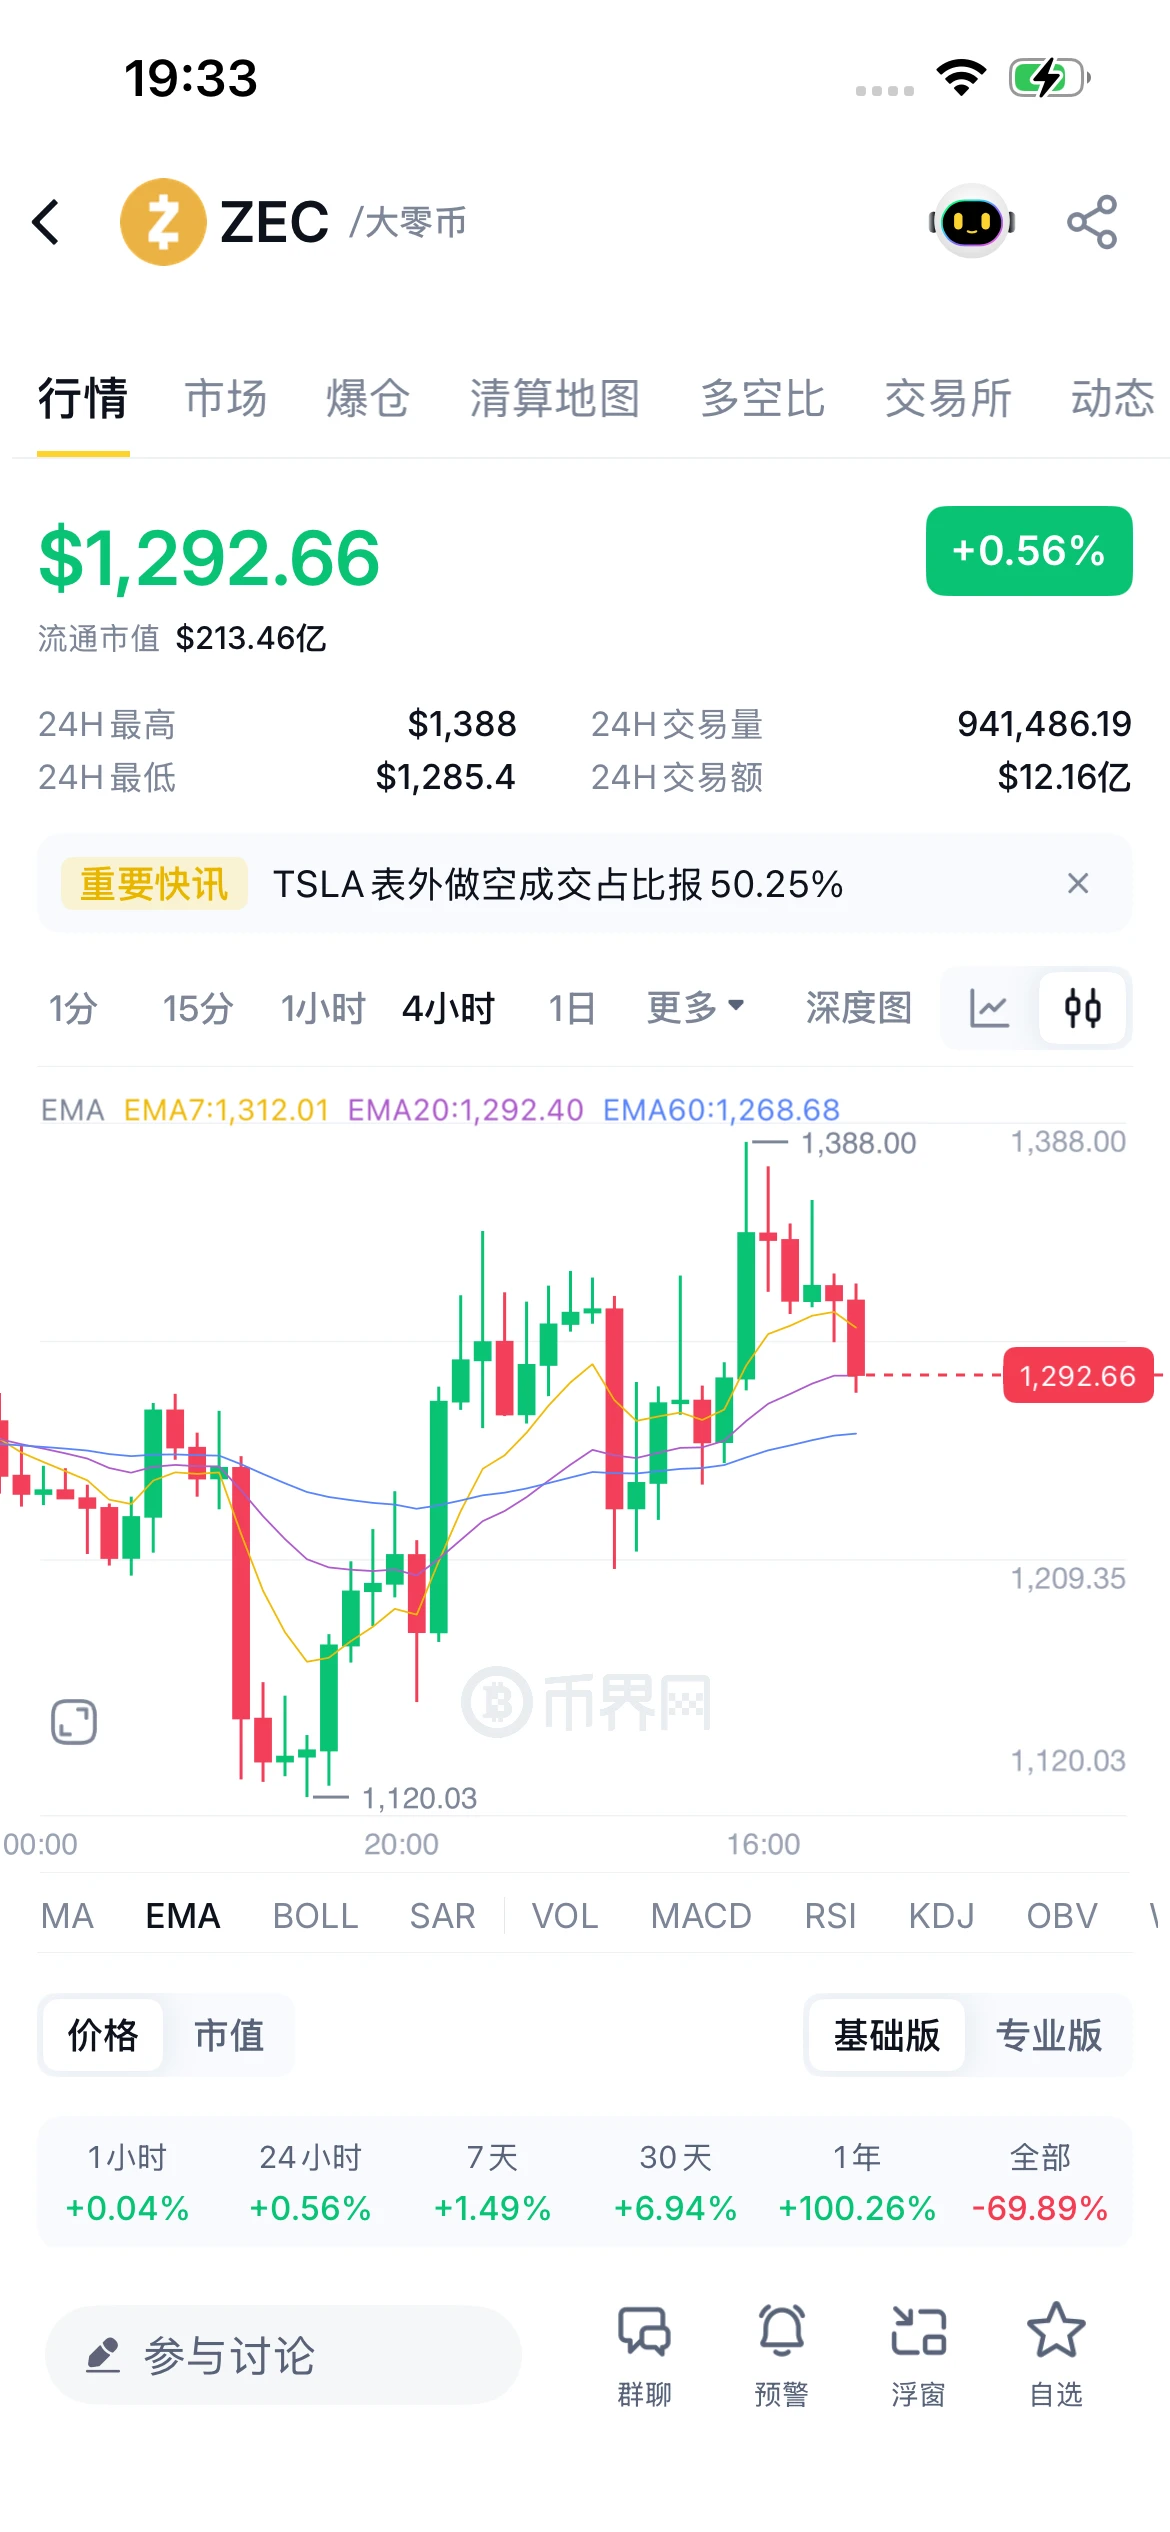
ZEC spikes higher, then pulls back to the moving average; bullish structure remains intact

Now at 1,292.66 (+0.56%), after a moderate pullback from its spike to 1,388. The 4H EMA20 (1,292.40) and EMA60 (1,268.68) are still diverging upward, and the price is right on the EMA20—a strong pullback to consolidate. As long as it holds, the bullish structure remains intact.

Outlook: If it holds → stabilizing at the EMA20 could trigger a direct rebound to 1,312; a break above 1,340 puts a new high at 1,388 in sight. If it breaks down → first test 1,250, then a V-shaped rebound. The tre
post-image
ZEC+1.29%
#Share My Holding Returns# Unstable weekend; we could keep rising or keep sinking—it will depend on Trump!!!
post-image
Who says creators can only rely on talent? Annual honors also need fans’ support!

What does a creator’s daily life look like?
Creating content, livestreaming, chasing hot topics, coming up with ideas, and occasionally playing hide-and-seek with inspiration.

What does a fan’s daily life look like?
Liking, commenting, saving, sharing—and when they see content they like, casually calling out: “Followed! I’ll be back next time!”

Now, Gate Social’s annual streamer and creator awards are officially underway!

This year, creators have worked hard in the content space. Some earned recognition with
MU+4.71%
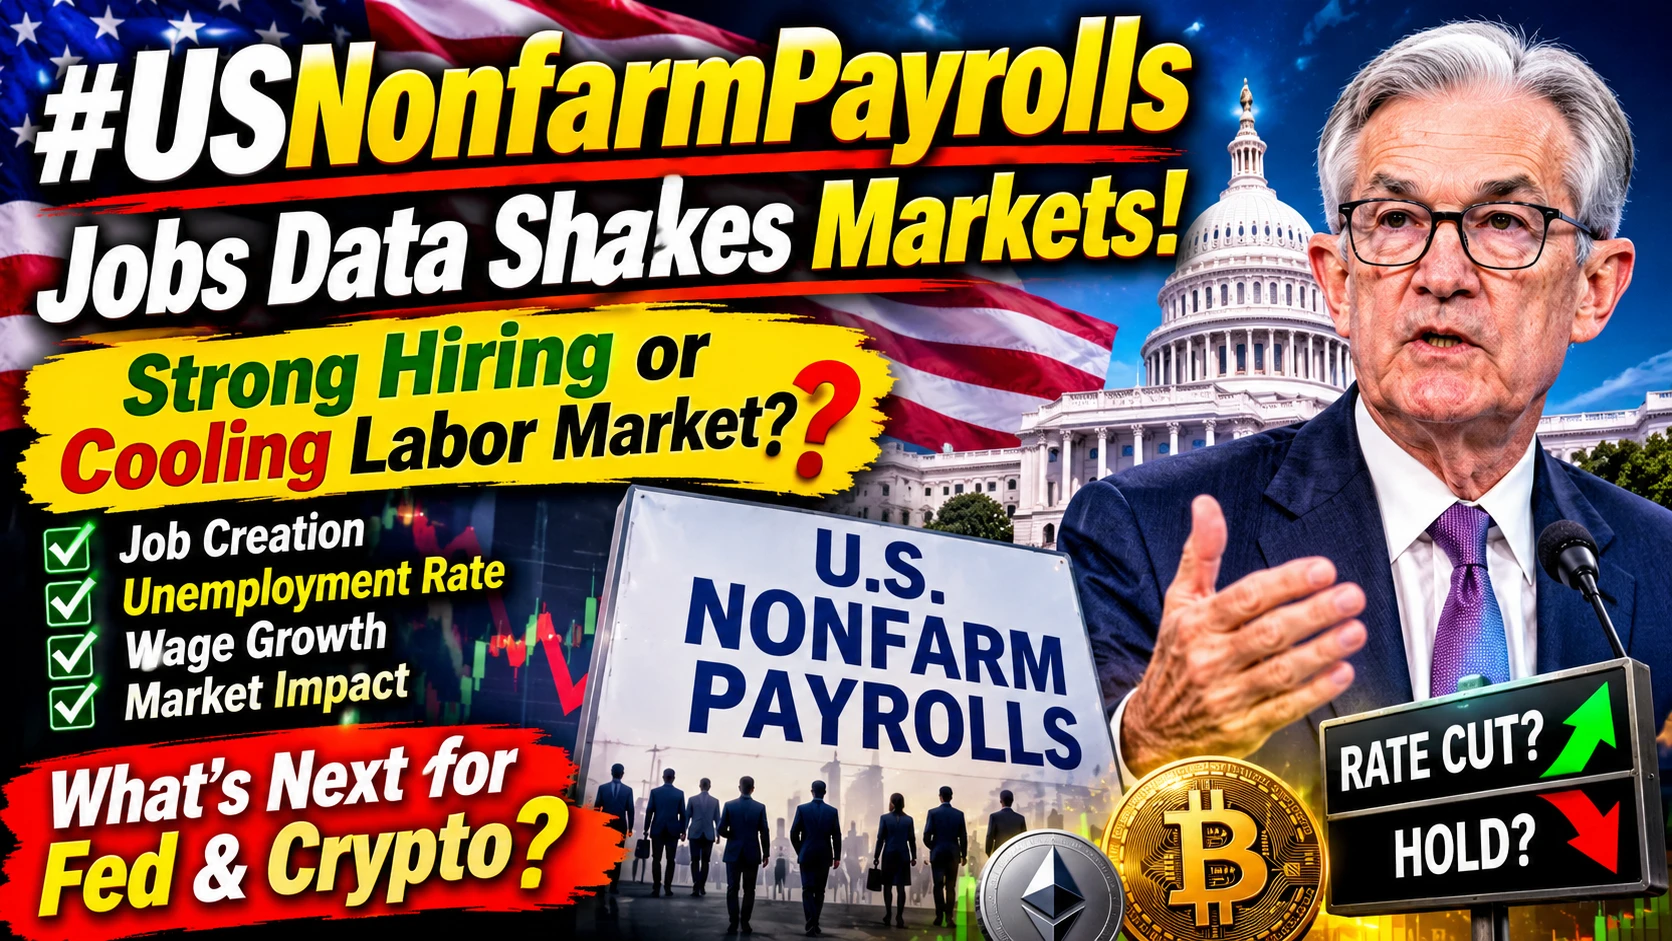
#USNonfarmPayrolls 🇺🇸
**US Nonfarm Payrolls: Is the American Labor Market Getting Stronger or Finally Starting to Cool Down?**
The US Nonfarm Payrolls (NFP) report is one of the most important economic releases in the global financial market. Every month, millions of traders, investors, economists, and financial institutions watch this report because it provides a major snapshot of the health of the American labor market.
But why does this single economic report create so much excitement and volatility across financial markets?
The answer is simple: employment data can influence Federal Rese
post-image
BTC-0.67%
ETH-1.26%
XAU+0.38%
NDAQ+0.28%
BTC next target
live-cover
LIVE1,808
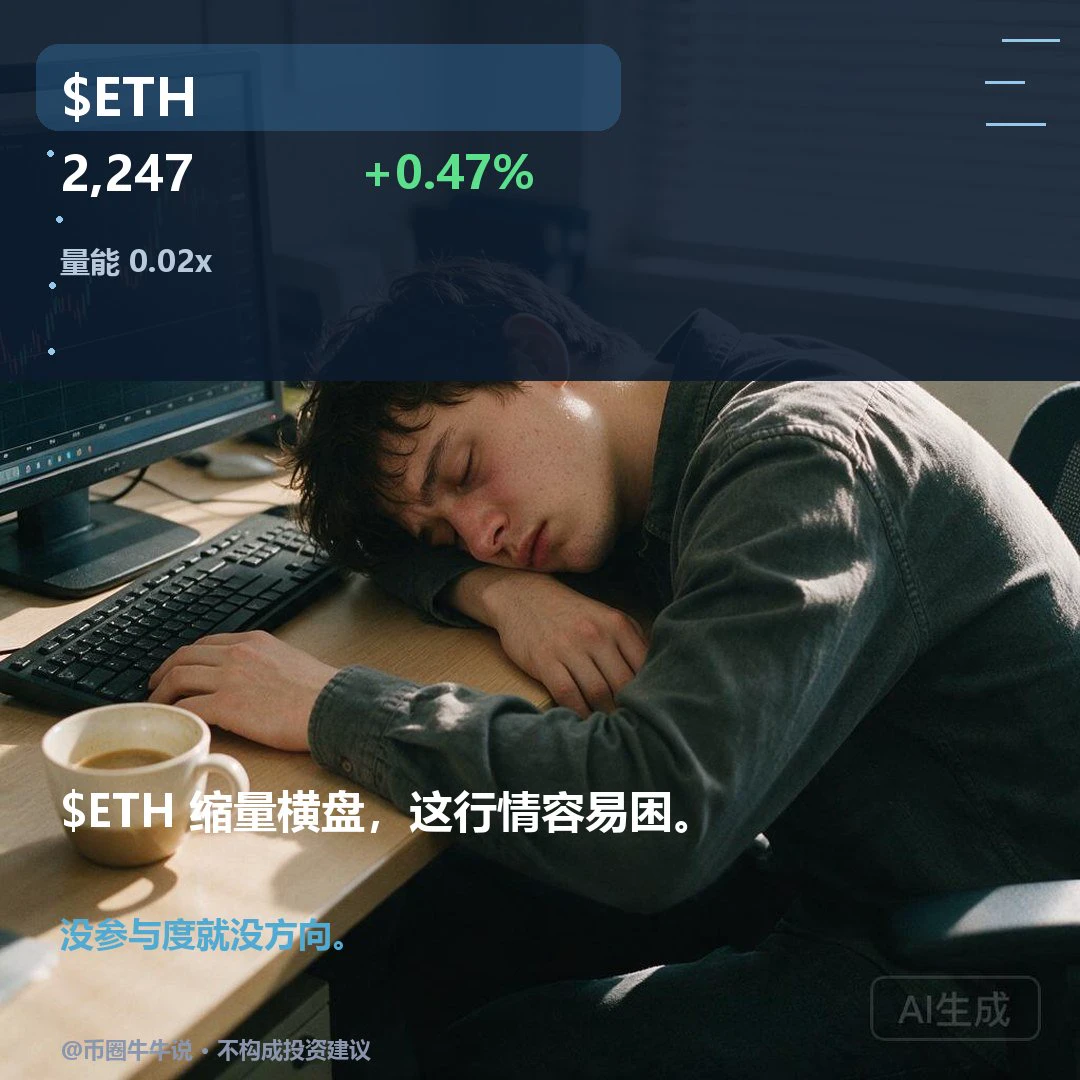
$ETH Currently at 2247.34, up 0.47% over 24H. The 1H trend is relatively strong (RSI 58.72, price above EMA20 at 2245.22); the 4H trend is weak (RSI 17.00, price below EMA20 at 2272.20), with a volume ratio of 0.02. A sustained hold above the 2254.25 resistance could point to further upside, while a break below the 2210.17 support would weaken the short-term outlook. In review, check whether 2254.25 holds and 2210.17 is reclaimed; volume is only 0.02x, and failure to reclaim invalidates the setup. The disagreement between the two timeframes remains unresolved, so short-term signals need to be
post-image
ETH-1.26%
  • 3
$ONE Short, short, short, short—an unexplained rise is just the prelude to a crash.
It won't be long before the storm hits.
post-image
ONE-1.19%
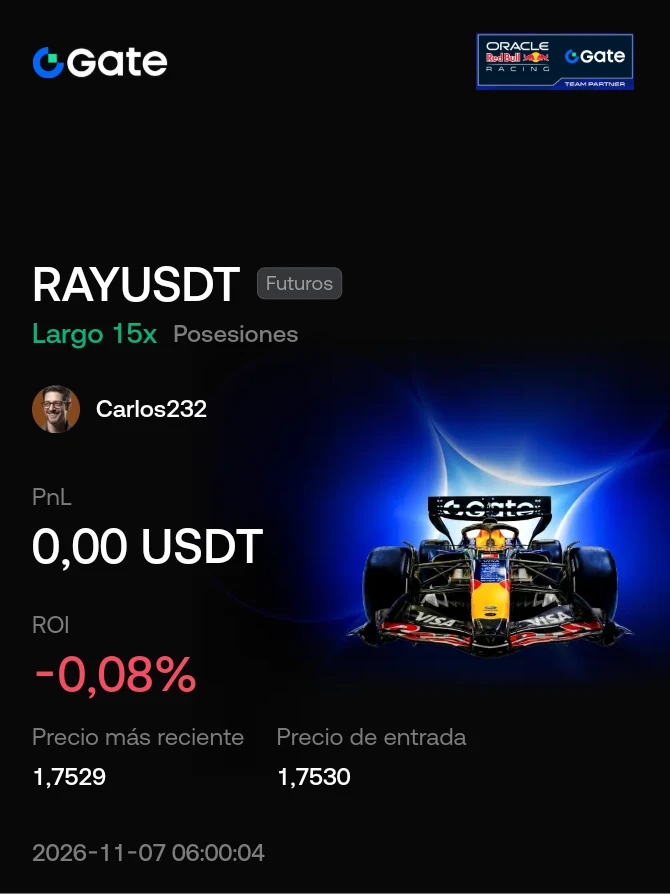
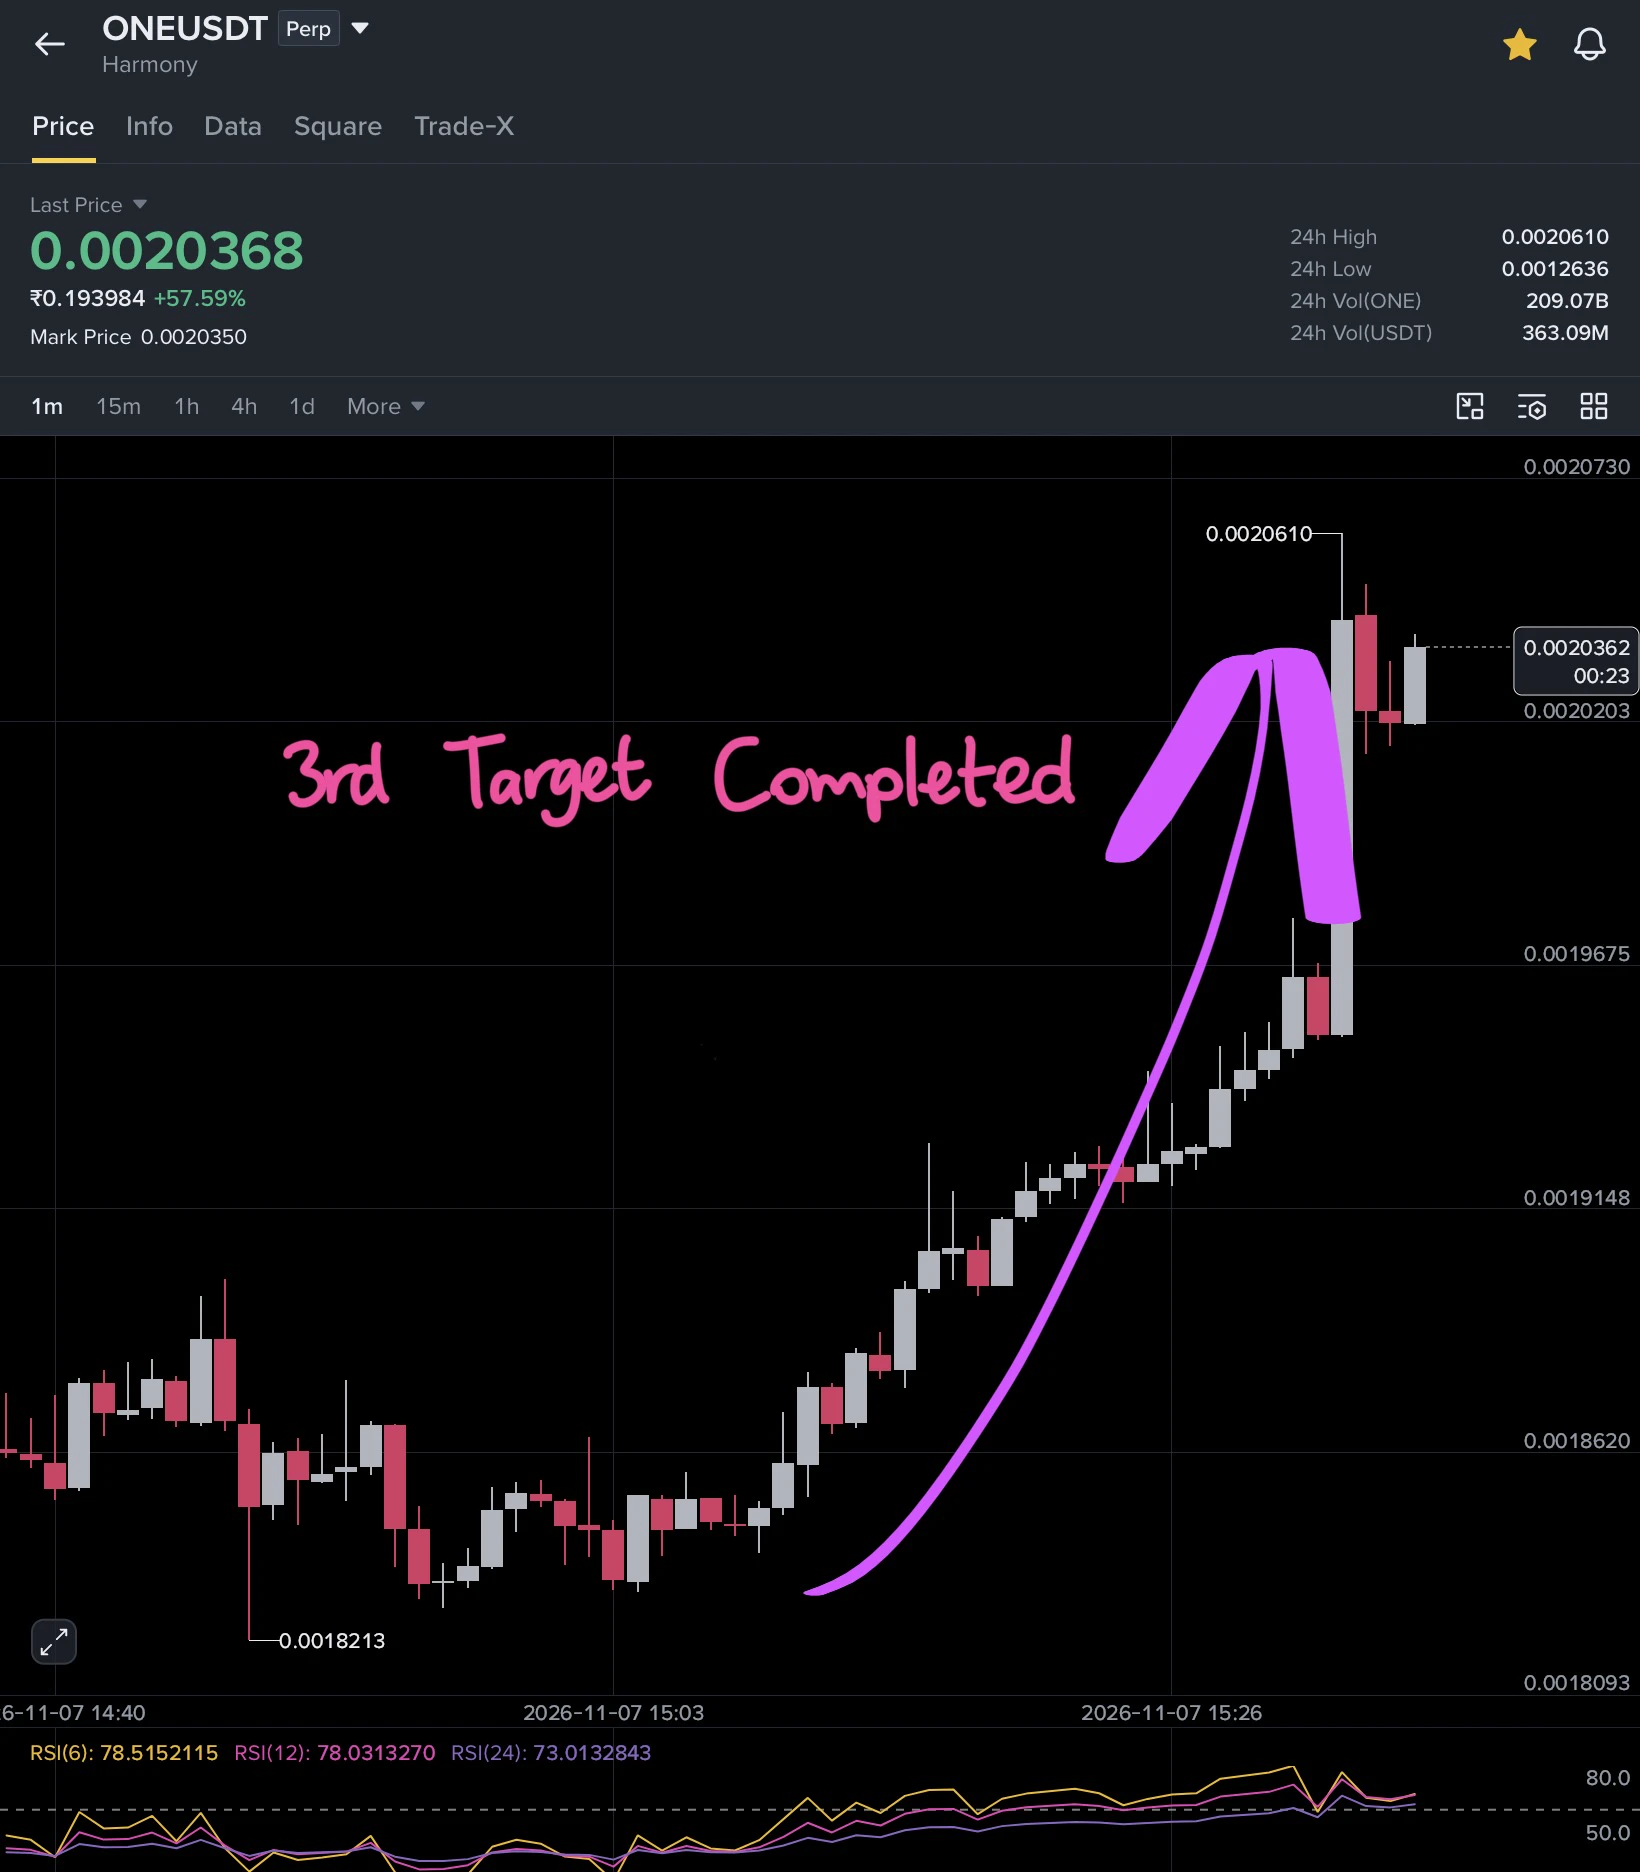
$ONE Third Target Completed ✅
post-image
CryptoSat
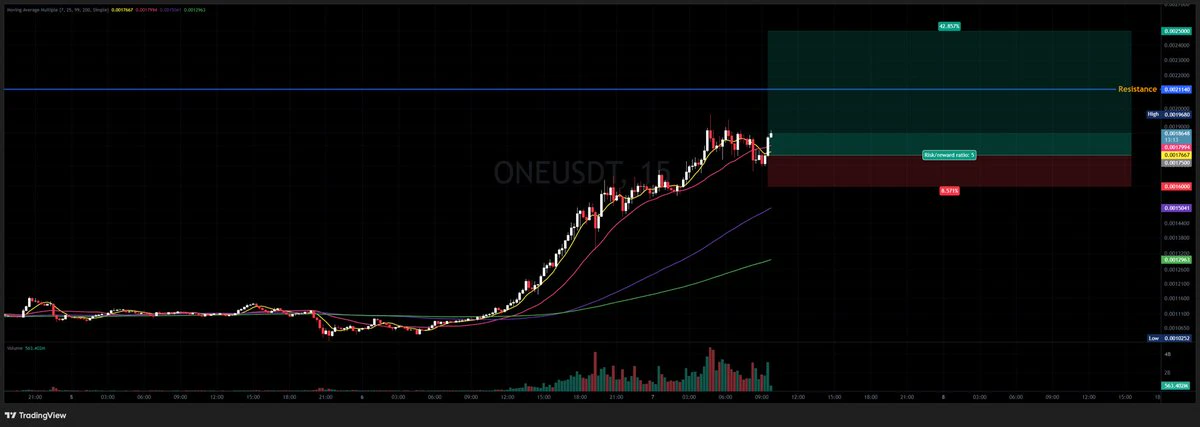
💰 $ONE  /USDT
🔼 LONG
✳️ ENTRY (Use DCA STRATEGY) : 17500, 17000
🎯 TARGETS - 18000, 19200, 20000, 21000, 25000
🀄️ LEVERAGE -  cross 10x
🔴 STOPLOSS - 1600
repost-content-media
Load More

Join 40 M users in our growing community

⚡️ Join 40 M users in the crypto craze discussion

💬 Engage with your favorite top creators

👍 See what interests you

Trending Topics

USAIStocksHitHard

17.89k Views3.65k Discussing

U.S. stocks sold off sharply on Thursday, November 5 (UTC). The Nasdaq closed down around 5.5%, entering correction territory, while the Philadelphia Semiconductor Index plunged roughly 12%, with chip stocks including $NVDA and $AMD posting steep losses. Beyond profit-taking, investors are growing concerned about the pace of AI data center construction, capital spending, and future returns on investment. The key question now is whether the AI sector’s lofty growth expectations need to be repriced. Where do you think the next opportunities will emerge: chip stocks, tech giants, or other sectors?

USNonfarmPayrolls

26.81k Views4.29k Discussing

StakeOnLaunchpoolToShare450KVLX

4.81k Views799 Discussing

View More