
Square
Following
Hot
News
Notifications
Profile
Share your thoughts
placeholder
Article
Does @elonmusk have a favorite meme?
post-image
Robinhood chain visualized
post-image
HOOD+4.25%
Trenches
ZIG
Z
bade
b
ZIG
0x8c...1145
Market Cap
$.
Change
.
24h Vol
$.
Holders
.
BTC
B
bade
b
BTC
C5xp...pump
Market Cap
$.
Change
.
24h Vol
$.
Holders
.
José
J
bade
b
José
87CQ...1UJT
Market Cap
$.
Change
.
24h Vol
$.
Holders
.
IDOL
I
bade
b
IDOL
0x3b...ab07
Market Cap
$.
Change
.
24h Vol
$.
Holders
.
STONK
S
bade
b
STONK
6GmA...UNgx
Market Cap
$.
Change
.
24h Vol
$.
Holders
.
French bank resumes transfers after $133M hack, crypto loss still unconfirmed
Arkéa says attackers used its own account through a provider's platform, while a separate $108.8 million USDC trail leaves the bank-to-crypto link unproven.
Quick Take
⚠️ Personal market analysis only. NFA — manage risk and DYOR.
Educational content, not investment advice or a recommendation to buy, sell, deposit, or withdraw any asset. No paid promotion or referral/affiliate links.
post-image
USDC+0.01%
  • 1
A string of big wins 🤩🤩 Today's trade was a big win $ONE & $AKE
Everyone, $ONE will get ready for a sharp drop and continue shorting 🥂
post-image
ONE-1.19%
AKE+6.07%
This trade on $ACT was profitable. Take the money and run. Another victory. Profit: $ 656 Today's highlights:
‍$XRP and $AKE .
post-image
ACT-1.19%
XRP-1.15%
AKE+6.07%
Everyone’s saying the S&P 500 has topped, but I haven’t seen enough reason to believe that. The chart does look like 2000, but expensive valuations don’t mean an immediate drop. Back then, it kept climbing for more than six months before crashing. I had my stop-loss set too tight and got stopped out twice. I’ve learned my lesson. I hope I’m wrong this time—if I am, that means the rally is still going. Keep an eye on what I’m watching.
post-image
SPX500+0.19%
US500+0.69%
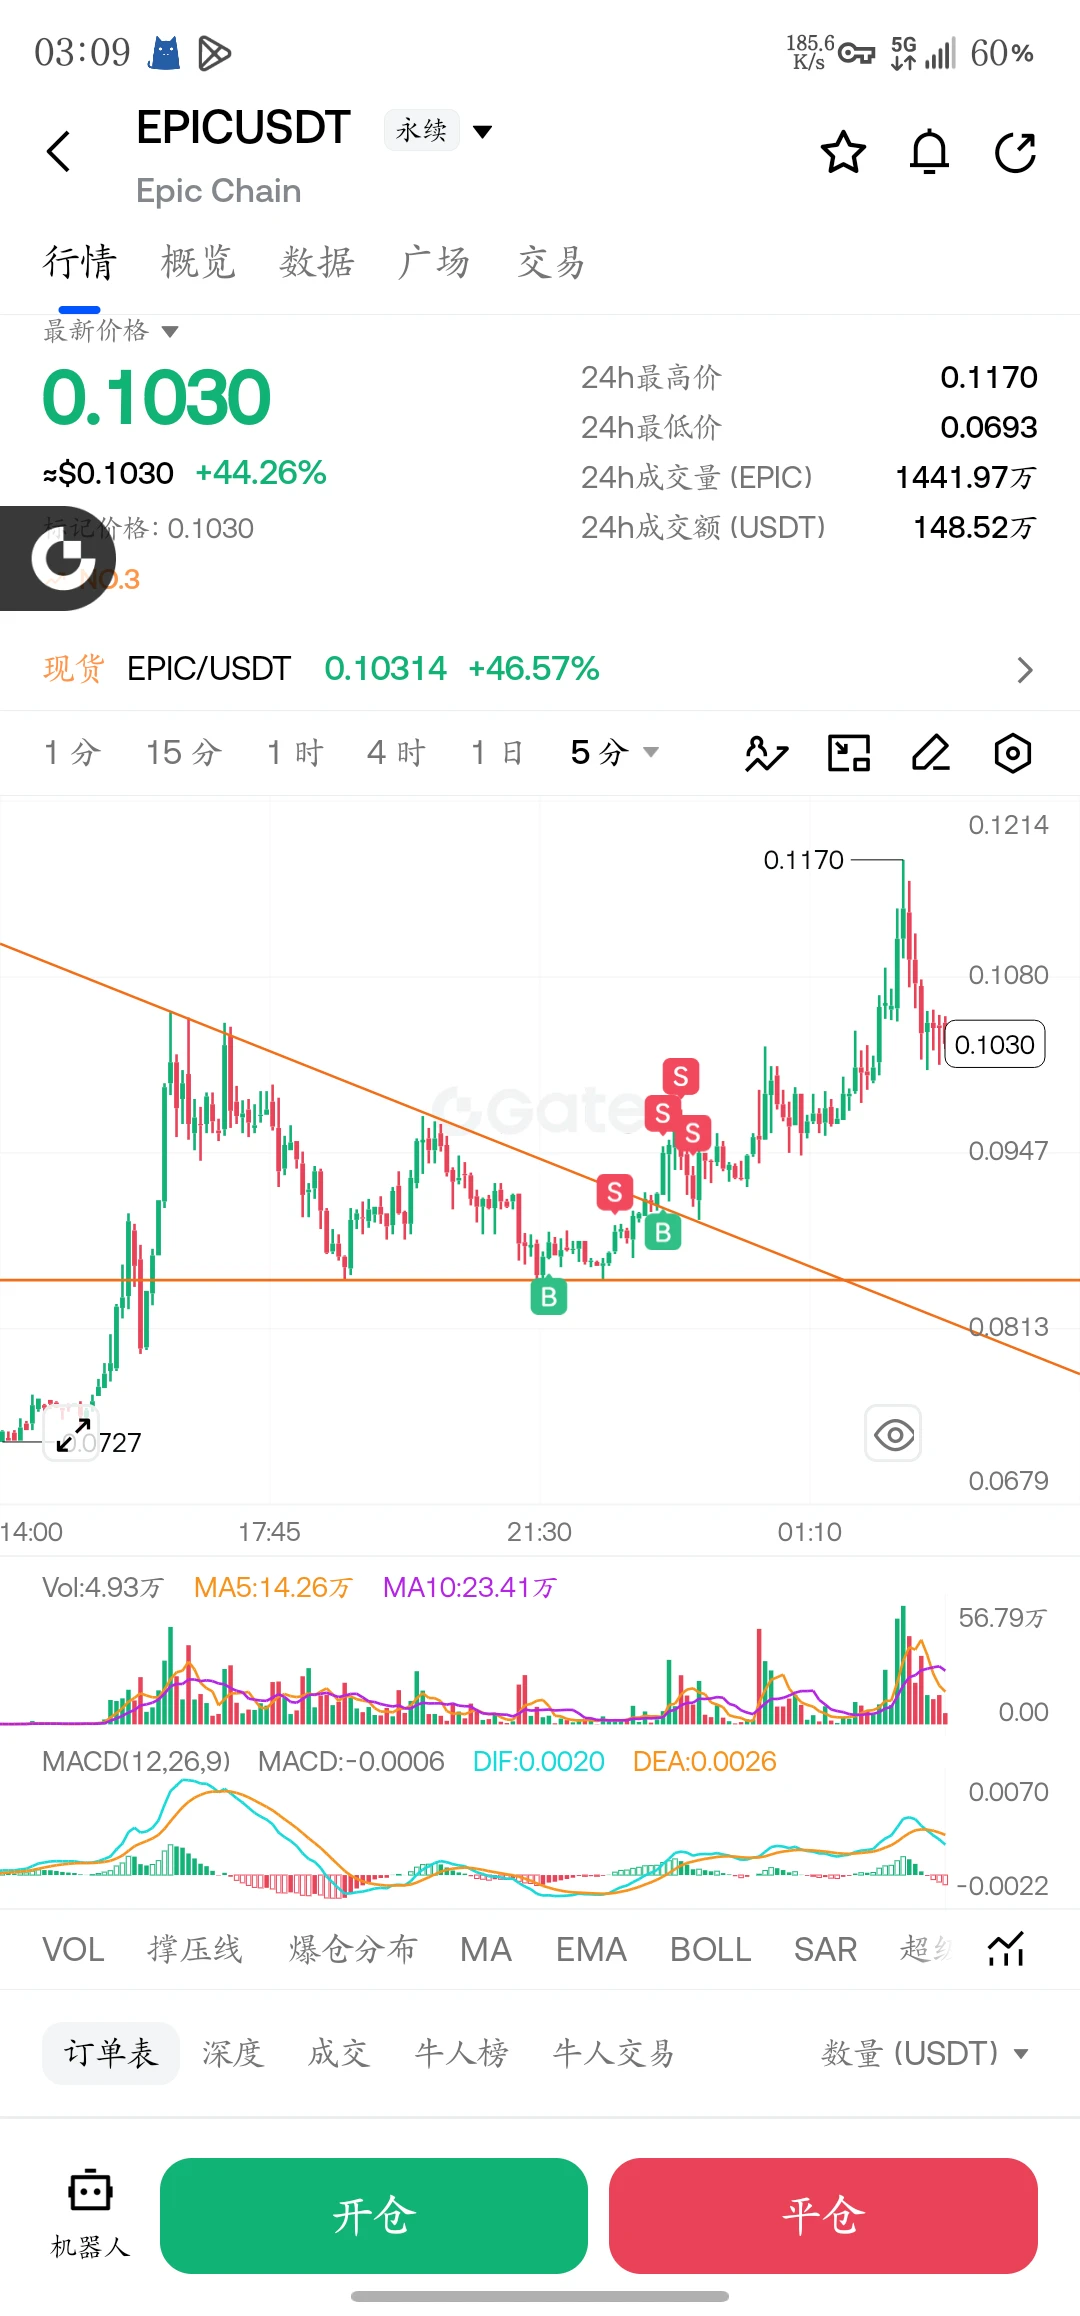
$EPIC A pullback stopped me out at breakeven. I’m seriously losing it—this shakeout completely threw me off. I had my stop-loss at 0.0845, then added to my position after the breakout and moved my stop to breakeven. If I hadn’t set a stop... but there’s no point in what-ifs. I was sure I’d capture today’s top gainers. I’m mentally exhausted. I’ll take some time to regroup
post-image
EPIC-9.89%
  • 1
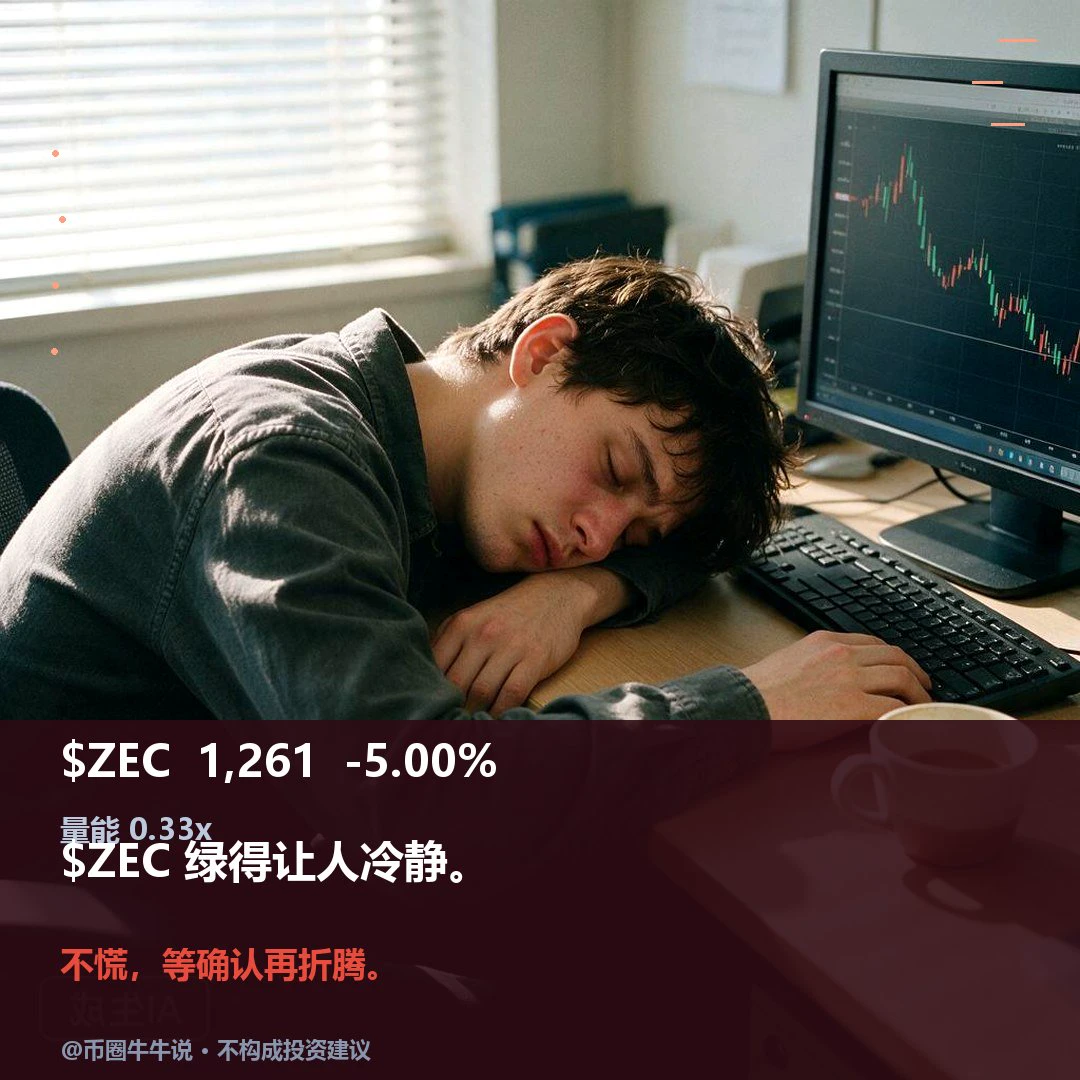
$ZEC Currently at 1260.59, 24H -5.00% (range: 1250.67–1364.08). 1H is weak, with an RSI of 23.48; price is below the EMA20 at 1288.01, and the volume ratio is 0.33. 4H is weak, with an RSI of 54.41; price is below the EMA20 at 1284.31, with support at 1159.00 and resistance at 1387.89. A sustained move above the 1364.08 resistance could indicate continuation; a break below the 1250.67 support would weaken the structure. On review, confirm whether price holds above 1364.08 and reclaims 1250.67; volume is only 0.33x. A hold without volume or failure to reclaim after a breakdown invalidates the s
post-image
ZEC+1.16%
$IDOL I went from being down 40% to recovering my losses this time, all because I didn’t cut my losses at 0.023. Let’s get straight to the point.
Up 36.55% in 24h, currently at 0.0348. It briefly hit 0.0456 before getting dumped back down. Trading volume came in at $400 million—that’s explosive for a small-cap coin. But note that the turnover rate is already absurdly high, which means tokens are changing hands on a massive scale, not that there’s one-way accumulation.
On fundamentals, I’ve looked through IDOL’s contracts. The token’s utility is focused on ecosystem governance and node staking,
IDOL-6.71%
$ARX Down 10.68% in a day, with the current price at 0.2158—just a hair above the 24-hour low of 0.2143. This isn’t a pullback; the bulls’ defenses are being tested inch by inch. Trading volume of 3.4M suggests selling pressure isn’t particularly heavy; this looks more like a slippage-driven selloff in thin liquidity. If a candle body closes below 0.2143, there’s basically a vacuum below. My approach: don’t catch a falling knife. Wait for a high-volume, 1-hour candle showing the decline has stalled near 0.2143 before considering a small long position, capped at 5%, with a stop-loss at 0.2080 (
ARX-2.47%
I don't day trade.
I don't sell covered calls.
I don't sell cash secured puts.
I don't buy weekly options.
I don't run spreads.
I don't watch screens all day.
I don't trade on the news.
I don't care what the market does day to day.
What I do:
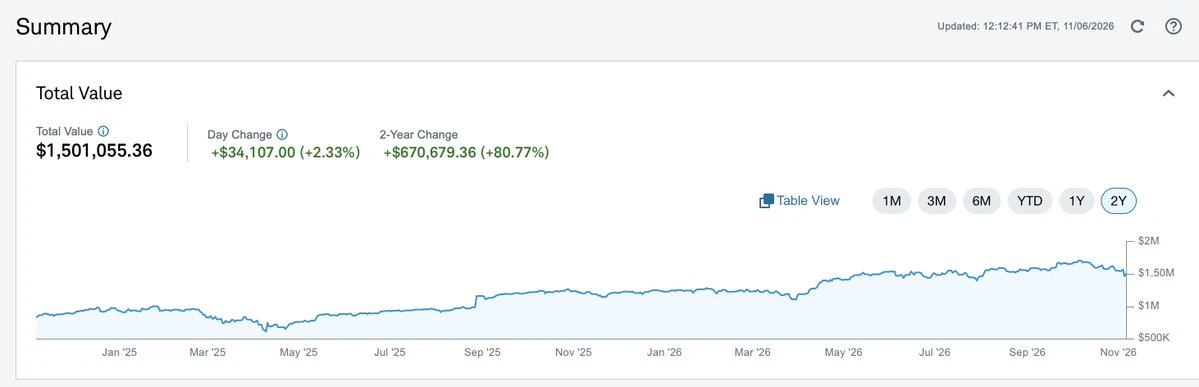
$3M+ in $VOO + $Q + Elite companies that never gets sold.
1+ year portfolio secured puts on great companies below fair value, secured by that base.
Every premium goes back into the base.
Ratios in check so a 50% crash can't force my hand.
$25k+ a month. 10 minutes a day. Don't complicate it.
post-image
VOO+0.33%
Kidly send me followers red packet arrange a time 60 minut in my live streaming i am starting the
live-cover
LIVE72
Finally showing some real life, back above those moving averages. $SOXL is starting to look formidable again, making me wonder if we're really targeting recent highs or just teasing us. Take profit: 48.45 Stop loss: 44.72 Still active: $XRP : Current price 1.1621 - 24-hour change: -1.87%$IDOL : Current price 0.035111 - 24-hour change: +31.95%
post-image
SOXL-1.16%
XRP-1.15%
IDOL-6.71%
2x1 on Doritos until Bitcoin recovers its value.
post-image
BTC-0.31%
$ACT It posted an 11.84% green candle over the past 24 hours, and the sentiment gauge flashed two extreme readings: the Fear & Greed Index surged to 78 (the upper end of the greed range), while the funding rate hit +0.035% (longs are paying, and positioning is crowded). How do these readings compare with historical levels? Over the past three months, ACT’s funding rate has risen above 0.03% only twice: once in early February, when it spiked to 0.0145 before pulling back 18% over two days, and once in mid-March, on the eve of a sideways stretch. The pattern is clear: once longs push the funding
ACT-1.76%
$Bull Run is staging a strong bullish rebound, up more than 10% and nearing the $0.0600 resistance level! If the breakout is confirmed, the rally could extend to $0.0630. Trading plan (long): Entry: $0.0585 – $0.0593 Target levels: $0.0600 / $0.0615 / $0.0630 Stop-loss: $0.0570
post-image
牛来-1.82%
OpenAI CFO: Data center investments will not change due to the midterm elections.
live-cover
LIVE21
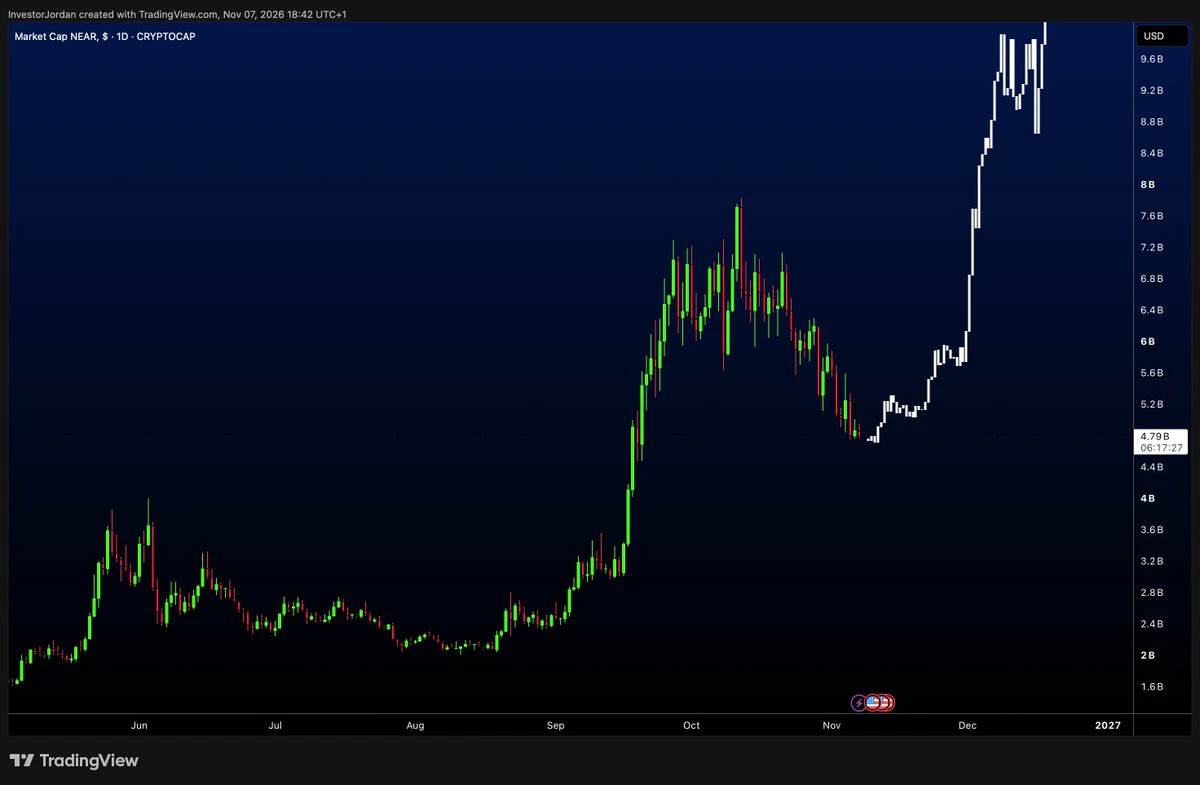
$NEAR 🧠
It's giving $ZEC before it exploded from $500 to $1700 vibes.
Both rallied hard, stalled and then continued running once the market recovered.
Time for @NEARProtocol to chase double digits 🚀
post-image
ZEC+1.16%
  • 1
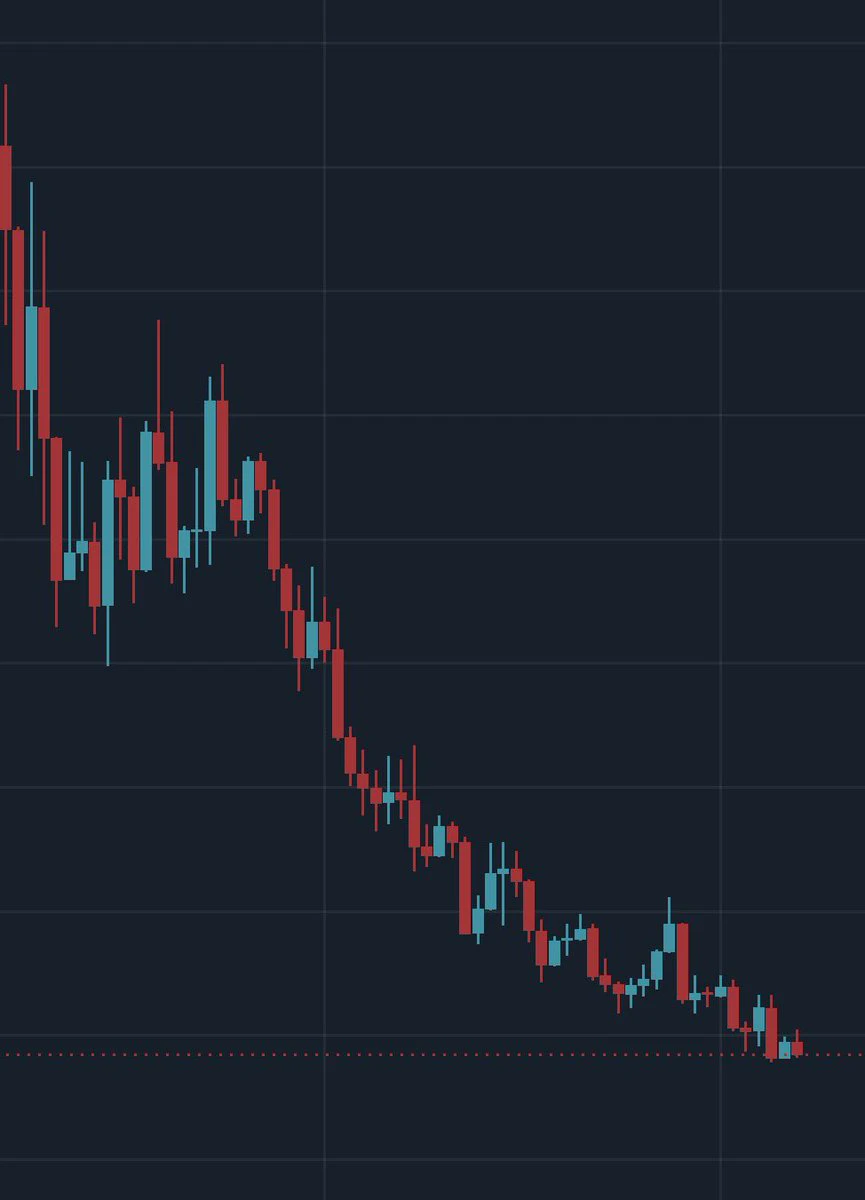
The Nightmare of Every Trader!
post-image
  • 1
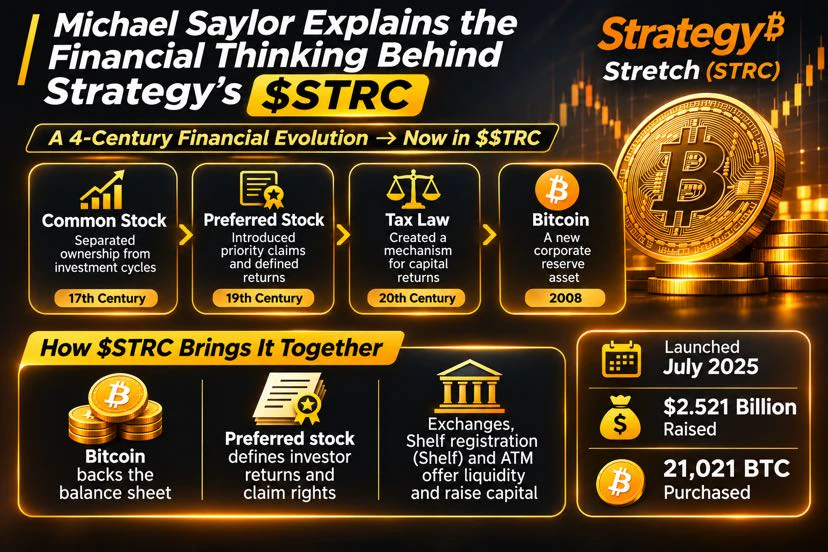
Michael Saylor Explains the Financial Thinking Behind Strategy’s $STRC

Michael Saylor is connecting four centuries of financial evolution to Strategy’s digital credit product, Stretch ($STRC).

His argument is that each stage introduced something new to financial markets:

* Common stock separated ownership from investment.
* Preferred stock introduced priority claims and defined returns.
* Tax rules created ways to structure capital returns.
* Bitcoin introduced a new type of corporate reserve asset.

STRC brings these ideas together.

Bitcoin supports Strategy’s balance sheet, preferred sto
post-image
STRC+0.34%
BTC-0.67%
Load More

Join 40 M users in our growing community

⚡️ Join 40 M users in the crypto craze discussion

💬 Engage with your favorite top creators

👍 See what interests you

Trending Topics

USAIStocksHitHard

21.1k Views3.67k Discussing

U.S. stocks sold off sharply on Thursday, November 5 (UTC). The Nasdaq closed down around 5.5%, entering correction territory, while the Philadelphia Semiconductor Index plunged roughly 12%, with chip stocks including $NVDA and $AMD posting steep losses. Beyond profit-taking, investors are growing concerned about the pace of AI data center construction, capital spending, and future returns on investment. The key question now is whether the AI sector’s lofty growth expectations need to be repriced. Where do you think the next opportunities will emerge: chip stocks, tech giants, or other sectors?

USNonfarmPayrolls

34.41k Views4.34k Discussing

StakeOnLaunchpoolToShare450KVLX

9.9k Views828 Discussing

View More