
Square
Following
Hot
News
Profile
Share your thoughts
placeholder
Article
#韩股大跌你会抄底吗 Behind the Korean Stock Market Crash: The “False Prosperity” of AI Chip Stocks and a Triple Death Spiral
This was no sudden plunge by chance, but a one-time reckoning for all the hidden risks built up during the AI bull market of the past two years. Behind the KOSPI’s single-day fall through the 3% threshold and SK Hynix leading the decline with a 4% drop lies a vicious cycle involving macro liquidity, industry pricing power, and capital structure—not ordinary profit-taking.
 First death spiral: The “valuation bubble” driven by macro interest rates
The lingering effects of high inte
Oil at $100, but $ETH only bounced 0.5%: I’m bearish
The Iran war sent oil prices soaring to $100, with safe-haven headlines everywhere, yet $ETH only bounced from 2408.51 to 2420.63—a total of just 0.5%.

It’s not that I missed the news—the news simply couldn’t move the market, which is why I’m comfortable being bearish.

The daily RSI is 37.1, languishing in the weak zone; the MACD has been in a death cross below the zero line for 19 days, and the green bars have flattened out; 24h trading volume is 330127302 USDT, with a volume ratio of just 0.464—money simply hasn’t entered the market.
ETH+0.29%
Trenches
CNPY
C
bade
b
CNPY
0xc6...ddd2
Market Cap
$.
Change
.
24h Vol
$.
Holders
.
TSI
T
bade
b
TSI
0xa8...1c1e
Market Cap
$.
Change
.
24h Vol
$.
Holders
.
AGT
A
bade
b
AGT
0x5d...e274
Market Cap
$.
Change
.
24h Vol
$.
Holders
.
BOOMER
B
bade
b
BOOMER
0x5a...5c00
Market Cap
$.
Change
.
24h Vol
$.
Holders
.
PIERRE
P
bade
b
PIERRE
D3S6...pump
Market Cap
$.
Change
.
24h Vol
$.
Holders
.
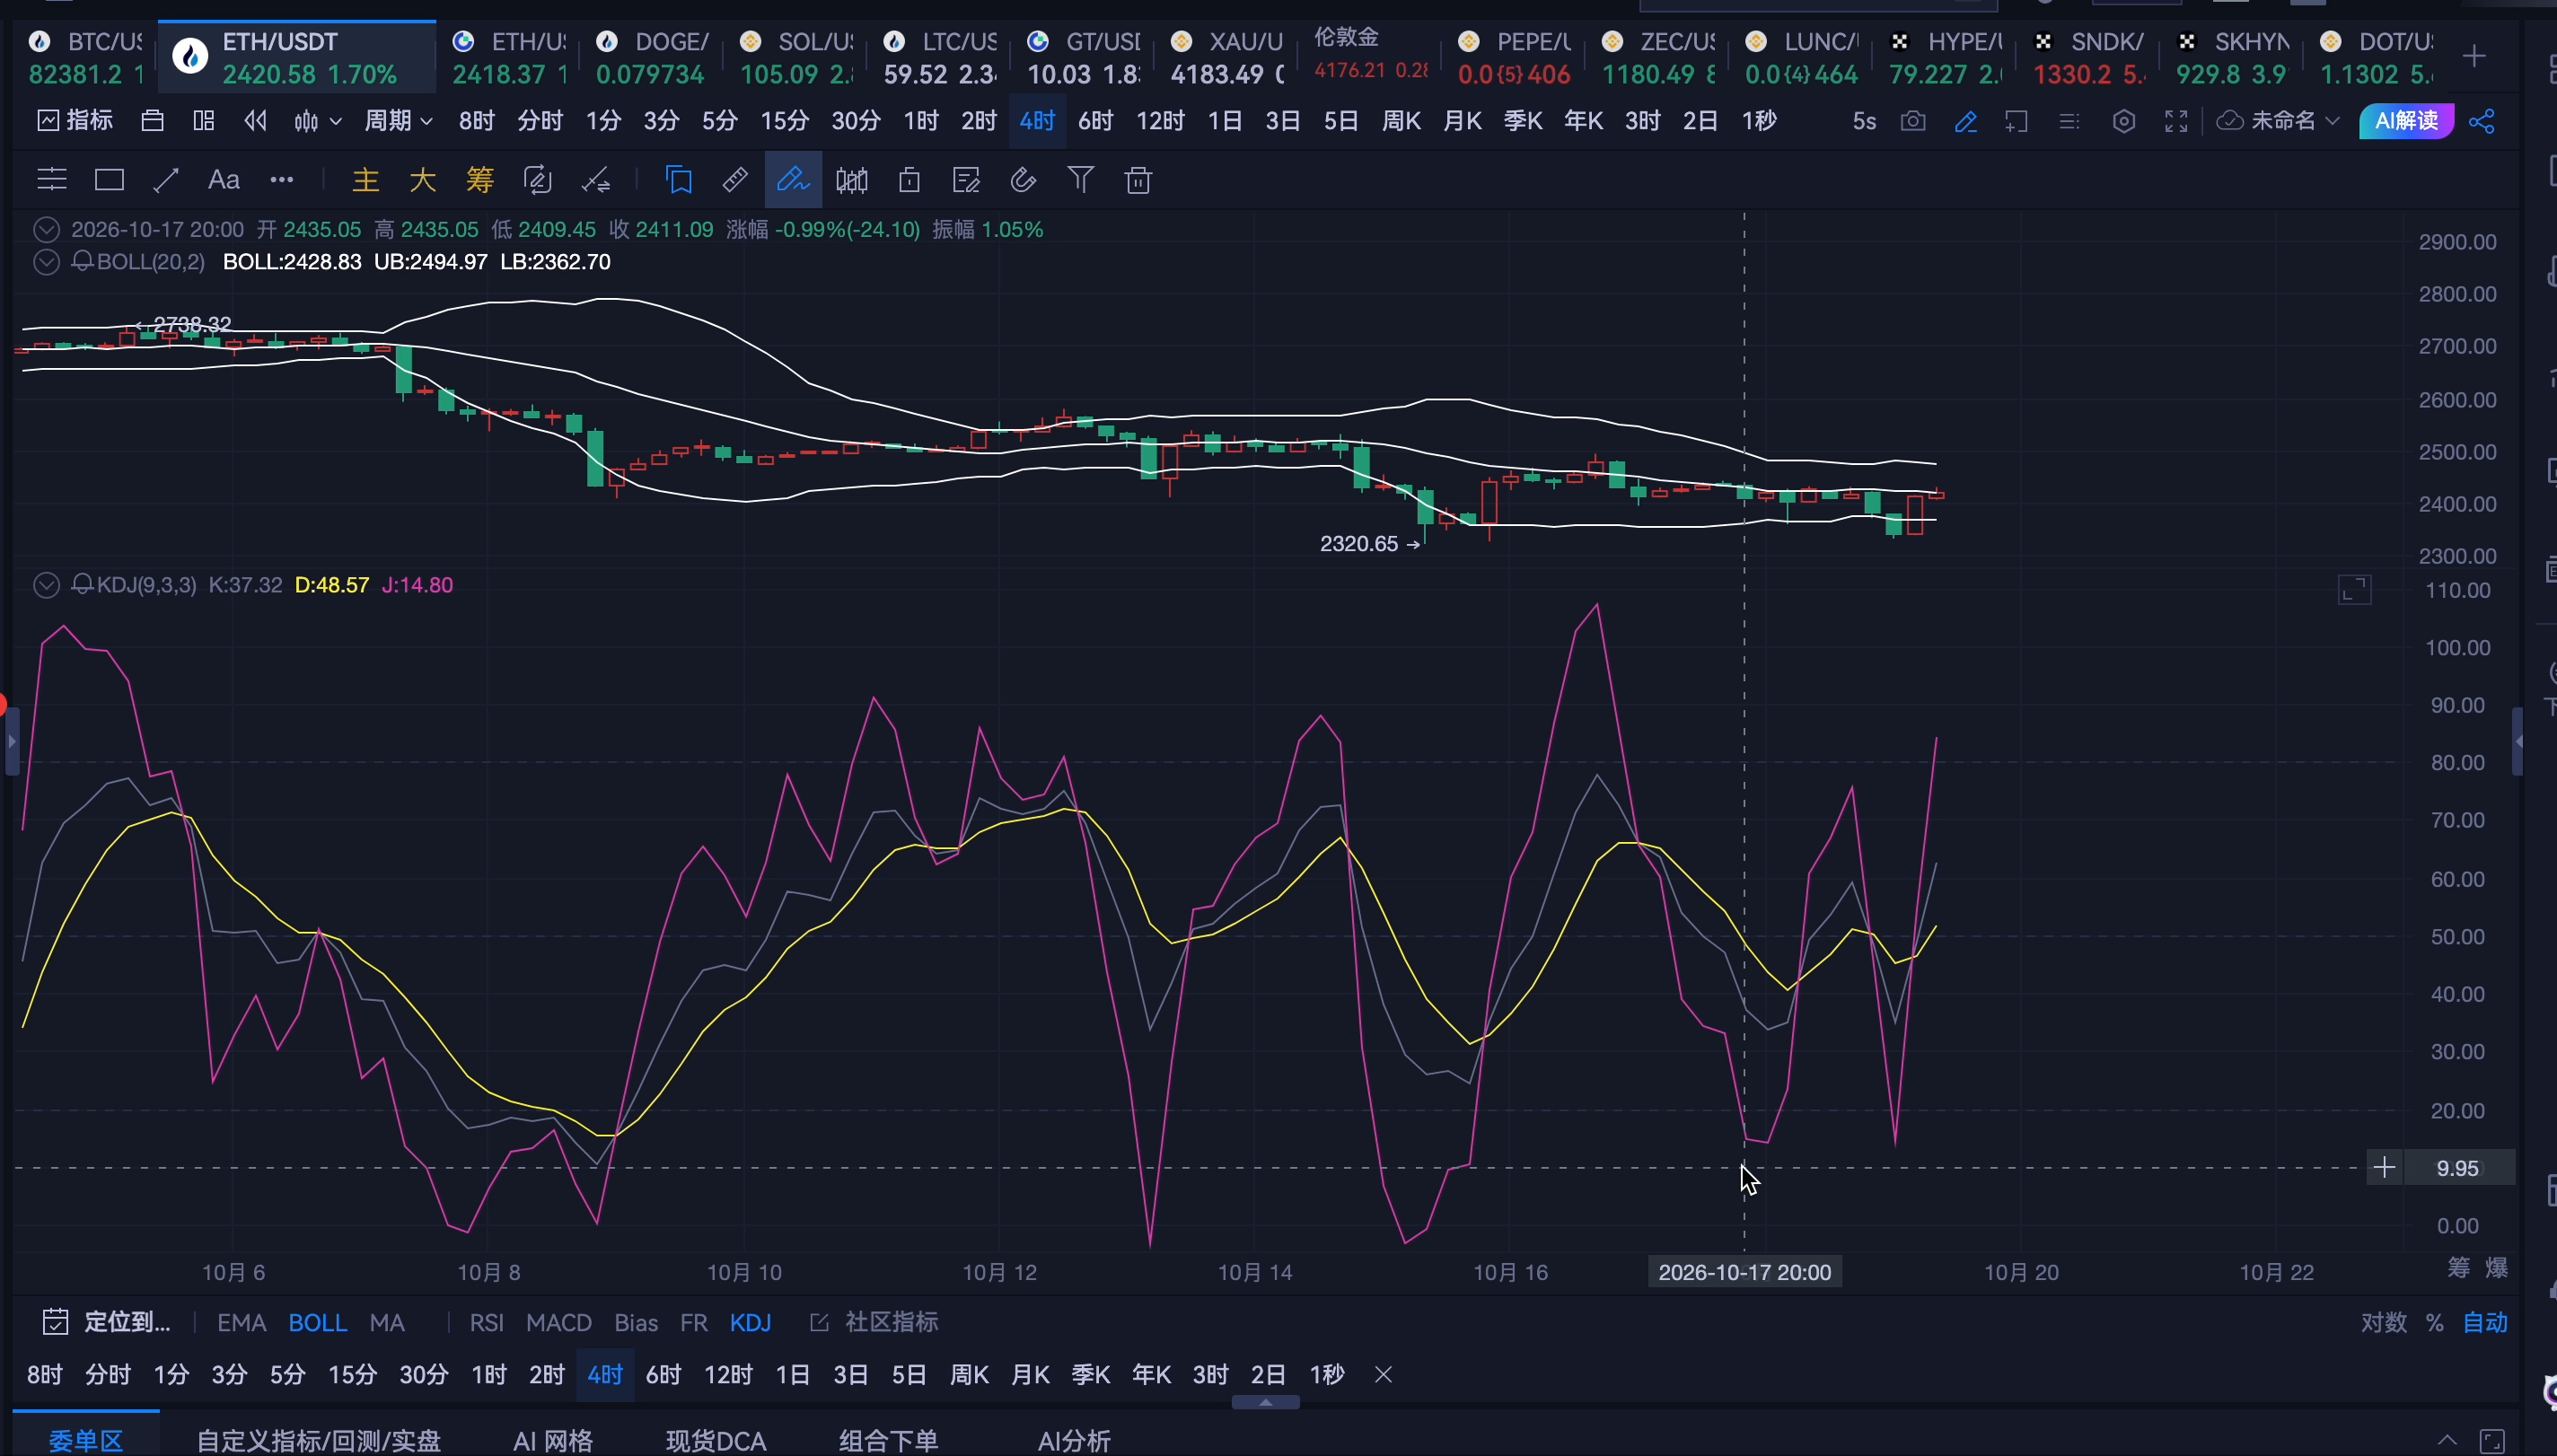
Yesterday, ETH dipped to a low of 2327 and stabilized, then rebounded with the broader market, reaching a high of 2429. This recovery is merely a short-term correction within the downtrend. The daily bearish structure remains intact, and the trend has not reversed. On the 4-hour chart, the price touched the upper Bollinger Band. Continued bullish hourly candles have pushed indicators higher, and short-term bullish momentum has been fully unleashed, with overhead resistance gradually emerging. The strategy remains to look for shorts at higher prices on a rebound.
Short ETH near 2430–2460, targe
post-image
ETH+0.27%
$270 million wiped out! FOMC blackout period + Jensen Huang to the rescue—the crypto market script for this week is already written
Leverage never dies, and neither does the market. $272 million evaporated over the past 24 hours, with longs accounting for 83.49%—the market is telling you in no uncertain terms: the blackout period is no place for reckless traders.
This week’s core conflict is “macro vacuum” meets “narrative impulse.” The FOMC blackout period means Fed officials are collectively keeping quiet, leaving the market without a directional anchor. BTC is likely to grind along the bott
post-image
BTC+0.95%
ETH+0.29%
#TeslaRoadsterSparksMemeCoinSurge
#TeslaRoadsterMemeRally Tesla’s Rocket-Powered Roadster Ignites Crypto Speculation: Can FTR Lead the Next Meme-Coin Wave?
One headline. Three market forces. A new test for speculative crypto.
Tesla’s October 15 Roadster demonstration has brought together futuristic automotive technology, viral internet culture and fast-moving meme-coin speculation. The prototype’s rocket-style thrusters and dramatic airborne maneuvers captured global attention, while traders began looking for potential spillover into Tesla-themed tokens and the broader altcoin market.
But the
Falcon_Official
#TeslaRoadsterSparksMemeCoinSurge
#TeslaRoadsterMemeRally Tesla’s Rocket-Powered Roadster Ignites Crypto Speculation: Can FTR Lead the Next Meme-Coin Wave?
One headline. Three market forces. A new test for speculative crypto.
Tesla’s October 15 Roadster demonstration has brought together futuristic automotive technology, viral internet culture and fast-moving meme-coin speculation. The prototype’s rocket-style thrusters and dramatic airborne maneuvers captured global attention, while traders began looking for potential spillover into Tesla-themed tokens and the broader altcoin market.
But the opportunity is not simply about buying whatever trends next. The real edge comes from distinguishing a verified catalyst, measurable trading activity and sustainable market demand.
THE ROADSTER STORY: WHAT ACTUALLY HAPPENED?
Tesla unveiled its next-generation Roadster prototype at a SpaceX facility in Texas, demonstrating aerial maneuvers using a system involving SpaceX-developed thrusters. The vehicle performed a dramatic midair movement and landed, creating the kind of visual event that can spread rapidly across social media.
Production is planned for 2028, meaning the demonstration does not represent a mass-market vehicle currently available to buyers. The rocket-equipped configuration also faces practical and regulatory limitations.
There is no verified evidence that the demonstration ended with the car being destroyed. The viral narrative should therefore be separated from unsupported claims about a crash or failed experiment.
The event matters to crypto because recognizable brands and extraordinary demonstrations can create attention faster than fundamentals can change.
FTR: A VIRAL CATALYST MEETS ON-CHAIN TRADING
Flying Tesla Roadster (FTR) became one of the tokens associated with the story. On October 16, market reports described a sharp speculative surge, with some versions of FTR recording dramatic percentage gains.
However, FTR is not a single, unambiguous asset. Multiple tokens using similar names or tickers appeared across different blockchain networks, with materially different prices, liquidity and trading histories.
That distinction is crucial. One Solana-based FTR listing showed approximately $244,100 in 24-hour volume and $459,300 in liquidity in a market snapshot, while other similarly named tokens had much smaller liquidity pools. These figures relate to a specific listing and should not be combined into one market valuation.
A rapidly rising token price is not sufficient evidence of sustainable demand. Liquidity depth, holder concentration, contract identity and the ability to exit a position can matter more than a headline percentage gain.
BTC, TSLAX AND MEME: IS THE RALLY SPREADING?
Bitcoin remains an important reference point for crypto risk appetite. If BTC stabilizes and broader market participation improves, traders may become more willing to explore speculative altcoins. Yet meme tokens can diverge sharply from Bitcoin, particularly when their prices depend on individual viral events.
TSLAX also requires careful identification. A Tesla-themed ticker should not automatically be treated as Tesla stock, an officially endorsed cryptocurrency or a token backed by company shares. Its precise contract, issuer and underlying structure must be verified before drawing conclusions about its performance.
Likewise, a reported move of nearly 10% in MEME needs to be checked against the exact asset and trading venue. A ticker alone does not establish which token is moving or whether the rally is supported by meaningful liquidity.
THREE SIGNALS THAT MATTER MORE THAN HYPE
Volume quality: Is trading activity sustained across multiple sessions, or does it disappear after the initial headline?
Liquidity and concentration: Can traders enter and exit without substantial slippage, and is ownership concentrated among a small number of wallets?
Market confirmation: Is Bitcoin stabilizing while participation broadens across established altcoins, or is activity confined to a handful of newly launched tokens?
These indicators help separate a wider sentiment recovery from isolated, short-lived speculation.
THE OPPORTUNITY — AND THE RISK
The bullish scenario is straightforward: the Roadster story remains visible, trading activity expands, and improving crypto sentiment supports further speculative participation.
The opposing scenario is equally important. Attention fades, early buyers take profits, and thin liquidity magnifies the downside. Newly launched meme tokens can lose value rapidly, even when their underlying internet narrative remains popular.
No price target or guaranteed breakout can be justified by the Roadster demonstration alone.
FINAL TAKEAWAY
Tesla has supplied a powerful headline, but the crypto market still has to prove that attention can become lasting participation. FTR demonstrates how quickly a recognizable story can generate speculative activity, while BTC, TSLAX and MEME each require independent verification.
The strongest approach is to verify the exact asset, examine its liquidity and trading history, and distinguish genuine market recovery from a temporary social-media frenzy.
In a market driven by narratives, attention creates the first move. Liquidity, participation and risk management determine what happens next. @Gate_Square
TSLA-2.17%
TSLAX+2.30%
BTC+0.95%
MEME-1.54%
SOL+1.33%
  • 2
Has the market turned bad again? I can feel the pessimism bitcoin:native ethereum:native
post-image
BTC+0.95%
ETH+0.29%
Speaking of $DNA ’s launch, how many people sold immediately?
As of October 19, DNA was quoted at approximately $0.2558 on CoinGecko, with 24-hour trading volume of approximately $30.72 million and a circulating market cap of approximately $33.25 million. Congratulations once again to the big winners.
Long Ge did not receive the airdrop, nor did he participate in this grand wealth-distribution campaign.
He can only look back and study the tokenomics and operating mechanism of $DNA .
Long Ge had nothing to do on Sunday, so he carefully checked the DNA token economic design on the official websi
post-image
DNA-5.76%
Some things may seem complicated, but they’re actually very simple: in product competition, lowering costs is what makes you competitive.
post-image
[ NEW STREAMER ] MORNING MARKET
live-cover
LIVE1,852
Gate's BTC & ETH Futures Volume Ranks Top 3 - Congratulations 🎉 👏
#GateBTCAndETHFuturesVolumeRanksTop3
The hashtag making the rounds on Gate Square highlights that Gate is now ranking among the top 3 global venues by BTC and ETH perpetual futures volume — and the broader data largely backs up the claim. Here's the picture as of mid-October 2026.
Derivatives volume momentum is real. In September, Gate recorded 396 billion in derivatives trading volume, up 38.2% month-on-month — its best monthly showing in recent memory.
Market share is holding near 10%. In June, Gate held a 9.52% share of de
BTC+0.95%
ETH+0.27%
  • 6
☀️ GM! A new week—stay grounded. ⚖️
BTC is back near $82K , and ETH has also rebounded somewhat, but Asian tech stocks remain under pressure.
📌 Today's featured topic: The market has rebounded—is it really stable?
₿ Can BTC's rebound regain a foothold at key levels?
📊 Will pressure on U.S. tech stocks continue to affect Crypto?
🛡️ In the new week, will you add to your positions, reduce them, or wait for confirmation?
Markets can swing, but your trading plan shouldn't.
🎁 Share your strategy and outlook for the week on Gate Square. Post to receive red packet rewards, with random drops of lar
post-image
BTC+0.95%
ETH+0.29%
  • 2
Gate Contract Meme Zone newly launched: $CLAUDIA
🔹 Trading pair: $CLAUDIA / $USDT
🔹 Trading hours: Now open
🔹 Supports 1 - 10x leverage, trading bots, and copy trading
A community Meme centered on Claudia, a virtual singer created by AI creator @anabology.
Trade $CLAUDIA: https://www.gate.com/zh/futures/USDT/CLAUDIA_USDT
More details: https://www.gate.com/zh/announcements/article/102284
GateLaunch
Gate Contract Meme Zone newly launched: $CLAUDIA
🔹 Trading pair: $CLAUDIA / $USDT
🔹 Trading hours: Now open
🔹 Supports 1 - 10x leverage, trading bots, and copy trading
A community Meme centered on Claudia, a virtual singer created by AI creator @anabology.
Trade $CLAUDIA: https://www.gate.com/zh/futures/USDT/CLAUDIA_USDT
More details: https://www.gate.com/zh/announcements/article/102284
repost-content-media
  • 2
  • 1
#NEARJumpsNearly10%
NEAR Protocol Rally: Is This the Start of the Next Leg or a Pause Before a Pullback?
NEAR has been one of the strongest large-cap Layer 1 tokens over the past few months, and today's move toward the 10 percent range has pulled it back into the center of trader attention. Trading around $5.19 to $5.25 at the time of writing, the token has now climbed from below $2 in early August to above $5 in September, and it has spent the weeks since then testing the $5.00 to $6.00 zone. Before deciding what to do, it helps to understand what is driving the move, what the chart is sayin
Sakura_3434
#NEARJumpsNearly10%
NEAR Protocol Rally: Is This the Start of the Next Leg or a Pause Before a Pullback?
NEAR has been one of the strongest large-cap Layer 1 tokens over the past few months, and today's move toward the 10 percent range has pulled it back into the center of trader attention. Trading around $5.19 to $5.25 at the time of writing, the token has now climbed from below $2 in early August to above $5 in September, and it has spent the weeks since then testing the $5.00 to $6.00 zone. Before deciding what to do, it helps to understand what is driving the move, what the chart is saying, and where the risks sit.
Start with the flow story. Bitwise launched a US spot exchange-traded fund for NEAR under the ticker NRR on NYSE Arca. The fund has been recording steady inflows, including a second consecutive weekly inflow of more than $13 million. ETF inflows matter for a token like NEAR because they represent regulated, institutional demand that does not rely purely on retail speculation. They do not guarantee price appreciation, but they tend to add a floor under the market during consolidation periods and can extend rallies when they accelerate.
The second driver is product activity. NEAR Intents, the protocol's cross-chain intent-based transaction layer, has seen its confidential total value locked rise to roughly $167 million. Intents are the kind of fundamental development that bulls point to when arguing the rally is backed by usage rather than hype. Usage metrics support that argument. Daily active users on the NEAR network reportedly rose from about 110,000 in September to nearly 257,000 more recently, reversing much of the decline seen earlier in the 90-day window. Rising users, rising TVL and rising ETF demand are a combination that gives the bull case real substance.
Now the price structure. The daily chart shows NEAR completing a powerful rally from below $2 in August into the $5 to $5.50 band in September. Price then consolidated in that range for several weeks, tested the upper boundary repeatedly, and pulled back to around $4.65 before recovering. The more recent push carried the token to a rejection near $5.97 to $6.00, which has been the key ceiling on the weekly chart. A weekly candle later closed back near $5.09 after dropping about 13 percent over that period, which is a reminder that the zone above $5.90 is still a supply area.
On the one-hour chart, the trend structure is bullish. Price is holding above the 30-period, 120-period and 200-period exponential moving averages, which sit near $5.16, $5.12 and $5.14 respectively on the one-hour timeframe. The relative strength index is in neutral territory near 56, which means momentum is constructive without being overbought. That matters: an overheated RSI after a fast move usually precedes a pullback, and today's reading does not yet show that stress.
The four-hour chart is more mixed. Price remains above the four-hour 50-period moving average, which sits around $5.19, while the 200-period average is much lower near $4.29. That gap is useful: it suggests the longer-term trend is up, but the short-term structure is still digesting the last impulse. A four-hour close back below $5.10 would weaken the near-term setup and shift attention to lower supports.
Derivatives data adds another layer. Open interest has increased by roughly 20 percent over the past 24 hours, to around $1.58 billion. Funding rates are slightly positive at about 0.005 percent, which indicates longs are paying shorts but not aggressively. The long-short ratio is above one, showing more traders positioned for upside, and roughly $43 million in liquidations were recorded over the last 24 hours, split between longs and shorts. Rising open interest during a rally generally means new money is entering, which supports trend continuation. It also means the market becomes more fragile if price breaks down, because leveraged longs can be forced to sell into weakness.
Turning to levels, the most important support sits between $5.10 and $5.13, where the one-hour moving averages cluster and where recent intraday buyers have defended the price. Below that, $5.00 is a psychological level and a prior consolidation floor. Beneath that is the $4.65 pullback low, which marks the most recent swing low on the weekly-scale pullback. The four-hour 200 EMA near $4.29 is the deeper line that bulls need to protect for the medium-term structure to remain intact.
On the upside, $5.44 is the 24-hour high and the first near-term resistance. The more significant barrier is the $5.97 to $6.00 zone, which has produced rejections and now sits at the top of a multi-week range. A confirmed daily close above $6.00, ideally on rising volume, would be a meaningful breakout and would open the path toward the $7 to $8 area that some analysts have cited as the next major target. Longer-term price targets circulating in the market are considerably more aggressive, but those are speculative forecasts rather than technical conclusions, and they should be treated with caution.
Let us think about the trade rather than the narrative. The entry quality matters more than the direction alone. Buying near $5.40 to $5.50 after a fast 10 percent move places a trader close to the 24-hour high and well above the one-hour moving averages. The stop loss in that case would need to be wide, and the reward to the $6.00 resistance is modest relative to the risk. That is a chasing entry, and it tends to produce poor outcomes in volatile markets.
A cleaner approach for a swing trader is to wait for a pullback into the $5.10 to $5.15 zone, which overlaps the one-hour moving averages and the short-term support. A stop placed below $4.95 keeps the invalidation clear: if price closes below that level, the short-term structure has broken and the setup is no longer valid. A target near $5.90 to $6.00 offers a reasonable reward-to-risk profile, while a break above $6.00 on volume could justify holding for a larger move.
For breakout traders, the signal is a daily close above $6.00 with volume confirmation. Waiting for that close avoids the common trap of buying an intraday spike that fails within hours. A retest of the $6.00 level as new support after a breakout would strengthen the case further. Breakout traders should also be prepared for a fast retracement, since the last rejection at that level was sharp.
Risk management deserves emphasis. NEAR has already risen roughly 150 percent in a matter of weeks, and crypto assets with that kind of run commonly retrace 20 percent or more before the next leg, even within a healthy uptrend. Position sizing should assume that a sharp pullback is normal rather than exceptional. Using a fixed percentage of portfolio risk per trade, rather than a fixed dollar amount, helps keep losses manageable regardless of how volatile the market becomes. Avoid putting a large share of capital into a single leveraged position, especially with open interest elevated.
There are also several risks to the bullish thesis that are worth monitoring. A slowdown in ETF inflows would remove one of the key institutional supports. A broader crypto market correction would likely drag NEAR lower regardless of its fundamentals, since altcoins tend to amplify Bitcoin moves in both directions. A failure of Intents TVL to keep growing, or a decline in daily active users, would weaken the adoption argument that underpins the rally. Finally, the rejection at $5.97 to $6.00 has shown that sellers remain active at that level, and any repeated failure there could trigger profit-taking from earlier buyers who entered during the August and September run.
What would change the outlook? A bullish reversal of the current view would require NEAR to reclaim and hold above $6.00 on a daily close, supported by continued ETF inflows and rising network activity. A bearish reversal would be signaled by a close below $5.00 followed by a failure to recover the $5.10 to $5.15 zone, which would open the door to a retest of $4.65. A deeper breakdown below $4.65 would challenge the medium-term trend and would likely be accompanied by a cascade of liquidations given the current leverage.
The honest conclusion is that NEAR has a constructive setup. Trend structure, fund inflows, improving network usage and a neutral momentum reading all point to a market that still has room to run. At the same time, the rally has been fast, the key resistance at $6.00 has rejected price before, and open interest is building. That combination favors patience and discipline over chasing. For most traders, the highest-quality opportunity is likely to come from a controlled pullback rather than from buying strength at the top of a short-term move.
This is market analysis for educational purposes and is not financial advice. Prices, flows and data points can change quickly, and every trader should set their own risk limits, verify information independently, and only commit capital they can afford to lose.
  • 1
  • 1
Last night, I locked in an entry at 81004; woke up to the market holding steady at 82581!$ETH
The planned profit was safely banked; nailing the timing makes it this smooth.#Gate两大币种合约成交额跻全球前三
ETH+0.27%
Anthropic Sets Aside 5% of Its Equity to Establish a Public Benefit Fund; Musk Asks: Why Not Distribute the Shares Directly to the Public?
On October 19, Anthropic announced the creation of the Anthropic Public Benefit Fund, initially funded with 5% of the company’s equity. As the company’s valuation grows, the fund may receive additional shares, with a target size of about 20% of the company.
Musk responded shortly afterward, suggesting that the shares be distributed directly to the public and saying he was also planning to do so. However, the details of his proposed distribution plan and how
post-image
Market price update
live-cover
LIVE1,968
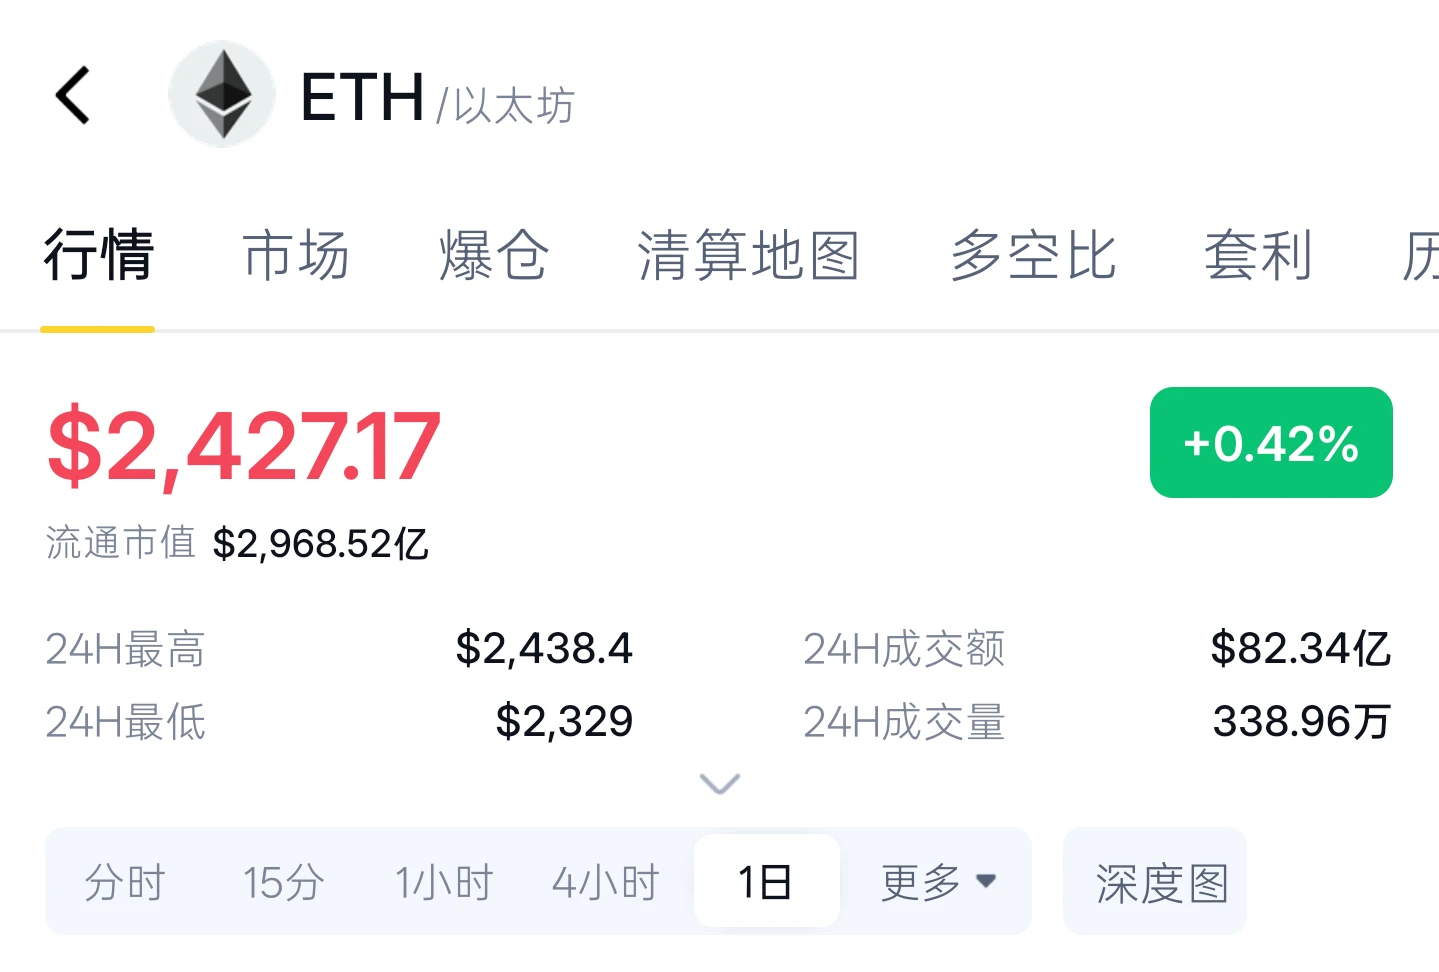
ETH is showing a weak recovery today. After dipping to the short-term support around 2390 in the early session, it rebounded slightly and is currently quoted at 2422. The rebound is notably weaker than BTC, with highs clearly stepping down, and the overall market remains under pressure and range-bound.

On the daily chart, the price is trading below the 5-day and 10-day moving averages, while the short-term moving averages are bearishly aligned and acting as resistance. The MACD green bars continue to expand, and the RSI is hovering in the neutral-to-low range. Bulls lack volume support. On t
post-image
ETH+0.29%
BTC+0.95%
$XAU
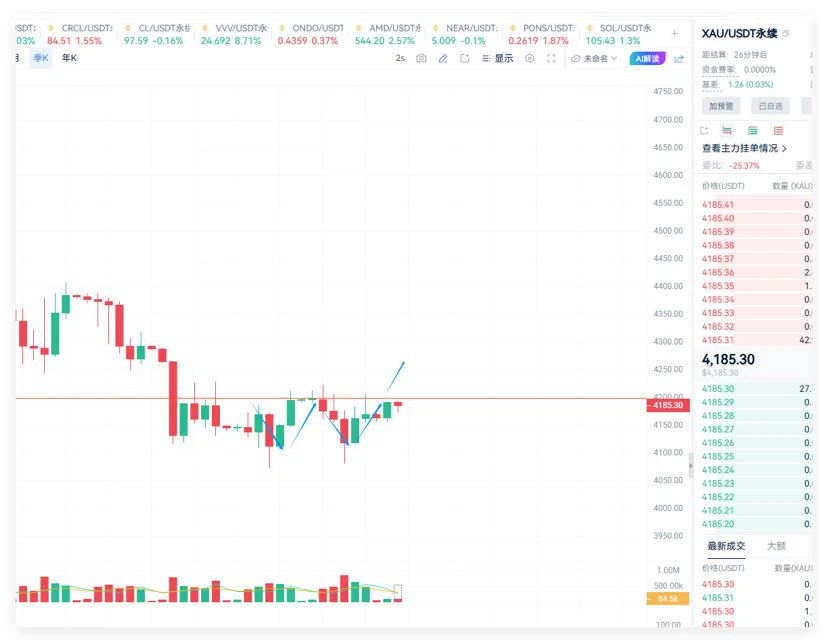
Gold has been range-bound for a long time; the key question is whether it can break above 4200!
The daily chart has formed a setup worth taking a bet on. #比特币短线站上8.2万美元
post-image
XAU+0.44%
10.19 Bitcoin's oversold rebound continues amid volatility; Ether rises on support from the three-day line, with 2,500 as key resistance $ETH
ETH+0.27%
Load More

Join 40 M users in our growing community

⚡️ Join 40 M users in the crypto craze discussion

💬 Engage with your favorite top creators

👍 See what interests you

Trending Topics

StakeLaunchPoolToShare2.8M$DNA

36.47k Views650 Discussing

Gate LaunchPool’s DNA debut campaign is now live with a total reward pool of 2.8M $DNA. Stake $BTC, $ETH, or $DNA to participate, with rewards distributed hourly. If you’re looking for a simple way to join a new-token opportunity. [👉 Join Now](https://www.gate.com/launchpool/554)

GateWCTCS9GlobalTradingCompetition

37.93k Views6.86k Discussing

BitcoinTops$82K

6 Views2.54k Discussing

View More