





Share your thoughts
placeholder
Article

After missing the first wave of the decline, I did not chase the short. I waited until $SUI rebounded to around 0.7630 and clearly weakened before entering the short, avoiding repeated wicks at a key level.
After entry, it moved sideways for a while, with no sign of the bulls taking the initiative to counterattack. The hourly moving averages gradually converged into a bearish alignment, while each rebound reached a lower level than the previous one. Before the moving-average structure turned bullish, I chose to continue holding the short.
The actual drop came faster than I expected, followed b
post-image
SUI-2.14%
BTC-0.04%
ADA-1.58%
#ShareWeekly
XRP/USDT is trading near $1.35–$1.39, consolidating directly around its 200-day Exponential Moving Average (EMA) near $1.355. Following an August expansion toward the $1.45 region, short-term momentum has decelerated into a range-bound structure as traders de risk ahead of key macroeconomic events, including the mid September FOMC decision.
Derivatives open interest currently sits near 2.17 billion XRP, indicating a decline in speculative leverage that reduces short-term cascade risks while market participants wait for a directional trigger.
Key Technical Levels
The 14-day Re
post-image
XRP+0.07%
  • 3
  • 1
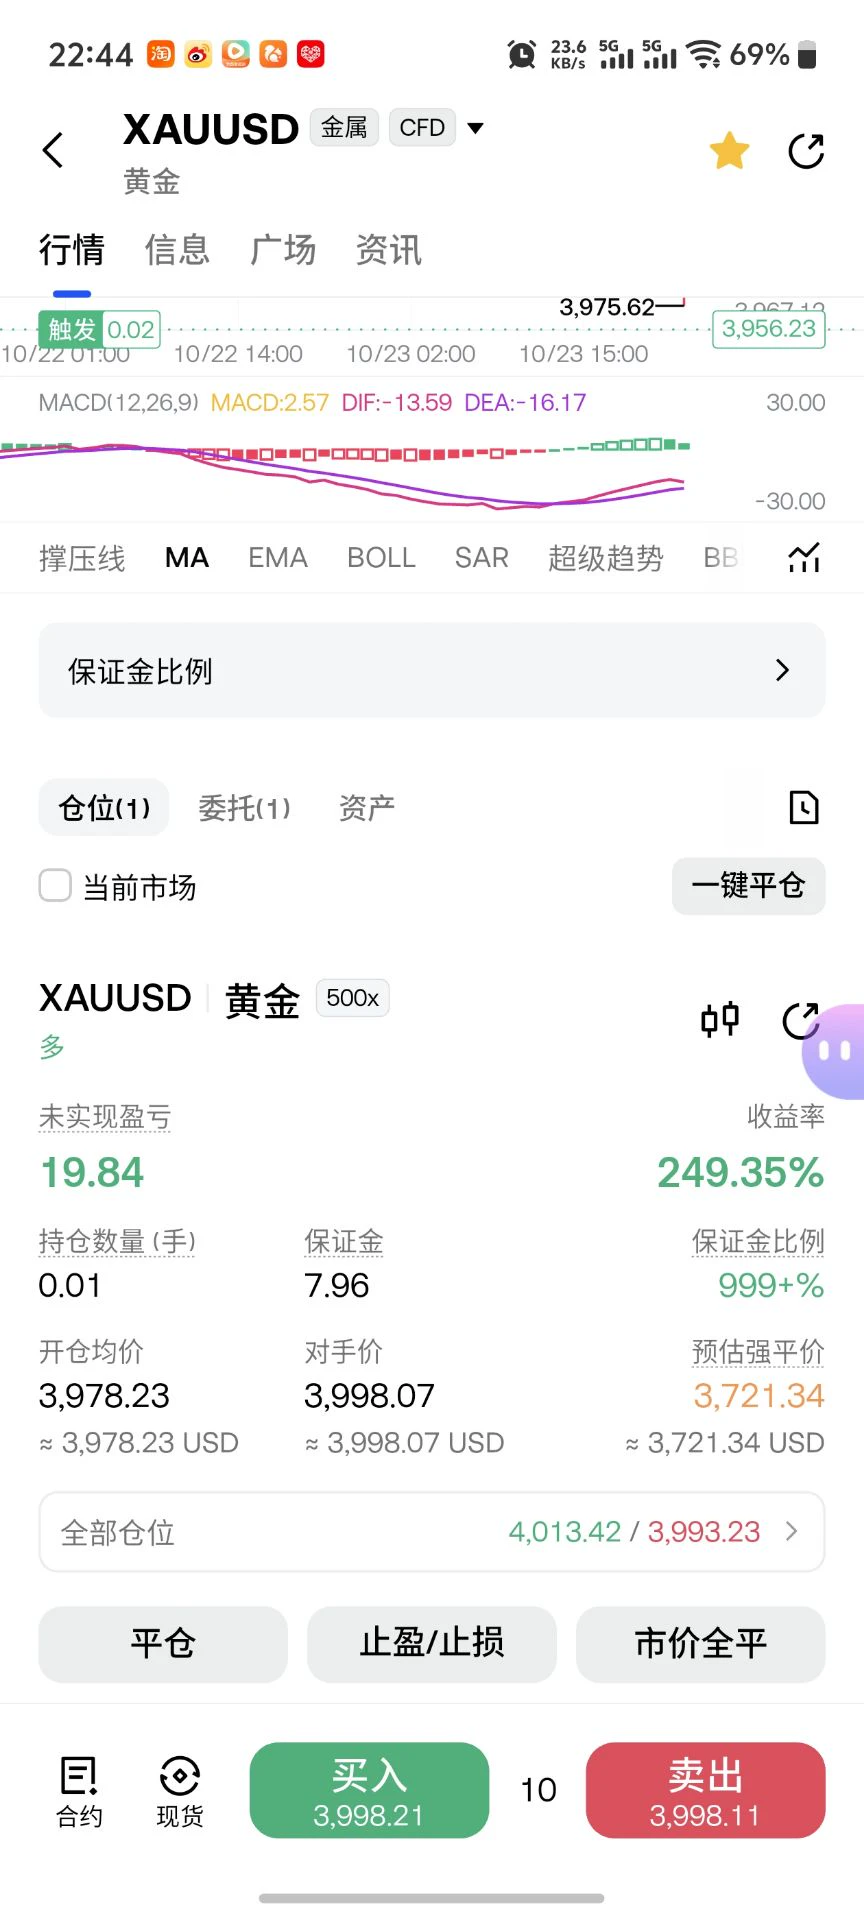
This return makes me nervous, and I’m worried the market will come to its senses tomorrow and blacklist me. During the repeated intraday swings, $XAU /XAU hit a wall every time it tried to push higher. The resistance above was obvious—there was simply no one buying up there, and volume kept shrinking. I deliberately waited for two candlesticks to confirm it couldn’t break through before trying a short position around 4510.00.
Now it’s at 4357.68, with floating profit at +313.79%. It feels great—after grinding for so long, these few candlesticks made it all back.
I’ve taken the profit first and
post-image
XAU+0.76%
DOGE-0.06%
SNDK-3.45%
A few days ago I was still calculating whether I had enough money for instant noodles this month; this morning I was already wondering whether to add sausage.

When the market got going this morning, $GIGGLE pushed higher for a wave. I saw that volume had shrunk pitifully, nowhere near what it was a few days ago. With insufficient buying support, this kind of rebound is just going through the motions. So I placed the short order directly at 37.84 and waited for it to perform on its own.

Just now, I saw 34.6 pull back into the target range. +412.34% secured—feels good, guys.

I caught the
post-image
GIGGLE-0.17%
DOGE-0.06%
XRP+0.06%
$SAGA This 14-point bearish candle was created with my own real money.
Yesterday at 0.0186, I cleared half my position and bought it back at 0.0160 today. This isn’t hindsight—the market signals had been obvious three days ago: it failed to break through around 0.019 four times in a row, while volume shrank below 80M, a classic sign of market makers trading among themselves to distribute. Look at the 24h trading volume of 53.2M, nearly 40% below the peak. Retail investors were still dreaming of a breakout, so I locked in my profits first.
Here’s the trading strategy: First, push up the price t
SAGA-13.18%
$BTC Bitcoin's sister-in-law has led the bros to profits😀
#8月核心CPI超预期
BTC-0.04%
Everyone chasing the bounce while DOGE quietly sets up for another drop.

$DOGE /USDT - SHORT

Trade Plan:
Entry: 0.08426 – 0.08484
SL: 0.08730
TP1: 0.08249
TP2: 0.08111
TP3: 0.07904

Why this setup?
Why now? The 1h price sits at 0.08455 inside a tight range, and the 15m RSI reading of 47.86 shows balanced but slightly bearish momentum that favors sellers. The 1h ATR of 0.001147 tells us volatility is compressed, so a break from the entry zone between 0.08426 and 0.08484 could accelerate fast. With the daily trend stuck in a range, the first target sits at 0.08249 and the second lies at 0.0
DOGE-0.06%
Everyone watching SYMBOL for a breakout, but the real move is hiding below.

$ETH /USDT - LONG

Trade Plan:
Entry: 2528.72 – 2545.18
SL: 2457.98
TP1: 2596.18
TP2: 2635.66
TP3: 2694.89

Why this setup?
Why now? The daily trend is bullish, setting a higher-timeframe backdrop for upside, while the 1h ATR of 32.90 shows the market is active enough to fuel a swift push from the entry zone at 2536.95. The 15m RSI sitting at 45.66 signals room to run before overbought conditions, aligning with a target of 2596.18 for TP1 and 2635.66 for TP2. The invalidation level at 2449.86 is the hard line in th
ETH+2.50%
I would expect something liken this for $ETH .
Everyone losing their minds over inflation, hikes, OIL, war, clarity...
It doesn't matter bros.
The chart is telling you how all of that news is being interpreted.
Crypto is back in a bull market, that's it.
We're gonna get chop, we're gonna get swings...
But the regime has changed and higher is now the play.
Don't get shaken out.
post-image
ETH+2.51%
$MU /USDT is about to break range and crash 4% in hours

$MU /USDT - SHORT

Trade Plan:
Entry: 973.24 – 977.20
SL: 994.19
TP1: 961.00
TP2: 951.51
TP3: 937.29

Why this setup?
Why now? The 1h price sits at 975.22, a precise entry_ref inside the 973.24 to 977.20 zone, while the daily trend remains range-bound, setting up a sharp move. The 15m RSI at 43.0 confirms bearish momentum is still fresh, not yet oversold. The 1h ATR of 7.902302 means a single candle can cover the distance to TP1 at 961.00, and a second wave targets TP2 at 951.51. The invalidation level at 1005.10 is the line in the sa
MU-0.32%
#ShareWeekly
Cluster Protocol $CP is an open source, decentralized AI (DeAI) infrastructure layer built on the Base blockchain. Positioned as the "GitHub for AI models," Cluster Protocol unifies distributed GPU compute, tokenized dataset marketplaces, and model inference into a single trustless ecosystem. By combining privacy preserving cryptography with machine to machine payment rails, the protocol offers a open, permissionless alternative to centralized AI monopolies.
The native $CP token functions as the core economic settlement engine across the entire protocol. Every inference call,
post-image
CP+7.54%
  • 3
Everyone is about to watch $H /USDT get crushed below the daily trend.

$H /USDT - SHORT

Trade Plan:
Entry: 0.08303 – 0.08393
SL: 0.08782
TP1: 0.08022
TP2: 0.07805
TP3: 0.07479

Why this setup?
Why now? The 1h price is hovering at 0.08353 inside a bearish 1D trend, the 15m RSI is stuck at 59.43 showing weak momentum, and the 1h ATR of 0.00181 tells us volatility is compressed before a move. The entry zone sits between 0.08303 and 0.08393, giving a precise trigger near 0.08348. If momentum turns, TP1 is 0.08022 and TP2 is 0.07805, while the invalidation level at 0.08109 is the line in the s
H+3.67%
#交易机器人 I’m using the STORJUSDT futures grid bot on Gate, with a total return of +931.90% since creation. Follow along and profit.
post-image
today live markets informations
live-cover
LIVE441
I didn’t watch the charts or think about it—it moved on its own, as if it were working overtime for me.

The last thing I saw before bed was $PROM , with funds quietly flowing in and the bids below unusually thick. I only said one thing: no need to panic at this level. When I opened the chart first thing in the morning, it had already completed the move I wanted to see.

From 2.212 to 5.173, +6462.01% was sitting right there. I took 80% off the table first and placed the remaining 20% at the entry price for protection.

The market is waited out, and profits are held onto. Take another look w
post-image
PROM-6.39%
BTC-0.04%
ZEC+2.30%
On this $BNB trade, I took profit near the target instead of chasing the final acceleration. Volume has clearly contracted, lowering the probability of another push higher; the biggest risk was watching unrealized gains go through another roller coaster ride.

Looking back at the entry logic: The price pulled back to the platform near 701.00, and the four-hour candle closed with a long lower wick, making the shift between bulls and bears fairly clear. I entered with a 30% position to test the waters and held after it stabilized.

During the rally, I originally planned to sell 70% first, but
post-image
BNB+1.19%
DOGE-0.06%
ZEC+2.30%
Don't Just Look at the Top Three
Gate entering the global top three for RWA perpetuals is certainly worth applauding, but what is truly worth studying is the trend behind it. CoinDesk data shows that Gate's RWA perpetual trading volume reached $64.7 billion in August, surging 158% month-on-month, with its market share rising to 12.6%; during the same period, total RWA perpetual trading volume on centralized exchanges reached $602 billion.
This shows an interesting shift taking place: Crypto users are no longer satisfied with trading only cryptocurrencies, and traditional financial assets such
  • 27
Nobody is talking about this hidden XRP weakness yet.

$XRP /USDT - SHORT

Trade Plan:
Entry: 1.3605 – 1.3701
SL: 1.4117
TP1: 1.3305
TP2: 1.3074
TP3: 1.2726

Why this setup?
Why now? The 1h price is pinned at 1.3653 inside a tight range, the 15m RSI sits at 50.3 showing no momentum, and the 1h ATR of 0.019313 confirms compression before a move. This sets up a SHORT entry between 1.3605 and 1.3701 with TP1 at 1.3305 and TP2 at 1.3074, while the daily range bias keeps sellers in control. The invalidation level of 1.4029 is the hard line that would wipe the trade out.

Debate:
Are we hitting
XRP+0.06%
#每周来晒 #8月CPI数据出炉
August CPI Is Not a Green Light — It Is a Market Test
The August CPI report has arrived, and in my view, the most important part is not whether inflation “beat” or “missed” expectations. The real question is how markets interpret the combination of slowing annual core inflation, stronger monthly price pressure, elevated Treasury yields, and the Federal Reserve’s increasingly difficult policy decision.
Headline CPI increased 0.4% month over month, accelerating significantly from July’s 0.1%. On an annual basis, CPI remained at 3.4%, exactly matching expectations. Core CPI, whi
Load More

Join 40 M users in our growing community

⚡️ Join 40 M users in the crypto craze discussion

💬 Engage with your favorite top creators

👍 See what interests you

View More