


Square
Following
Hot
News
Profile
Share your thoughts
placeholder
Article
#现货黄金收复CPI后跌幅 Spot Gold’s Post-CPI Recovery: A Systematic Assessment of Sentiment Reversal and Trend Signals
I. Market Characterization: Short-Term Sentiment Recovery Dominates, With No Entry Into a New Uptrend Yet
Gold’s rapid recovery of all losses after the CPI data proved negative and prices dipped to $4,073 is essentially a technical sentiment recovery after the bearish news was fully priced in, rather than a signal that a trend reversal has begun.
Prices are still trading within the core $4,080-$4,150 range and have not effectively broken through the key resistance above, lacking the str
XAUUSD+0.86%
  • 2
$US Just bought the dip in the spot market, picked up some money
post-image
US-24.77%
#美国9月CPI超预期
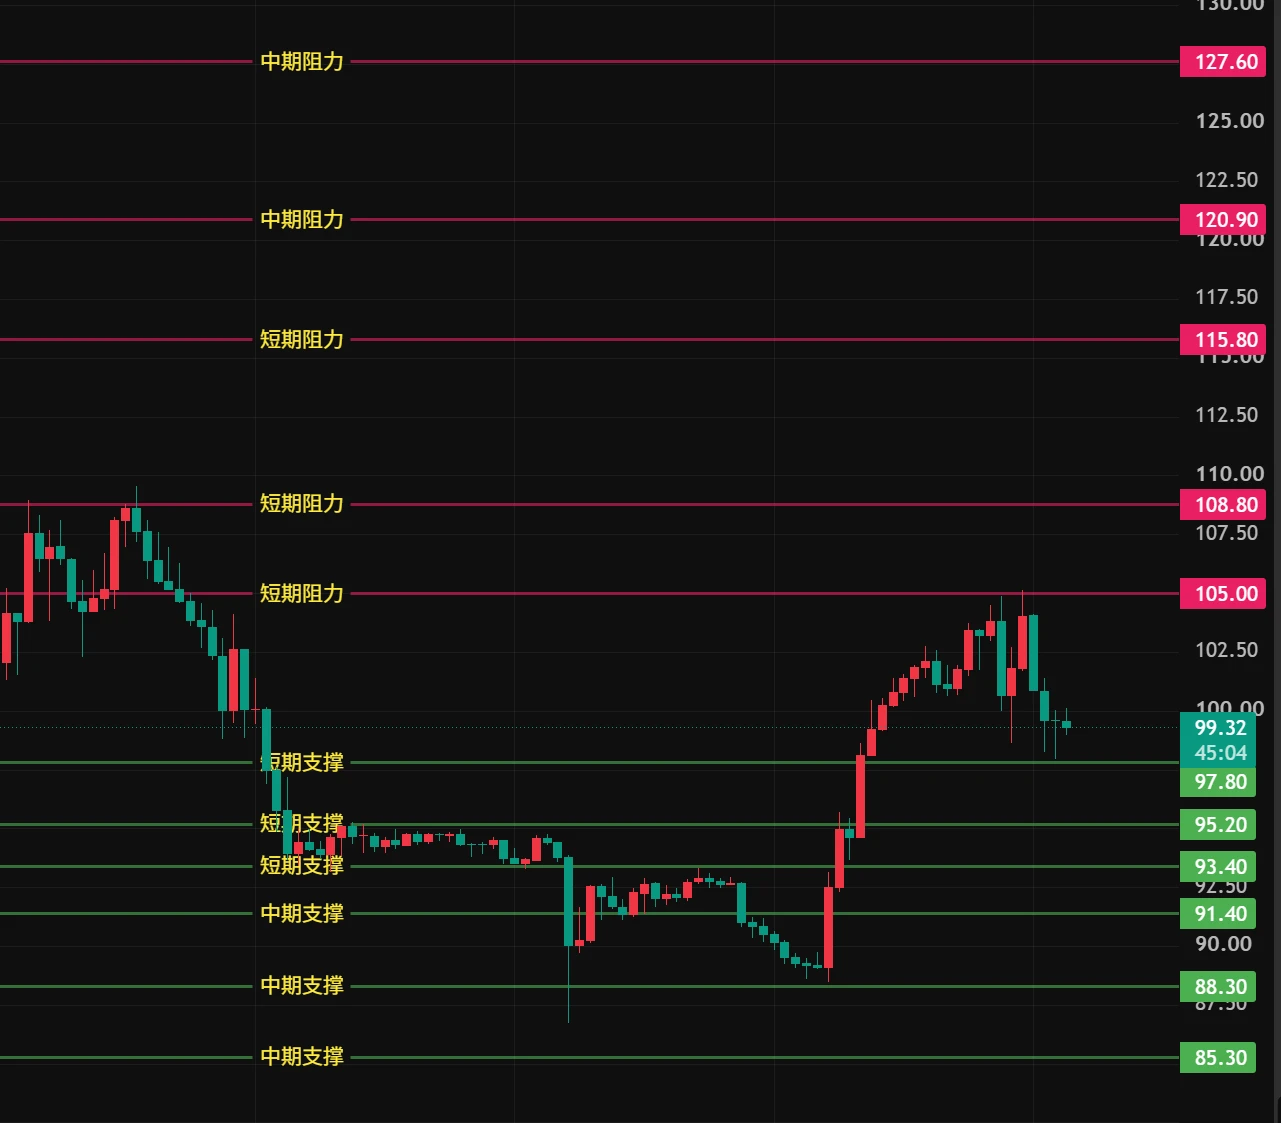
My SOL short at 117.23 is now deep in profit at the current price of 102.29; 108.67 determines the direction.
Market: After retreating from 113.40 on the 4H chart, it bottomed at 100.62 and has now broken below to 102.29 on heavy volume, with the moving averages exerting downward pressure and the bearish trend continuing.
Key levels: Support 100.62/98, resistance 108.67/113.40
Outlook: Resistance at 108.67 + break below 100.62 → target 98 → 95; hold above 108.67 → range-bound rebound; failure to break through → weak range between 100.62 and 108.67.
My SOL short at 117.23: First ta
post-image
SOL-4.61%
#SolanaMajorUpgradeScheduled ⚡ $AAPLAAPL342.98Stocks+0.47% ‌ | Solana Targets 150ms Transaction Finality With Alpenglow!
🚀 October 15, 2026 | A Major Milestone Ahead for $SOL
Solana is preparing for one of the biggest changes to its core network infrastructure. The upcoming Alpenglow upgrade is scheduled for October 21, 2026, aiming to make transaction finality dramatically faster and strengthen Solana’s position in high-speed blockchain applications.
This is more than a routine software update — it changes how Solana validators reach agreement across the network.
🔥 THE BIG NUMBERS
⚡ ~150 mi
AAPL+0.47%
SOL-4.64%
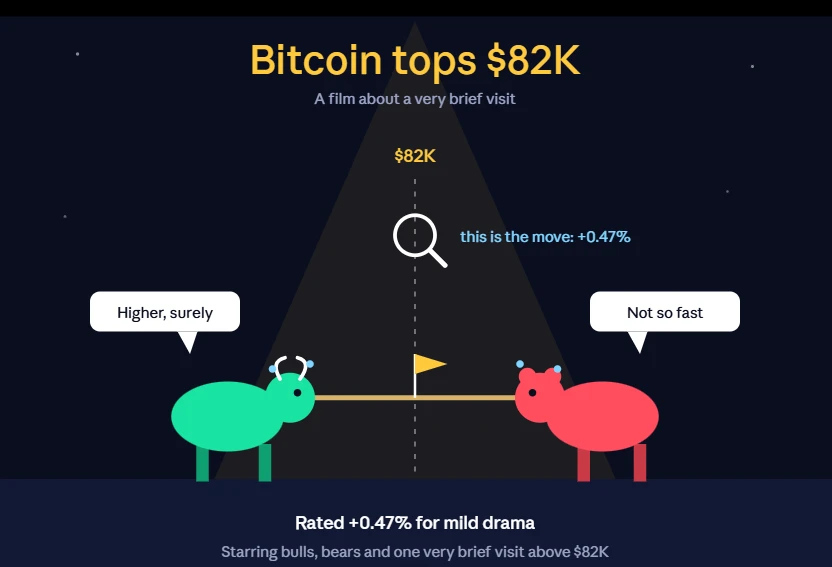
#BTC跌破8.2万 #CPI BTC BELOW $82K: PRICE FIRST, NARRATIVE SECOND
Bitcoin’s latest available Gate spot snapshot shows BTC/USDT at 80,938, down 2.96% over 24 hours, with a session range of 80,268–84,142.8. That puts BTC below the campaign’s 81K reference not comfortably holding above it. The immediate question is whether buyers can reclaim that area and sustain the recovery.
This is where trading discipline matters more than a convincing headline.
🔎 THE INFLATION BACKDROP
The September US CPI release reported headline inflation of 3.7% year-on-year and a 0.6% monthly increase. Core inflation, excl
post-image
BTC-3.00%
🤯 The gold/copper ratio cycle used to last ~1,000 days. This one? Almost 1,900 days — nearly DOUBLE. Copper just started outperforming gold WITHOUT the cycle resetting to the bottom. Mariano connects the dots at 9:56 in today's video.
📊 Chart idea: @CryptoCrewU
#Gold #Copper #Macro #Bitcoin #Crypto
post-image
XAU-0.30%
XCU-2.70%
BTC-3.00%
  • 1
Market Analysis: CPI Shock, ETF Outflows, and the Critical PPI Test Ahead
Macro backdrop: CPI came in hot, and the Fed is no longer a tailwind
U.S. September CPI rose 3.7% year-on-year, exceeding the 3.6% forecast, while core CPI hit 2.6% versus the 2.5% expected. This is the last major inflation reading before the Fed's October 27-28 policy meeting, and it has materially shifted rate expectations. According to CME FedWatch, the probability of a 25 basis point hike in October has jumped to 33.2%, up from 22.1% just a day earlier and 17.7% a week ago. For December, the market now assigns only a
[ NEW STREAMER] MARKET POSITION
live-cover
LIVE2,065
Market Analysis: CPI Shock, ETF Outflows, and the Critical PPI Test Ahead
Macro backdrop: CPI came in hot, and the Fed is no longer a tailwind
U.S. September CPI rose 3.7% year-on-year, exceeding the 3.6% forecast, while core CPI hit 2.6% versus the 2.5% expected. This is the last major inflation reading before the Fed's October 27-28 policy meeting, and it has materially shifted rate expectations. According to CME FedWatch, the probability of a 25 basis point hike in October has jumped to 33.2%, up from 22.1% just a day earlier and 17.7% a week ago. For December, the market now assigns only a
KatyPaty
Market Analysis: CPI Shock, ETF Outflows, and the Critical PPI Test Ahead
Macro backdrop: CPI came in hot, and the Fed is no longer a tailwind
U.S. September CPI rose 3.7% year-on-year, exceeding the 3.6% forecast, while core CPI hit 2.6% versus the 2.5% expected. This is the last major inflation reading before the Fed's October 27-28 policy meeting, and it has materially shifted rate expectations. According to CME FedWatch, the probability of a 25 basis point hike in October has jumped to 33.2%, up from 22.1% just a day earlier and 17.7% a week ago. For December, the market now assigns only a 9.1% probability to rates staying unchanged, with a 62.2% probability of a 25bp hike and a 28.7% probability of a 50bp hike. In other words, the market is pricing a near-certain tightening cycle into year-end, and risk assets are repricing accordingly.
Equities and risk sentiment: Korean chip rout signals broader de-risking
The selloff in semiconductor stocks has intensified, with SK Hynix now down 57% from its June peak, erasing over $660 billion in market value. The Korean stock index fell 7%, with SK Hynix dropping 10% and Samsung Electronics declining more than 9%. This is not an isolated event — it reflects a broader reassessment of AI-related demand and elevated valuations across the tech sector. When equity markets experience this kind of stress, capital tends to rotate out of high-beta assets like crypto. The dollar index has erased all gains recorded after the CPI report, and gold has almost fully recovered its post-CPI drop, suggesting that while inflation is hot, there is also demand for defensive positioning. For crypto, this environment removes the "weak dollar" tailwind that supported prices earlier in the year.
Regulatory headwind: Clarity Act stalls as key advisor departs
Patrick Witt, the White House Chief Crypto Advisor and Executive Director of the President's Advisory Council on Digital Assets, has concluded his term. Witt was the primary architect of the Clarity Act, which aimed to divide oversight authority for crypto markets between the SEC and the CFTC. His departure comes as the legislation stalls in the Senate, with no successor named and the House version already passed over a year ago. For the crypto market, this removes a key catalyst for institutional adoption and regulatory clarity. Without a clear framework, large traditional finance players remain hesitant to commit capital at scale, which reduces the pool of potential buyers during drawdowns.
ETF flows: Institutional capital is exiting, not entering
U.S. spot Bitcoin and Ethereum ETFs lost more than $1.22 billion in net outflows during the week of October 5-9, 2026. Bitcoin funds alone shed $681 million, ending three consecutive weeks of net inflows. BlackRock's IBIT recorded $65.4 million in net outflows on October 12, and single-day outflows peaked at $484.9 million on October 7. This is a critical shift in the supply-demand dynamic. Throughout 2025 and early 2026, ETF inflows provided a structural bid for BTC. Now, that bid has turned into a source of selling pressure. When combined with long liquidations, the result is the rapid decline from 90K-level discussions to the current 81K area.
Technical analysis of BTC charts
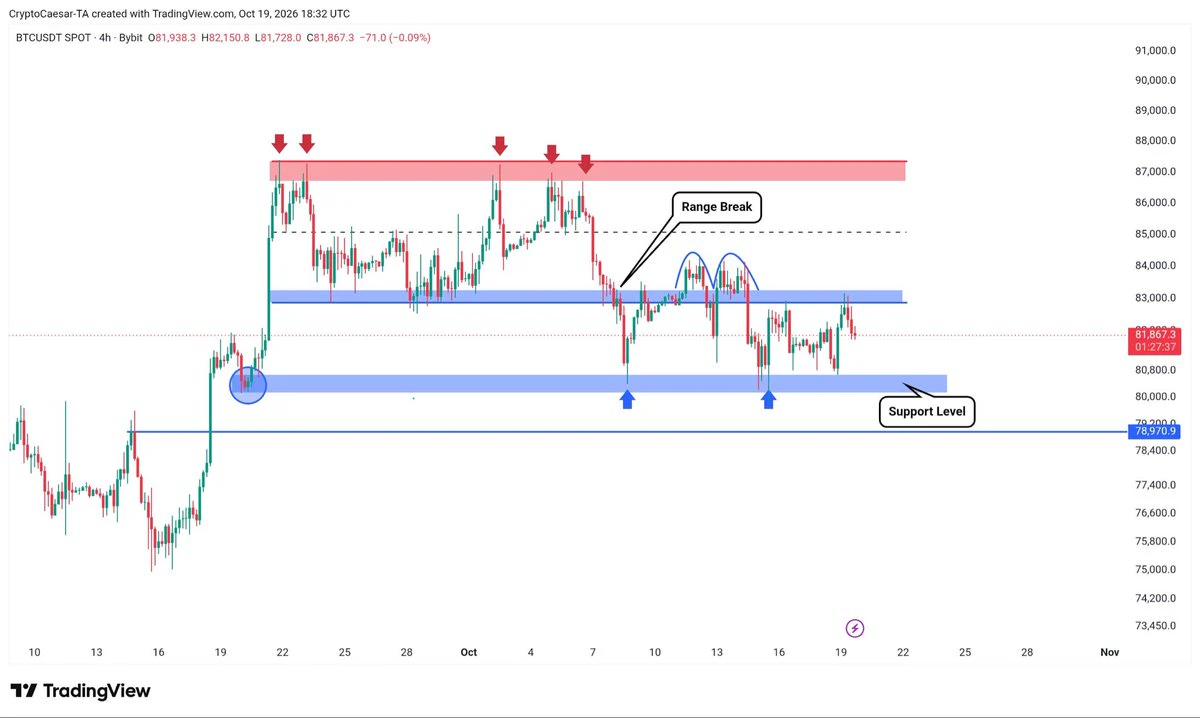
On the daily chart, BTC is trading near 80,959, having broken below the lower Bollinger Band at 80,796. The middle band sits at 83,649, and the 24-hour low is 80,161. The MACD on the daily is at -610.6, deep in negative territory, and the OBV at -2.6 million confirms sustained distribution. The daily candle structure shows a clear breakdown from the 83,000-84,000 consolidation zone, with the 81,000 level now acting as immediate support.
On the 4-hour chart, price is below the middle band at 82,796 and hovering near the lower band at 80,900. The MACD at -259.6 is bearish but the histogram is beginning to flatten, suggesting the selling momentum may be decelerating. The 80,161 low from the recent drop is the key level to watch.
On the 15-minute chart, the price has stabilized around 80,950 after the sharp drop. The MACD at -132 and DIF at -175.2 show the short-term oversold condition, but there is no clear bullish divergence yet. The volume profile shows elevated selling volume on the breakdown, with only modest buying interest at current levels.
The PPI catalyst: what to watch today
The Producer Price Index for September is scheduled for release today at 8:30 AM Eastern Time, with a consensus forecast of 0.6% month-over-month, up from 0.4% previously. PPI is a leading indicator of consumer inflation, and given the hot CPI print, the market will be watching closely for confirmation that pipeline pressures remain elevated. If PPI comes in at or above 0.6%, it reinforces the case for a Fed hike in October and could trigger another leg down in risk assets, with BTC potentially testing the 80,000 level. If PPI comes in below expectations, it may provide temporary relief and allow for a short-term bounce, but the broader macro trajectory remains hawkish.
Trade setup considerations
For traders looking at a potential setup, the key levels are as follows. On the downside, 80,161 is the immediate support; a break below this level opens the door to 79,445 and then the psychological 78,000 area. On the upside, the first resistance is the 4-hour middle band at 82,796, followed by the daily middle band at 83,649. A sustained reclaim of 83,000 would be needed to invalidate the bearish structure.
Given the macro backdrop — hot CPI, rising rate hike odds, ETF outflows, regulatory uncertainty, and equity market stress — the path of least resistance remains lower. A conservative approach would be to wait for the PPI release before committing capital. If PPI confirms inflation persistence, a short setup targeting the 80,000 breakdown with a stop above 82,500 could offer a favorable risk-reward. Conversely, if PPI surprises to the downside, a tactical long from the 80,000-80,200 zone with a tight stop below 79,800 could capture a relief bounce, but this would be a counter-trend trade in a clearly bearish environment.
The 81K level is the line in the sand. If it holds, the market may consolidate and wait for the next catalyst. If it breaks, the 80K test becomes the base case, and the broader downtrend remains intact.
#BTCBreaksBelow82K #USSeptemberPPIReleased #ShareWeekly
repost-content-media
🌟 Gate Live “Starlight Launch” Streamer Challenge is officially live!
10 “Rising Star Streamers” selected each week can unlock:
🎁 Gate exclusive premium merchandise gift box
🚀 Official traffic support
🏆 Weekly leaderboard honors
📌 Eligibility requirements:
✅ Joined Gate Live after 2026/1/1
✅ Complete valid livestreams on at least 3 different calendar days that week, with each session lasting at least 30 minutes
📅 Event period: October 14 — November 14
👉Event details: https://www.gate.com/announcements/article/102230
👉Start streaming now: https://www.gate.com/live
Start streaming now an
post-image
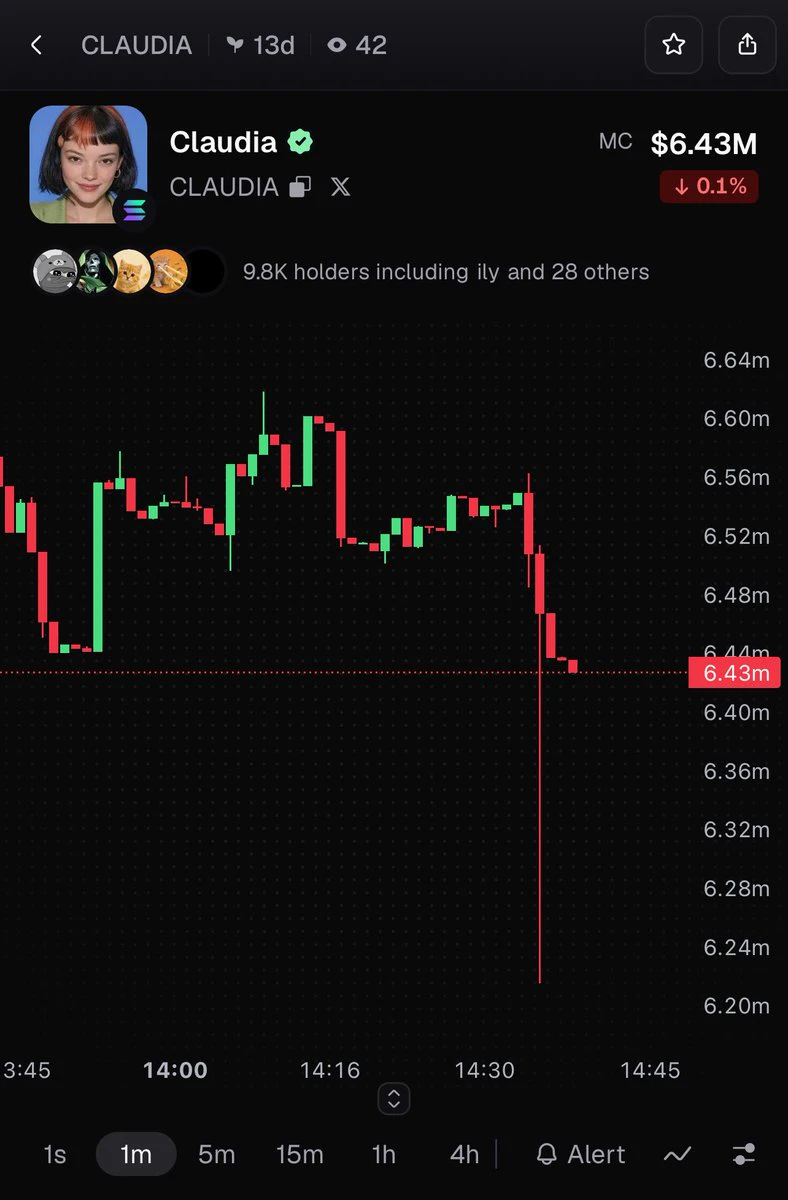
$US It lost a quarter of its value in one day, plunging directly from 0.0090 to 0.0063. This isn't a pullback; it's a free fall.
To put it simply, something you spent 90 yuan on yesterday is worth only 63 yuan this morning, and sellers are still lining up to dump it. The 24-hour trading volume is 71.7M—what does that tell us? It's not that nobody is buying; the buyers' hands are shaking. Such intense turnover is a typical panic-selling stampede, not normal shakeout.
Technically, 0.0090 was the high of this move, and now it's at 0.0064—rolling from the mountaintop to the foot of the mountain w
US-24.77%
When CPI came in above expectations, Bitcoin immediately crashed below $83,000. But after checking Injective’s on-chain data, I found that its development activity and on-chain interaction volume have both been steadily rising over the past two weeks. The chain focuses on decentralized derivatives trading, and the TVL of several recently launched protocols has been increasing. INJ was previously treated as an obscure project that nobody took seriously, but it has actually built up considerable substance in the Web3 finance niche. Whether this level can hold remains to be seen—check the tag bel
post-image
BTC-3.00%
INJ-11.36%
JTO-14.02%
TVL Doubles, but Does the Strategy Earn Twice as Much?
Pure example: Existing assets of $1,000, plus an additional deposit of $1,000, with no change in price; the portfolio size becomes $2,000, which does not mean a 100% gain.
The OWL V2 demo portfolio page presents TVL and NAV per unit separately. When reviewing performance, do not mistake capital inflows for investment profits.
Example excludes fees; the demo is not an official trading portal.
post-image
OWL-8.29%
ETH is currently priced at 2355; after rising to around 2530 yesterday and facing resistance, it moved downward, with the current low reaching around 2310, a 210-point decline.
The 4-hour chart continues to show a weak downward structure, with the price below the moving averages. This is weak consolidation after a decline; the rebound is merely corrective, and stabilization or a reversal has not yet formed.
On the 1-hour chart, short-term lows continue to move lower, rebound momentum is insufficient, and the RSI remains weak. If the rebound approaches the resistance zone, it is likely to face
post-image
ETH-5.84%
Morning Market Updates
live-cover
LIVE2,624
【ETF Alert】ETF: U.S. spot Bitcoin ETFs (October 14) recorded net outflows of $261 million (FBTC led with $153 million in outflows, while BITB saw $2.2 million in inflows against the trend) → Bearish. ① Inflation heats up, Fed rate-cut path impeded: U.S. inflation accelerated as energy prices rose (Beijing 13:27), the U.S. Dollar Index stood at 102.06 (-0.48%), and the U.S. 10-year Treasury yield was 5.190% (-3bp); ② Risk aversion: gold 4160.20 (+1.27%), WTI crude 94.12 (-1.02%); ③ Market: BTC is currently around $80,629, down 3.34% over 24h, with a range of 80268–84143; price movement is align
BTC-3.00%
BITB-1.81%
USIDX-0.42%
XAUUSD+0.86%
This month, going from $80,000 in the red to $80,000 in the green is like heaven and earth 😂
It’s truly one thought from heaven, one thought from hell!
post-image
  • 5
Stop talking nonsense and show me your position.
post-image
$US bought the dip, bought the dip, bet on a rebound, and jumped in
post-image
US-24.77%
  • 5
Load More

Join 40 M users in our growing community

⚡️ Join 40 M users in the crypto craze discussion

💬 Engage with your favorite top creators

👍 See what interests you

Trending Topics

USSeptemberCPITopsEstimates

36.62k Views2.68k Discussing

US September CPI rose 3.7% YoY, above the 3.6% estimate; core CPI rose 2.6%, also above the 2.5% estimate. With inflation topping forecasts across the board, how will rate hike expectations shift? How will BTC react? Share your view.

DrLinHanSpeaksAtOxfordUnion

135.44k Views1.86k Discussing

USSeptemberPPIReleased

91.13k Views1.73k Discussing

View More