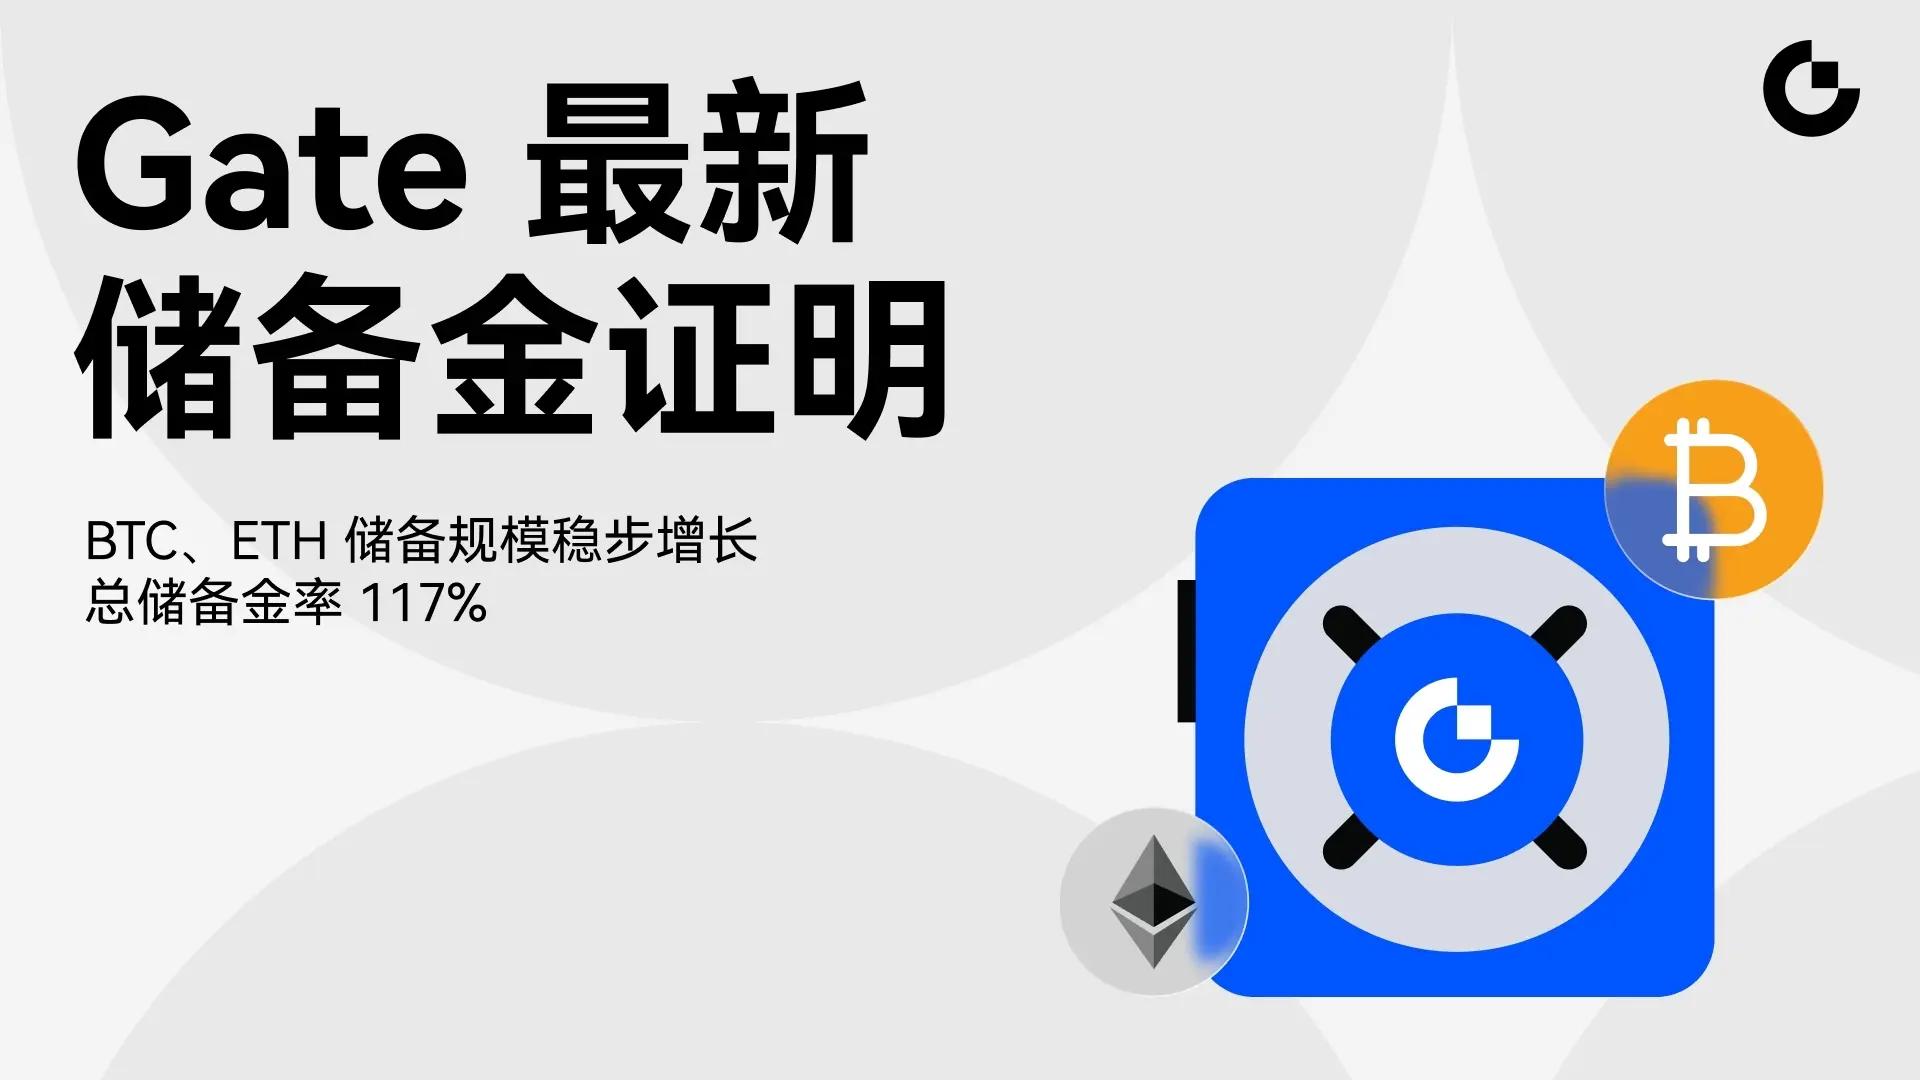
Share crypto content and earn up to 60% commissions through content mining.
placeholder
gatefun
#BitcoinETFSees7272BTCOutflow
Bitcoin ETF Sees 7,272 BTC Outflow: A Critical Moment for the Crypto Market
The cryptocurrency market is once again facing a period of intense discussion after Bitcoin Exchange-Traded Funds (ETFs) recorded a significant outflow of 7,272 BTC. While Bitcoin ETFs have been celebrated as a gateway for institutional investors to gain exposure to digital assets, large outflows often raise questions about market sentiment, investor confidence, and the future direction of Bitcoin's price action.
At first glance, a 7,272 BTC outflow may appear alarming. Such movements can
BTC-0.04%
post-image
post-image
  • Reward
  • 4
  • Repost
  • Share
Ryakpanda:
冲就完了 👊
View More
$SLX When the price was around 0.20317, we timely advised to short earlier. Currently, the coin has dropped to around 0.17444, with a profit of +278.43%. Friends who followed the advice should have already gained substantial profits. Operation suggestion: consider gradually taking profits at the current position. The market may experience technical fluctuations; do not chase extreme levels in trading. Lock in profits at the right time is the key. Friends who did not follow this operation do not need to rush; there will still be opportunities later. We will continue to monitor together, stay p
SLX-11.24%
BTC-0.06%
ETH-0.71%
View Original
post-image
  • Reward
  • Comment
  • Repost
  • Share
BTC Evening Trends
gate liveLIVE
88
  • Reward
  • Comment
  • Repost
  • Share
一身转战三千里 一剑曾当百万师@一单定乾坤
View Original
post-image
  • Reward
  • Comment
  • Repost
  • Share
Everyone’s long $MU /USDT—but the 4h chart just flashed a SHORT signal nobody saw coming.

$MU /USDT - SHORT

Trade Plan:
Entry: 876.28 – 882.42
SL: 908.82
TP1: 857.25
TP2: 842.51
TP3: 820.41

Why this setup?
RSI at 61.71 on 15m is stalling near resistance, and the 1D trend is range—not bullish. Entry ref 879.35 with TP1 at 857.25 gives a 2.5% drop before the breakout crowd wakes up. Why now? The 1h ATR of 12.28 means volatility is tight, and shorts thrive when momentum fades into a range top.

Debate:
Is 879.35 the fake pump before the flush to 842, or are we early on the squeeze?
MU1.61%
post-image
post-image
  • Reward
  • Comment
  • Repost
  • Share
$BLUAI Signal】Long 1H oscillation correction + 4H bullish trend continuation
$BLUAI Funding rate 0.0218%, long position cost is relatively high. 1H MACD death cross expands, price repeatedly tests around the Bollinger middle band at 0.0177. 4H MACD golden cross but bars contract, trading volume declines simultaneously. Market depth is -27.98%, sell orders are relatively thick. Personal assessment: current risk-reward ratio is 1.5, tight stop-loss, there is still buying support below, suitable for small stop-loss betting on rebound continuation.
🎯Direction: Long
⚡Entry/Order: 0.01768180
BLUAI21.71%
BTC-0.04%
ETH-0.68%
View Original
post-image
  • Reward
  • Comment
  • Repost
  • Share
Everyone thinks ETH is bottoming—here’s why ETH is about to drop another 6%.

$ETH /USDT - SHORT

Trade Plan:
Entry: 1558.59 – 1568.59
SL: 1611.60
TP1: 1527.58
TP2: 1503.58
TP3: 1467.57

Why this setup?
• 1D trend is bearish, and the 4h MTF confirms SHORT with 95% confidence.
• RSI on 15m at 54.71 shows no oversold bounce—just a dead cat.
• Entry zone is 1563.59, with TP1 at 1527.58 and TP2 at 1503.58—that’s a quick -2.5% to -4%.
• ATR on 1h is 20.00, meaning volatility is tight—breakdown is imminent.

Debate:
Are you shorting ETH into TP2 or waiting for a fakeout bounce?
ETH-0.71%
post-image
post-image
  • Reward
  • Comment
  • Repost
  • Share
#HYPE Pulls Back After Approaching $65!
HYPE has stabilized between $57 and $59 after pulling back from the $65 region.
In the short term, the falling wedge seen on the chart keeps the possibility of a recovery for $HYPE on the agenda.
If the $56-$58 support zone holds, the market may test the upside again.
Following the strong rally earlier in the year, eyes are now on the $65 resistance.
HYPE slowed down after the previous rise, trading between $57 and $59. The intraday loss exceeding 7% at one point indicated a noticeable short-term cooling in the market. Analysts are evaluating this perio
HYPE-5%
post-image
post-image
  • Reward
  • 5
  • Repost
  • Share
BlackBullion_Alpha:
Bull Run 🐂
View More
What are your hobbies?
Me (A technical analyst) : Finding fractals that enrange people.
#BTC
BTC-0.04%
  • Reward
  • 1
  • Repost
  • Share
Nasreen:
Welcome to Gboard clipboard, any text you copy will be saved here.
#分享美股交易赢英伟达股票
Deep Analysis of Intel's Stock Price
Intel closed Friday at $99.17, down 11.28% for the day, with a pre-market decline of 2.29% to $96.9. This plunge is a continuation of last week's broad sell-off in the U.S. semiconductor sector, making it one of Intel's largest single-day drops of the year. Previously, Intel's stock had surged over 145% since April, and after rapid valuation increases, concerns over the sustainability of AI demand triggered profit-taking, coupled with pessimism from Micron Technology's single-day drop of over 13%, leading to a significant pullback in Intel's
View Original
post-image
  • Reward
  • Comment
  • Repost
  • Share
$MBOX Short position strategy executed ✅
📉 From 0.010935 → 0.007085, a decline of over 35.21%, the short position strategy is perfectly validated.
🔒 Here are the operational suggestions:
1 Close 80% to lock in the main profit;
2 The remaining 20% can be held further, decide based on market strength;
3 Move the stop-loss up to the cost price to ensure breakeven operation and prevent profit reversal.
⏳ Market opportunities are constantly emerging, friends who haven't entered the market, stay calm and wait for the next high-probability signal.
$BTC $ETH
MBOX-22.42%
BTC-0.06%
ETH-0.71%
View Original
post-image
  • Reward
  • Comment
  • Repost
  • Share
$PI Can I still take the call?
PI2.24%
View Original
post-image
post-image
  • Reward
  • Comment
  • Repost
  • Share
Accurate prediction, perfectly riding the wave! $HIGH Key position at 0.1302 directly leads the team to open short positions for everyone, controlling the rhythm in advance, with precise and correct direction. The market has been fluctuating downward, now falling to around 0.0805, directly capturing +751.60% substantial profit, and all the family members following have secured big gains. Now focus on controlling profits, operate uniformly: first take profit on half to lock in current gains, decisively withdraw all principal, and continue holding the remaining profits for speculation, both saf
HIGH5.91%
BTC-0.06%
ETH-0.71%
View Original
post-image
  • Reward
  • Comment
  • Repost
  • Share
$CHZ Short-selling strategy update】
🟢 Result: 0.89 → 0.50, a 46.79% decline confirming the bearish logic.
🟡 Action: Recommend taking profit at 80%, move the stop-loss on the remaining 20% to the cost price (break-even).
🔴 Reminder: Do not chase the short, wait for the next signal. Opportunities are every day, preserving capital is the most important.
$BTC $ETH
CHZ0.68%
BTC-0.06%
ETH-0.71%
View Original
post-image
  • Reward
  • Comment
  • Repost
  • Share
For Web3 developers, no matter how powerful a governance protocol is, if the integration cost is too high, it will be difficult to advance the ecosystem.
The core value of Q402 Layer lies in encapsulating the complex EIP-7702 account upgrade and Policy-Aware logic into a minimal developer SDK.
Development teams do not need to write low-level signature verification contracts from scratch; they can simply declare policy configuration files through Q402 to inject Sign-to-Pay functionality into applications.
Whether it’s setting single transaction limits, black-and-white list filtering, or a
Q-2.58%
View Original
post-image
  • Reward
  • Comment
  • Repost
  • Share
BTC plunges below $71K! A 3.7 pullback in 24 hours-can the bulls hold?
gate liveLIVE
480
  • Reward
  • Comment
  • Repost
  • Share
$FF This wave of rallying is quite strong, those who bought in earlier should be feeling pretty comfortable now.
Earlier, I was watching the chart and focused on the 0.08808 level for a while, after some consolidation at the low, it suddenly surged with increased volume, showing clear signs of a rebound, so I went long immediately.
Now the price has reached 0.09134, with a profit of +178.37%, and the rhythm has already delivered the result.
Next, don’t be greedy, take profit of 70% first, and use the remaining 30% to lock in profits, see if it can continue to move later.
For those sti
FF-1.31%
BTC-0.06%
ETH-0.71%
View Original
post-image
  • Reward
  • Comment
  • Repost
  • Share
Everyone is “trapped in positions”!
Currently, more than half of Bitcoin’s circulating supply is in an unrealized loss state, based on an indicator derived from on-chain data from Glassnode.
This “loss supply ratio” has historically closely matched every major bear market bottom, making it a classic signal of extreme market pessimism.
From the chart:
• The red area (Bitcoin supply in loss) expands significantly in 2026;
• The orange area (supply in profit) clearly shrinks;
• The yellow line is Bitcoin’s price, showing that it has continued to decline since the end of 2024, driving the pain ind
View Original
post-image
  • Reward
  • Comment
  • Repost
  • Share
$GWEI Signal】Multiple momentum continuation, Bollinger Bands opening upward
$GWEI 1H RSI 83.25, 4H MACD histogram 0.0039 and continuously expanding, Bollinger upper band at 0.1398 almost touched by the candle body.
Sell order depth is 1.37 times the buy orders, but the price is still actively buying up.
Funding rate 0.03%, open interest stable with no abnormalities, no signs of long squeeze or crowding.
Current risk-reward ratio 1.5, short-term bullish structure has not yet shown signs of exhaustion.
🎯Direction: long
⚡Entry/Order: 0.1383238 - 0.1387400
🛑Stop loss: 0.1373526
GWEI37.76%
View Original
post-image
  • Reward
  • Comment
  • Repost
  • Share
SUI just flashed a 95% short signal—most traders will ignore it until it’s too late.

$SUI /USDT - SHORT

Trade Plan:
Entry: 0.7143 – 0.7213
SL: 0.7510
TP1: 0.6929
TP2: 0.6763
TP3: 0.6514

Why this setup?
4H structure is bearish with 1D trend confirmation. RSI at 61.28 on 15m suggests a local bounce, but the real move is down. Entry zone 0.7143–0.7213 with TP1 at 0.6929 (-3.5%) and TP2 at 0.6763 (-5.8%). ATR shows tight volatility—breakout likely imminent.

Debate:
Are you fading this high-confidence short or waiting for a retest of 0.7510?
SUI1.7%
post-image
post-image
  • Reward
  • Comment
  • Repost
  • Share
Load More