BridgeSideEyes

vip
Active for: 0.4y
Peak Tier 0
No content yet
Institutions are not waiting for exchange volume to surge before acting; five consecutive days of net ETF inflows look more like quiet accumulation. Even in the August off-season, $492 million came in, and the structure of the flows is more convincing than the size of any single day.
View Original
KingAlpha
Bitcoin and Ethereum ETFs Add $492
Million as Inflow Streak Reaches Five
DaysThe five-day run in spot crypto ETF flows is becoming harder to dismiss as a one-off asset rotation. Spot Bitcoin ETFs pulled in $307 million in net inflows on August 21, while spot Ethereum ETFs added $185 million, according to the original report from WuBlockchain. Both product categories have now posted five consecutive sessions of positive net flows.
That symmetry matters. Bitcoin products usually lead flow cycles, but Ethereum ETFs often lag or leak assets during risk-off stretches. A multi-day streak across both asset classes suggests the buying is not limited to a single narrative, such as a flight to bitcoin quality.
The Flow Pattern Is More Important Than the Day Count
A $307 million daily inflow is not historically extreme, but consistency carries different information than size. Five straight days implies investors are re-entering exposure through regulated wrappers rather than waiting for spot exchanges to show stronger momentum. The structure matters because
ETF inflows are booked through broker-dealers, custodians, and authorized participants, adding a layer of institutional plumbing that spot market volume does not capture.
August is also a month when many institutional desks run lighter staffing, so flows of this size during a seasonally quiet stretch stand out. If demand holds through the final full week of the month, it could force short-term traders to reassess downside positioning.#BTCBreaks77000 #GateLaunchesJapaneseStockTrading #GateBTCSpotTradingRanks#2Globally #ETHBreaks2400 #GateStockInsightsChallenge $BTC $ETH
repost-content-media
  • Reward
  • Comment
  • Repost
  • Share
Today I was looking at bridge data again when I suddenly realized something. Modular blockchains have been hyped for so long, but has the experience really changed for ordinary users like us? Not in any earth-shattering way—the waiting is still there, and every cent of the fees is still due. The only difference is that there are more chains, making things more fragmented as you move between them, and more troublesome when something goes wrong. Anyway, my job is still to monitor large unusual movements on bridges. I don’t care how the underlying layers are split up; I only care whether the mone
View Original
  • Reward
  • Comment
  • Repost
  • Share
This is the third time I’ve seen someone sign an authorization in a daze, and their wallet gets emptied on the spot. Honestly, those phishing sites are getting more and more like the real thing—address cloning, pages that look exactly the same, and all that’s missing is a little “you’ve been phished” Easter egg tucked in the corner. As for me, no matter what link I click now, step one is to check the domain, and then see whether it’s trying to get you to sign something like “unlimited authorization.” Especially those links that farm around on testnets—at the drop of a hat, they’ll make you sig
View Original
  • Reward
  • Comment
  • Repost
  • Share
Stablecoin supply is up, and ETF funds have also flowed in—so then what? Does that really mean we can directly infer a bull market? For my part, when I look at on-chain RWA and Treasury yield projects being compared to U.S. Treasury yields, it just feels a bit strange. Yield levels are just numbers, but the differences in liquidity, risk exposure, and redemption mechanisms are huge—don’t treat correlation as causation. Large transfers on the bridge can look pretty lively at times, but behind the scenes it could be arbitrage or market-making, not actual real-world off-chain money. I’ll keep wat
RWA-1.41%
View Original
  • Reward
  • Comment
  • Repost
  • Share
Entered at 129.69, target 140+, with a clear stop loss—this strategy is clean and worth following.
View Original
CoinCircleDreamer7740
Everyone is bearish on SOXL, but I think there’s a clear long signal on the 4-hour chart. The 15-minute RSI is 57; momentum is building rather than exhausting, so it’s not a chase-the-high setup.
Entry: 129.69, TP1: 140.62. This 8.4% room to the target is cleanly calculated before hitting resistance. TP2: 147.90, TP3: 158.83, stop loss: 115.11. The daily chart is ranging, and a breakout is simmering.
The 4-hour EMA has already pointed the direction—wait for a pullback to 115, or bet that the range contraction will move upward? I choose the former.
$SOXL
  • Reward
  • Comment
  • Repost
  • Share
Iraq is moving away from dependence on Iran, with major U.S. companies making large investments—nice!
View Original
CoinNetwork
Crypto界网 reports that BP and ConocoPhillips plan to announce on Friday a multi-billion-dollar investment in Iraq to support the country’s energy sector and reduce reliance on Iran. The announcements are expected to take place at the U.S.-Iraq Business Summit, where Iraqi Prime Minister Ali Zaidi will meet with senior U.S. officials and executives of major energy companies. The summit is expected to result in more than $60 billion in agreements and memorandums of understanding. BP and ConocoPhillips’ investment will total several billion dollars, and specific commitment details have not yet been disclosed.
  • Reward
  • Comment
  • Repost
  • Share
A 1.45% dividend yield—traditional finance’s cash-flow game does look conservative through a Web3 lens, but steady payouts are still a hard requirement for many market participants. NHS’s move here sets an example for high-yield bond funds.
View Original
CoinNetwork
CoinWorld news: Neuberger High Yield Strategy Fund (NHS) will go ex-dividend on July 15, 2026, and will pay a cash dividend of $0.0905 per share. The payment date is July 31, 2026. Based on NHS’s latest share price of $6.23, the dividend yield is 1.45%.
  • Reward
  • Comment
  • Repost
  • Share
August 2030’s 8.2 trillion is a bull market script, but even the base-case 5.5 trillion would mean rewriting the entire traditional financial infrastructure. Build the foundation with stablecoins and tokenized deposits, put U.S. stocks and U.S. Treasuries on-chain—I'm all in on this narrative
View Original
CoinNetwork
Coin Bureau news: Citi Institute said in its latest report that the current global market size for tokenized assets is about $17 billion, and it is expected to reach $5.5 trillion by 2030 under the base-case scenario. Under the bear-case and bull-case scenarios, it would be $2.7 trillion and $8.2 trillion, respectively. The report believes that the expected growth will be driven mainly by public market securities—especially tokenized settlement assets such as US stocks and government bonds, as well as stablecoins and tokenized deposits, which will be an important foundation for the expansion of tokenization.
  • Reward
  • Comment
  • Repost
  • Share
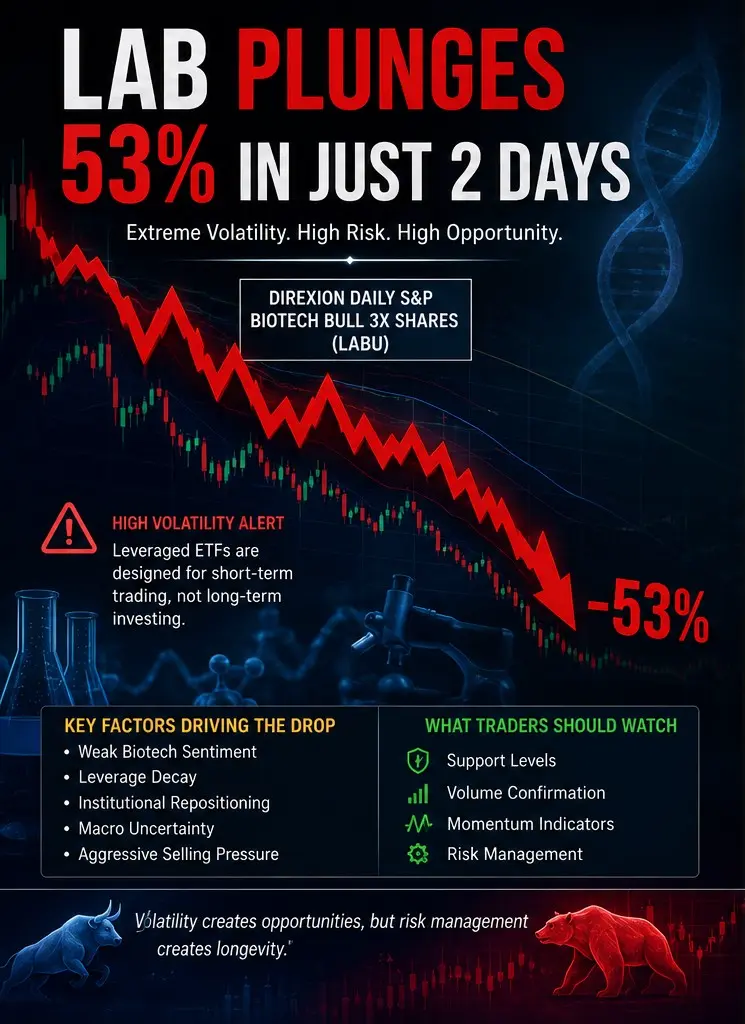
LABU halved in two days—the frenzy and the strangling of triple leverage; risk control is more important than forecasts
View Original
2In1
#LABPlunges53PercentInTwoDays
The Direxion Daily S&P Biotech Bull 3X Shares (LABU) and its inverse counterpart have once again reminded traders how leveraged ETFs can experience extreme price swings in a short period.
A decline of approximately 53% within two trading sessions represents a major volatility event driven by rapid changes in biotechnology sentiment, leverage decay, aggressive institutional repositioning, and elevated market uncertainty.
While these moves attract speculative traders searching for quick opportunities, they also highlight the importance of disciplined risk management.
Every significant decline creates two possibilities: either a high-risk recovery opportunity or the beginning of a larger bearish trend.
Understanding which scenario is developing requires combining technical analysis, macroeconomic conditions, institutional positioning, and sector-specific catalysts.
The broader U.S. equity market continues to experience mixed sentiment as investors balance expectations for interest rate policy, economic growth, inflation trends, and corporate earnings.
Biotechnology remains one of the most volatile sectors because company valuations are heavily influenced by clinical trial outcomes, FDA approvals, research funding, merger activity, and investor risk appetite.
As liquidity rotates between defensive and growth sectors, leveraged biotech ETFs often experience amplified price movements compared to the underlying index.
Current market conditions suggest elevated volatility rather than a stable directional trend.
Large intraday price swings, above-average trading volume, and increasing options activity indicate that traders remain highly active while long-term investors continue waiting for clearer macroeconomic signals.
Until confidence improves, sharp rallies and sharp declines are both likely to remain common.
At the time of publishing, traders should verify the live market price before opening any position because leveraged ETFs can move several percentage points within minutes.
Price action remains the most important confirmation signal, especially during periods of unusually high volatility.
From a performance perspective, the recent decline represents one of the strongest short-term corrections in recent sessions.
Such moves often trigger forced liquidations, margin calls, algorithmic selling, and panic exits before value-oriented buyers begin accumulating positions.
Whether this develops into a lasting bottom depends on the strength of subsequent buying volume.
Technically, the market structure has shifted from bullish to defensive.
Lower highs and lower lows indicate that sellers currently control momentum.
Unless price successfully reclaims previous resistance levels with strong volume, the broader technical structure remains vulnerable to additional downside.
Trend analysis shows that short-term momentum continues favoring bears while medium-term direction depends on whether support zones successfully hold.
Long-term investors will likely focus on sector fundamentals rather than short-term volatility.
Important support levels include recent swing lows, previous consolidation zones, and high-volume accumulation areas.
If these supports remain intact, buyers may gradually rebuild confidence.
Failure to hold these levels could invite another wave of selling pressure.
Resistance levels now include recent breakdown areas, declining moving averages, and previous support zones that may now act as resistance.
Strong buying volume will be required before these barriers can be overcome.
Key buying zones generally appear near historical demand areas where institutional accumulation previously occurred.
Rather than chasing rebounds, experienced traders typically wait for confirmation through higher lows, stronger volume, and improving momentum indicators.
Key selling zones remain near overhead resistance where previous buyers may attempt to exit losing positions.
These areas often create temporary supply that slows recovery attempts.
The bullish scenario begins with stabilization above major support followed by increasing trading volume, improving market breadth, positive biotechnology news, and stronger institutional buying.
If buyers regain control, a relief rally could develop toward higher resistance levels before a larger trend reversal is confirmed.
The bearish scenario remains valid if price continues making lower lows while volume expands during selloffs.
Additional macroeconomic uncertainty, disappointing healthcare news, weaker biotech sentiment, or broader equity weakness could extend downside pressure.
Volume analysis remains one of the most important indicators following such a significant decline.
Exceptionally high volume often signals capitulation, while declining volume during rebounds may indicate only temporary short covering rather than genuine institutional accumulation.
Momentum indicators deserve close attention. RSI may approach oversold territory after such a steep decline, but oversold conditions alone do not guarantee a reversal.
MACD remains useful for identifying momentum shifts through bullish crossovers, while moving averages continue helping traders identify trend direction and dynamic support or resistance.
The artificial intelligence and semiconductor sectors continue attracting significant capital flows across U.S. markets, often competing with biotechnology for institutional investment.
When AI-related stocks outperform, biotechnology occasionally experiences temporary capital rotation.
However, long-term healthcare innovation remains supported by advances in genomics, precision medicine, artificial intelligence-assisted drug discovery, and biotechnology research.
Biotechnology fundamentals remain attractive over the long term despite elevated short-term volatility.
Demand for innovative treatments, expanding healthcare spending, aging populations, and continuous scientific breakthroughs continue supporting the industry's structural growth outlook.
Institutional sentiment remains cautious but highly selective.
Large asset managers continue focusing on companies with strong balance sheets, diversified pipelines, strategic partnerships, and sustainable revenue potential rather than purely speculative biotechnology names.
Several market catalysts could determine the next directional move, including Federal Reserve policy expectations, inflation data, Treasury yields, FDA approvals, biotechnology earnings, merger announcements, clinical trial results, healthcare legislation, and overall equity market sentiment.
Risk factors remain substantial.
Leveraged ETFs experience volatility decay, compounding effects, rapid price swings, and increased exposure to daily market fluctuations.
These products are generally designed for short-term tactical trading rather than long-term investing.
Today's market outlook remains cautious. Traders should expect continued volatility while monitoring whether buyers successfully defend critical support zones. Confirmation through price action and volume remains more reliable than attempting to predict market turning points.
The short-term outlook remains neutral to bearish until technical confirmation improves. Recovery attempts are possible, but sustained upside requires stronger institutional participation.
The mid-term outlook depends largely on broader biotechnology sector performance and macroeconomic stability. Improving investor confidence could support gradual recovery, while persistent uncertainty could delay any meaningful trend reversal.
The long-term outlook remains constructive for biotechnology because healthcare innovation continues expanding globally. Investors with longer investment horizons may view major corrections as opportunities, provided underlying sector fundamentals remain intact.
Futures market participants should closely monitor volatility, overnight news, options positioning, and broader equity futures before entering trades. Futures often provide valuable clues regarding market sentiment before the regular session begins.
An advanced trading strategy emphasizes patience over prediction. Wait for confirmed support, rising volume, improving momentum indicators, and favorable risk-to-reward ratios before initiating new positions. Avoid emotional trading during highly volatile sessions.
Professional risk management remains the foundation of successful trading. Limit position sizes, always define stop-loss levels before entry, avoid excessive leverage, diversify exposure, and never allow a single trade to determine overall portfolio performance.
Essential support levels should be monitored alongside previous accumulation zones, while essential resistance levels include recent breakdown areas, declining trendlines, and major moving averages that may challenge recovery attempts.
Key upside targets become relevant only after resistance is reclaimed with convincing volume. Conversely, failure to hold support could expose additional downside targets and extend the existing correction.
Swing traders should prioritize confirmed trend reversals rather than attempting to catch falling prices. Day traders may focus on volatility, liquidity, opening range breakouts, and disciplined execution while maintaining strict stop-loss protection.
From an investment perspective, leveraged ETFs require careful understanding of their structure and objectives. Long-term investors may prefer diversified exposure to biotechnology rather than relying on leveraged products designed primarily for short-term trading strategies.
The recent decline highlights both the opportunities and dangers of leveraged markets. Volatility creates attractive trading setups but also increases downside risk. Successful traders combine technical confirmation, fundamental awareness, disciplined execution, and effective risk management rather than relying solely on short-term price movements. The coming sessions will reveal whether this decline represents capitulation before recovery or the continuation of a broader bearish trend.
Engagement Question: Do you believe the recent 53% plunge represents a buying opportunity for experienced traders, or is it a warning that biotechnology volatility could continue driving prices lower in the weeks ahead?
repost-content-media
  • Reward
  • Comment
  • Repost
  • Share
Having watched the NATO eastward expansion script for thirty years, North Korea’s remarks this time have indeed added an Asia-Pacific perspective—interesting.
View Original
CoinNetwork
North Korea’s Foreign Ministry: NATO intends to orchestrate a bloc confrontation
According to KCNA, a spokesperson for the North Korean Ministry of Foreign Affairs said that the United States and its allies openly stoked confrontation at the NATO summit, undermining European security and creating instability in the Asia-Pacific. NATO is viewed as a “war-confrontation organization” pursuing exclusive geopolitical interests. The spokesperson criticized that NATO, after the Cold War, had not disappeared and continued its eastward expansion, damaging regional security and shifting responsibility. North Korea said it will further strengthen its capabilities to stop confrontation and military threats, and to uphold national sovereignty and regional peace and stability.
  • Reward
  • Comment
  • Repost
  • Share
Last night I tried to buy the dip, but slippage ate half my expected profit. I stared at the transaction record for a while—on-chain data was all visible, but liquidity just wasn't there, and I was in too much of a hurry to place the order.
Now I've learned my lesson: always split large orders, even if it means paying more in gas to let the pool recover. Honestly, waiting for confirmations when bridging and waiting for liquidity when trading—it's all about patience. Lately I keep seeing people complain about MEV and unfair ordering, but I think... there's never been fairness in this game, only
View Original
  • Reward
  • Comment
  • Repost
  • Share
Claude is finally getting its own heart, and the 2nm custom chip move has directly escalated the AI arms race into a new dimension. Samsung foundry + Anthropic in-house development, the cracks in NVIDIA's monopoly are widening, let's see how much inference costs can be cut.
NVDA-2.92%
View Original
Original content no longer visible
  • Reward
  • Comment
  • Repost
  • Share
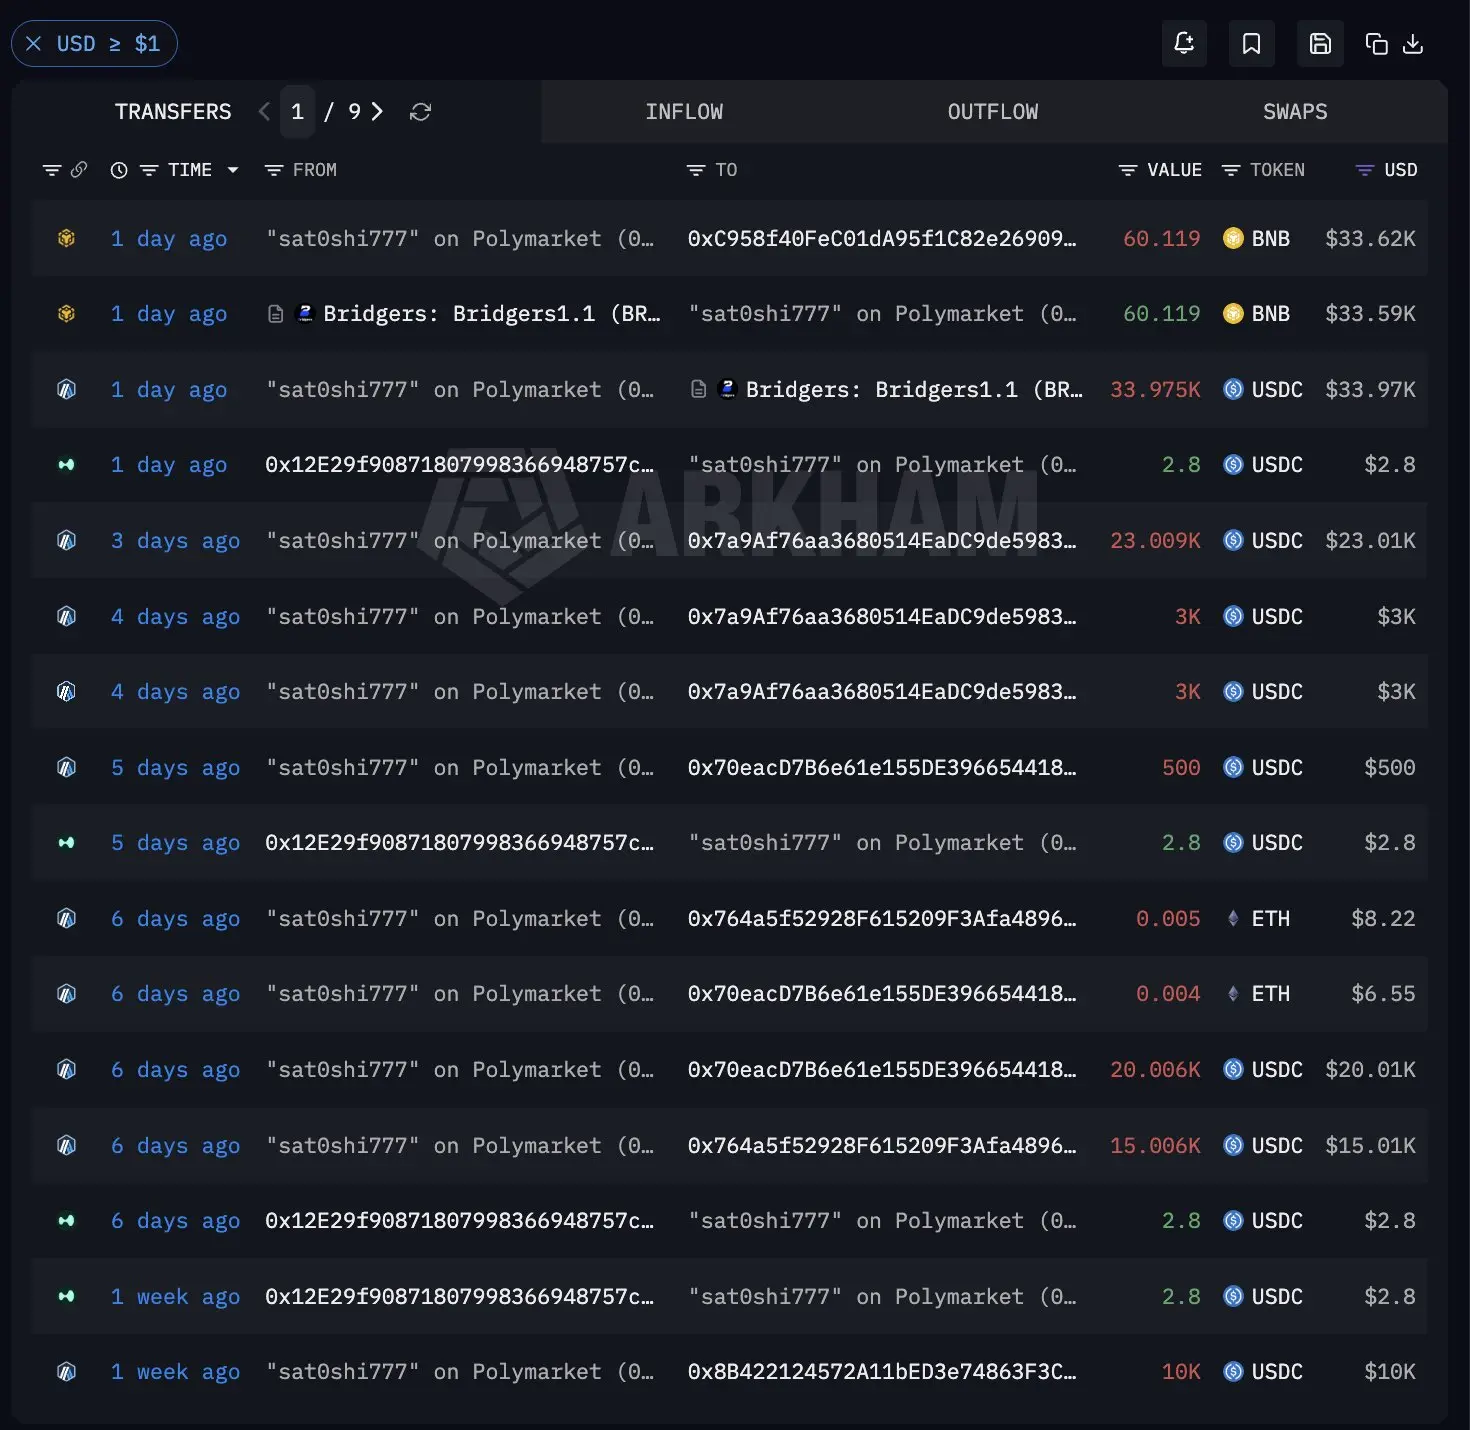
sat0shi777's 83M ETH short position, with the liquidation price set so tightly, really planning to either get rich or go to zero?
ETH2.26%
View Original
AriaNaka
HE IS SHORT $80 MILLION OF $ETH
Whale “sat0shi777” just shorted $83.5M of ETH at $1540, on over 20x leverage. He’s already down $1.7M and his liquidation price is $1652.
Did he just max short the bottom?
repost-content-media
  • Reward
  • Comment
  • Repost
  • Share
Consensys enters the scene to create MUSD, with Morpho+AAVE as the foundation. Is this a step for MetaMask from wallet to bank?
MORPHO-6.12%
AAVE-4.10%
View Original
CoinNetwork
CoinWorld News: MetaMask has launched a self-custodial account called Money Account, integrating stablecoin yield, payment, and trading functions. The product was released by Consensys and is built on the Monad blockchain, with its core asset being the dollar-pegged stablecoin MUSD. Users who hold assets can earn up to approximately 4% variable annualized yield; their funds are automatically allocated to decentralized lending protocols such as Morpho, and will later be connected to AAVE. This account requires no manual fund transfers—once the yield is deposited, it automatically takes effect—and the funds can be used directly for token swaps, perpetual contract trading, and prediction market trading. According to Coindesk.
  • Reward
  • Comment
  • Repost
  • Share
Goldman Sachs Lampé has entered the scene, buying Bitcoin for 120 million euros. This signal is strong enough.
GS-0.29%
BTC3.19%
View Original
CoinNetwork
CoinWorld News, UAE's Goldman Lampe Private Bank has announced the purchase of 120 million euros worth of Bitcoin. The bank stated: "Bitcoin continues to demonstrate remarkable resilience as a store of value and a strategic asset."
  • Reward
  • Comment
  • Repost
  • Share
60k dollars in trading volume with this drop, liquidity is a bit dry.
View Original
CoinNetwork
XBIT Wallet data source, Bitcoin BTC today’s market news. BTC Bitcoin latest price: $59985.82000000. 24-hour change: -2.46%. Trading volume: $60k.
  • Reward
  • Comment
  • Repost
  • Share
Hacker attack frequency hits a new high, but individual losses have decreased, indicating that the industry's defense system is evolving—it's just that there are more flies and mosquitoes.
View Original
CoinNetwork
CoinWorld News reports that, according to Unfolded statistics, 83 security incidents in the cryptocurrency industry have occurred in the second quarter of 2026, setting a new record for the number of hacker attacks in a single quarter. Despite the significant increase in attack frequency, the total losses amount to approximately $755.3 million, still well below the historical peak of about $3.56 billion in the fourth quarter of 2020. Data shows that current attack patterns are shifting from a few large-scale thefts to more frequent small-scale attacks, with the largest incidents this quarter being the theft of $293 million from KelpDAO and $280 million from Drift Protocol. Cross-chain bridge attacks caused about $351 million in losses, accounting for nearly half of the total losses; administrator privileges being compromised and fake token price manipulation each account for about 37%, and private key leaks account for approximately 5.7%.
  • Reward
  • Comment
  • Repost
  • Share
MARA's move, institutional FOMO is confirmed.
MARA-0.93%
View Original
CoinNetwork
CoinJie News reports that the publicly listed mining company Mara has announced an additional purchase of 1,000 Bitcoins, costing more than $90 million.
  • Reward
  • Comment
  • Repost
  • Share
This structure is indeed pleasing to the eye. After waiting so long, there's finally some hope.
View Original
TradingHeights
𝐗𝐋𝐌 𝐒𝐓𝐑𝐔𝐂𝐓𝐔𝐑𝐄 𝐋𝐎𝐎𝐊𝐒 𝐈𝐍𝐓𝐄𝐑𝐄𝐒𝐓𝐈𝐍𝐆 🚀
$XLM is showing one of those setups where patience could finally get rewarded.
📊 After months of accumulation: 🔹 Strong base formation
🔹 Breakout attempt confirmed
🔹 Price holding key zone
🔹 Momentum slowly returning
Nothing is guaranteed in markets, but many charts are starting to show signs of strength again.
Smart traders follow structure, not emotions. 👀🔥
$XLM ‌#MyGateTradeStory
repost-content-media
  • Reward
  • Comment
  • Repost
  • Share
Good morning! It feels great to BUIDL together 💪
View Original
Crypto_WolfOG
Good morning everyone. Have a great, positive, productive and successful day ahead. Let's keep building together 💪
  • Reward
  • Comment
  • Repost
  • Share
  • Pinned