Square
Following
Hot
News
Profile

katemin97

vip
Active for: 2.1y
Peak Tier 3
Diamond Hands
No content yet
478
Following
19
Followers
1
Liked
🎙️ Fed Chair Warsh has made important remarks—what do you think? Gate Square’s special “Weekly Share” edition is live!
Share your views on the topic, and new users are guaranteed a red envelope; weekly leaderboard prizes are up to 100 USDT!
📌 How to participate
1️⃣ Register for the event 👉 https://www.gate.com/campaigns/6244
2️⃣ Share your views with #每周来晒 and #沃什IMF讲话
💬 This week’s hot topic
Today, Fed Chair Warsh is taking part in an IMF fireside chat. Inflationary pressures in the US continue to heat up, and the market is focused on signals about his interest rate policy and the impac
CryptoChampion
🎙️ Fed Chair Warsh makes major remarks—what do you think? Gate Square’s “Weekly Sharing” special edition is here!
Share your views with the topic and new users are guaranteed a red packet; weekly leaderboard prizes reach up to 100 USDT!
📌 How to participate
1️⃣ Sign up for the event 👉 https://www.gate.com/campaigns/6244
2️⃣ Share your views with #每周来晒 and #沃什IMF讲话
💬 This week’s hot topic
Fed Chair Warsh attends an IMF fireside chat today. US inflationary pressures continue to heat up, and the market is focused on his interest rate policy signals and their impact on the US dollar, US stocks, and BTC.
💡 Share your views
1️⃣ Will Warsh send hawkish or dovish signals? Will the Fed continue raising rates?
2️⃣ How will the speech affect BTC? Will the market rebound or pull back?
Red packets are limited—share your views, first come, first served!
👉 https://www.gate.com/post/topic/WarshIMFSpeech?topic_id=206770
repost-content-media
BTC-0.76%
🎁 100% win rate! Gate Social's 2️⃣ 5️⃣ Lucky Spin has begun
Complete social media tasks to earn Growth Points and win up to 5,000 USDT!
👉 Join the spin: https://www.gate.com/activities/pointprize?now_period=25
🎯 Earn Growth Points
1️⃣ Square Tasks — post, like, comment, and share, up to 600/day
2️⃣ Live Tasks — watch, like, comment, share, and make reservations, up to 300/day
3️⃣ Chat Tasks — join discussions and share trading cards, up to 90/day
4️⃣ Creator Tasks — post content about selected tokens or trading cards, up to 300/task
🎉 Nintendo Switch, a 10,000 USDT Position Voucher, Gate s
Gate_Square
🎁 100% Win Rate! Gate Social Phase 2️⃣ 5️⃣ Lucky Draw is Live
Complete social tasks to earn Growth Points and Win up to 5,000 USDT!
👉 Join the Draw: https://www.gate.com/activities/pointprize?now_period=25
🎯 Earn Growth Points
1️⃣ Square tasks — post, like, comment, and share, up to 600/day
2️⃣ Live tasks — watch, like, comment, share, and reserve, up to 300/day
3️⃣ Chat tasks — join discussions and share trading cards, up to 90/day
4️⃣ Creator tasks — post selected token or trading card content, up to 300/task
🎉 Nintendo Switch, 10,000 USDT Position Vouchers, Gate Umbrellas, GT await!
$BTC $ETH $TSLA
repost-content-media
BTC-0.76%
ETH+0.77%
TSLA-0.92%
GT+0.67%
#BitcoinTops 🚀 | BTC Reclaims $82,000 After Sharp Market Whiplash!
📅 October 16, 2026 | Bitcoin Market Update
Bitcoin is fighting back! ₿ After briefly slipping below $80,000 on Thursday, BTC rebounded above $82,000 as bargain hunters returned and Treasury yields cooled, partially restoring risk appetite.
But don't mistake a bounce for a confirmed trend reversal. Bitcoin still faces inflation concerns, interest rate uncertainty, and a broad sell-off in tech stocks.
📊 LATEST MARKET SNAPSHOT
- 💰 Above $82,000: Bitcoin has reclaimed this key psychological level.
- 📉 Around $79,770: The repo
AngryBird
#BitcoinTops 🚀 | BTC Reclaims $82,000 After a Sharp Market Shakeout!
📅 October 16, 2026 | Bitcoin Market Update
Bitcoin is fighting back! ₿ After briefly crashing below $80,000 on Thursday, BTC recovered above the $82,000 mark, as bargain hunters returned and easing Treasury yields helped restore some risk appetite.
But don't mistake a bounce for a confirmed trend reversal. Bitcoin is still navigating inflation fears, interest-rate uncertainty, and a wider technology-stock sell-off.
📊 THE LATEST MARKET PICTURE
- 💰 $82,000+: Bitcoin reclaimed this key psychological level.
- 📉 Around $79,770: Thursday's reported intraday low.
- ⚡ Heavy liquidations: Rapid price swings forced leveraged traders out of positions.
- 🏦 Fed uncertainty: Hot U.S. CPI and PPI readings have increased concerns about tighter monetary policy.
- 📈 ETF flows: Renewed institutional buying could help support the recovery, but sustained inflows matter more than one session.
🔍 WHY IS BITCOIN RECOVERING?
1️⃣ Bargain Hunting: Buyers stepped in after BTC approached the $80,000 zone, helping fuel a relief rally.
2️⃣ Treasury Yields Eased: Lower yields can improve the appeal of risk-sensitive assets, including cryptocurrencies.
3️⃣ Market Sentiment Stabilized: A partial recovery in technology stocks helped ease pressure on crypto markets.
4️⃣ Institutional Demand Is Back in Focus: Bitcoin ETF flows will be an important signal for determining whether this recovery has meaningful support.
📍 KEY BTC LEVELS TO WATCH
🟢 $82,000: Immediate level bulls need to defend.
🚀 $84,000: Potential recovery target if buying momentum strengthens.
🔴 $80,000: Major psychological support zone.
⚠️ Below $79,770: A fresh breakdown could expose Bitcoin to additional selling pressure.
These are reference levels, not guaranteed support or resistance.
🔮 WHAT HAPPENS NEXT?
Bullish scenario: BTC holds above $82,000, attracts fresh demand, and pushes toward $84,000.
Bearish scenario: The recovery loses momentum, BTC falls below $80,000, and traders reassess the risk of a deeper correction.
💡 MY TAKE
Bitcoin's ability to recover above $82K after briefly dipping below $80K shows that buyers are still active. However, persistent inflation and uncertainty around the Federal Reserve could limit upside.
The next move depends on whether BTC can maintain its reclaimed level and attract sustained spot demand. In a volatile market, confirmation matters more than excitement.
💬 YOUR PREDICTION: Is $82K the foundation for Bitcoin's next rally toward $85K, or will sellers push BTC back below $80K?
⚠️ Market commentary only, not financial advice. Crypto trading carries substantial risk.
#Bitcoin #BTC #CryptoMarket
BTC-0.76%
#TeslaRoadsterSparksMemeCoinSurge
Tesla Roadster Headlines and Meme Coin Prices: What the Evidence Really Shows

Every few months, a headline about Tesla, Elon Musk, or one of their products appears on social media and sparks a wave of attention in the meme coin market. The latest version of this pattern revolves around the Tesla Roadster, a high-performance electric sports car often discussed by enthusiasts and traders. Before discussing price movements, it is important to be precise about what has been reported, because the meme coin market moves quickly and headlines often get ahead of th
katemin97
#美股存储板块跌幅扩大
The core question is whether this is a healthy correction after the rally driven by artificial intelligence (AI), or the start of a deeper repricing in the storage industry. Rather than buying just because prices have fallen, it would be more prudent to focus on earnings expectations, memory prices, and each company’s ability to sustain margins.
My view on storage stocks:
* Micron (MU): Watch DRAM and HBM demand, AI-related memory growth, and gross margin forecasts. Strong AI demand could drive earnings, although these expectations may already be reflected in the stock price.
* SanDisk (SNDK): Focus on NAND flash prices, enterprise SSD demand, and the sustainability of any earnings recovery. NAND supply and pricing cycles could make this stock particularly volatile.
* Western Digital (WDC): Assess demand for “nearline” HDDs (high-capacity, easily accessible) from AI data centers, cloud computing spending, and free cash flow. The factors affecting HDD demand differ from those driving NAND and DRAM.
* Seagate (STX): As data center storage demand increases, watch demand for high-capacity drives, pricing power, and margins.
* Monitor NAND market conditions, enterprise SSD adoption rates, and company valuations relative to earnings expectations.
What signs could provide a basis for rebuilding a position? I would consider the following three:
* Stabilizing fundamentals: The decline in memory and NAND prices eases, and company forecasts and earnings estimates stabilize.
* Price action confirmation: Stocks form higher lows and reclaim key moving averages, accompanied by rising trading volume.
* Attractive valuation: Expected earnings growth is sufficient to justify the current price, even under less optimistic scenarios.
A falling stock price, by itself, is not a buy signal. If earnings estimates fall faster than the stock price, the valuation may not actually have become cheaper.
Rather than buying across the entire storage sector, I prefer to distinguish between individual companies. While AI demand is a long-term growth driver, memory, NAND flash, and hard drives each have their own supply cycles, competitive pressures, and margins.
One important distinction: A pullback due to profit-taking is very different from a decline driven by a weaker future outlook or falling memory prices. The latter calls for a much more cautious approach. Among MU, SNDK, WDC, and STX, which ticker are you watching most closely? I can help you compare valuations, earnings outlooks, technical levels, and potential catalysts for a recovery.
$MU ‌$SNDK ‌$WDC ‌$STX ‌
#TeslaRoadsterSparksMemeCoinSurge
Tesla Roadster Headlines and Meme Coin Prices: What the Evidence Actually Shows

Every few months, a headline about Tesla, Elon Musk, or one of their products appears on social media and creates a wave of attention in the meme coin market. The latest version of this pattern revolves around the Tesla Roadster, a high-performance electric sports car often discussed by enthusiasts and traders. Before discussing price movements, it is important to be precise about what has been reported, because the meme coin market moves quickly and headlines often get ahead of
HighAmbition
#TeslaRoadsterSparksMemeCoinSurge
Tesla Roadster headlines and meme coin prices: what the evidence actually shows

Every few months a headline about Tesla, Elon Musk or one of their products lands on social media and sends a wave of attention through the meme coin market. The latest version of that pattern centers on the Tesla Roadster, the high-performance electric sports car that has been a recurring topic of discussion among enthusiasts and traders. Before we talk about price moves, it is worth being precise about what has been reported, because the meme coin market moves fast and headlines often run ahead of the facts.

The most concrete recent development is the listing of Flying Tesla Roadster (FTR), a Solana-based meme coin inspired by the Tesla Roadster and by themes associated with Elon Musk. According to reports published on October 16, 2026, the exchange Bitrue announced the listing after trading activity in the token surged, and FTR's market capitalization reached roughly $3.9 million. That is a very small valuation, which means even modest buying or selling can produce large percentage swings. The same coverage also stresses that the project has no confirmed connection to Tesla, SpaceX or Elon Musk himself. In other words, the Roadster theme is a marketing narrative, not an official product tie-in, and its value depends almost entirely on speculative demand.

Beyond that single token, the broader meme coin complex has been driven far more by general market sentiment than by any one car story. Pepe, one of the most widely tracked meme tokens, was quoted at about $0.0000041 with a market capitalization of roughly $1.74 billion as of October 12, 2026, according to Trust Wallet price data. On that day the token was showing a small move of about negative 0.39 percent over the trading session. Those figures show a token that is still far below its recent peaks, and they also highlight a data point traders should be careful with: a 24-hour trading volume of about $1.63 million looks very low next to a market capitalization above $1.7 billion, so different data providers can give very different pictures of liquidity at any given moment.

The bigger price story for Pepe came in September 2026. Multiple analyses reported that the token surged as much as 45 to 50 percent over a single week, helped by short liquidations exceeding $900 million and by alignment with Bitcoin's upward move. The local high was near $0.0000053, and the token then consolidated in a range around $0.0000043 to $0.0000045. From the $0.0000053 high to the roughly $0.0000041 level quoted in mid-October, the price has retreated by about 22 to 23 percent. That is a reminder that meme coin rallies can be sharp and that the gains can be given back just as quickly once the leverage has been flushed from the market.

Earlier rallies have shown even more extreme numbers. In one previous episode, Pepecoin was reported to have surged as much as 60 percent within a 24-hour window and to have extended its weekly gains beyond 370 percent during a broad meme coin rally sparked by Dogecoin and Bonk. Trading volumes for the frog-themed token reached lifetime highs of about $3.6 billion at that time, according to CoinGecko data cited by CoinDesk. Those numbers illustrate the scale of what is possible when sentiment, derivatives positioning and retail participation line up at the same time. They also illustrate how quickly the picture can change once the momentum fades.

So how would a Tesla Roadster story actually move meme coin prices? The mechanism is largely social and psychological. A viral post, a trending hashtag or a celebrity mention can bring new traders into a token for a few hours or days. Those traders often chase momentum, which pushes prices higher and attracts more attention, creating a feedback loop. Because meme coins typically have thin order books and concentrated holdings, a relatively small amount of new capital can produce a large percentage move. A token that gains 30 percent in a day on modest volume may look dramatic on a chart, yet the same move can reverse just as violently if the buyers leave.

This is exactly why the market impact of a headline should be judged by measurable signals rather than by the excitement of the story. The first signal is trading volume. If a genuine wave of interest is forming, volume on major exchanges and on decentralized venues should rise together with price, not only on a single platform. The second signal is the quality of the move. Rallies backed by sustained buying over several sessions tend to be more durable than spikes driven by a single burst of liquidations. The third signal is derivatives data. Positive funding rates and rising open interest can confirm that traders are leaning long, but they can also warn that the market is becoming crowded and vulnerable to a sharp correction.

Market impact also depends on how long the attention lasts. Many meme tokens peak within days of a headline and then drift for months. A study covered by Tradersunion, published on October 16, 2026, found that only about 3 percent of memecoins return to their all-time highs, which underlines how rare sustained recovery is in this sector. The same coverage pointed to the LAPTOP token, linked to the controversy surrounding Hunter Biden's laptop, which reportedly saw a surge in September 2026 before its price collapsed by roughly 99 percent. That example is a useful warning for anyone tempted to treat a viral narrative as a reliable long-term signal.

Technically, Pepe's current structure gives traders a few reference points. Price has been holding support near $0.0000041 while forming a bearish pennant pattern on shorter timeframes, according to MetaMask price commentary. Resistance has been cited near $0.000005, and the September high near $0.0000053 remains the level that bulls would need to reclaim to restore the broader uptrend. A decisive break above resistance with rising volume would strengthen the case for continuation, while a close below support would open the door to a deeper retracement. Traders often use these levels to define risk, placing stops just beyond invalidation points rather than relying on hope.

For the Tesla Roadster theme specifically, the honest conclusion is that the evidence for a broad, lasting meme coin rally tied to the car is thin. The concrete case we can verify is the FTR listing and its small market capitalization, which shows that speculative capital can flow into a Roadster-themed token. The wider market, however, is still being driven mainly by Bitcoin's direction, leverage, and the familiar cycle of meme token hype. A new headline may create a short burst of trading interest, but without official involvement or real utility, that interest tends to fade once the news cycle moves on.

Risk management is therefore the most important part of any trading plan around meme coins. Position sizing should be modest enough that a 50 percent drop would not damage the rest of the portfolio. Entries should be planned in advance rather than made in the middle of a viral spike. Taking partial profits into strength can lock in gains while leaving room for upside. And traders should always remember that liquidity can disappear quickly, making it hard to exit at the price shown on a screen. Slippage, spreads and fees can turn a seemingly profitable move into a loss.

In summary, a Tesla Roadster headline can plausibly add fuel to meme coin trading, especially for a small, newly listed token like FTR. Social media hype can lift trading volume and push prices up by large percentages in a short period, as the September Pepe rally and earlier Pepecoin episodes demonstrate. Yet the same history shows that these gains are frequently reversed, and that most meme tokens never regain their earlier highs. The most useful approach is to watch volume, liquidity, derivatives positioning and key price levels rather than the headline itself, and to treat every rally as a trade with defined risk rather than a guaranteed opportunity.

This content is for informational and educational purposes only and does not constitute investment advice. Meme coins are highly speculative and can lose most or all of their value. Always do your own research and only risk what you can afford to lose.

Community sentiment deserves its own attention, because it is often the first place where a narrative like the Roadster story takes shape. Posts on social platforms tend to spread quickly when they combine a famous brand with a simple, emotional message, and meme tokens are built to travel exactly that way. Traders who follow these conversations often notice the early signs before the broader market does, such as rising mention counts, new wallets buying in, and influencers posting charts with bold price targets. Those signs can be useful, but they can also be manufactured. Coordinated posting, paid promotion and bot activity can make a token look far more popular than it really is. For that reason, sentiment should be treated as a secondary input that needs confirmation from volume and price structure rather than as a standalone reason to buy.

Timing is another critical factor. Historically, the strongest price moves in meme tokens have often occurred in the first hours after a viral event, while the slowest and most painful losses have frequently come to people who entered after the headline had already been priced in. When a story has been repeated across dozens of channels, much of the easy upside may already have been captured by earlier buyers. Late entrants then become the liquidity that early participants sell into. Recognizing where a token sits in its cycle, whether it is in discovery, momentum, distribution or decline, can help traders avoid buying the top of a short-lived hype wave.

Liquidity structure matters just as much as narrative.
repost-content-media
#美股存储板块跌幅扩大
The core question is whether this is a healthy correction after the rally driven by artificial intelligence (AI), or the start of a deeper repricing in the storage industry. Rather than buying just because prices have fallen, it would be more prudent to focus on earnings expectations, memory prices, and each company’s ability to sustain margins.
My view on storage stocks:
* Micron (MU): Watch DRAM and HBM demand, AI-related memory growth, and gross margin forecasts. Strong AI demand could drive earnings, although these expectations may already be reflected in the stock price.
* Sa
ybaser
#美股存储板块跌幅扩大
The core question is whether this represents a healthy correction following a rally driven by artificial intelligence (AI), or the beginning of a deeper repricing process within the storage sector. Rather than buying simply because prices have fallen, it would be more prudent to focus on earnings expectations, memory pricing, and whether each company can maintain its profit margins.
My perspectives on storage sector stocks:
* Micron (MU): Monitor demand for DRAM and HBM, memory growth linked to AI, and gross profit margin forecasts. Strong AI demand could bolster earnings, though these expectations may already be priced into the stock.
* SanDisk (SNDK): Focus on NAND flash pricing, demand for enterprise SSDs, and the sustainability of any earnings recovery. NAND supply and price cycles can make this stock particularly volatile.
* Western Digital (WDC): Evaluate "nearline" (high-capacity/accessible) HDD demand from AI data centers, cloud computing expenditures, and free cash flow. The factors influencing HDD demand differ from those affecting NAND and DRAM.
* Seagate (STX): As data center storage requirements grow, keep an eye on demand for high-capacity drives, pricing power, and profit margins.
* Track NAND market conditions, enterprise SSD adoption rates, and the company's valuation relative to earnings expectations.
What signs might justify rebuilding a position? I would look at the following three points:
* Stabilization of fundamental indicators: A halt in the deterioration of memory and NAND prices, company forecasts, and earnings estimates.
* Confirmation through price action: Stocks forming higher lows and reclaiming key moving averages, accompanied by stronger trading volume.
* Attractive valuation: Expected earnings growth that justifies the current price, even under less optimistic scenarios.
A decline in a stock price is not, by itself, a buy signal. If earnings estimates are falling faster than the stock price, the valuation may not have actually become cheaper.
Rather than buying the entire storage sector indiscriminately, I prefer to differentiate between individual companies. While AI demand serves as a long-term tailwind, memory, NAND flash, and hard disk drives each have their own unique supply cycles, competitive pressures, and profit margins.
An important distinction: A pullback driven by profit-taking is fundamentally different from one caused by weak forward guidance or falling memory prices. The latter scenario warrants a much more cautious approach. Which of these stocks—MU, SNDK, WDC, or STX—are you following most closely? I can help you compare their valuations, earnings outlooks, technical levels, and the potential factors that could support a recovery.
$MU ‌$SNDK ‌$WDC ‌$STX ‌
repost-content-media
MU-3.46%
SNDK-4.14%
WDC-4.16%
STX-5.08%
  • 1
🔥 Daily featured articles on Gate Square|10.10 is live
Follow the market while learning from the stories behind the trades 💡
How can you control drawdown after a string of losses? After learning all those indicators, how can you trade better? WCTC S9 kicks off— which teams are recruiting members? Which article would you like to read first today?
🛡️ @阿晨bit |A string of losses is not scary, but have you calculated your drawdown clearly?
🧠 @Web3良轩Mr蒋 |You’ve learned quite a few indicators, so why are your trades still not g
GateSquare
🔥 Gate Square Daily Top Posts | 10.10 Highlights
Check the market, and the lessons behind the trades 💡
How do you control drawdowns during a losing streak? After learning quite a few indicators, how do you execute trades well? With WCTC S9 kicking off, which teams are recruiting? Which of these 8 posts would you like to read first?
🛡️ @阿晨bit | Losing streaks aren't scary—but have you properly calculated your drawdown?
🧠 @Web3良轩Mr蒋 | You've learned quite a few indicators, so why are your trades still not going well?
🎁 @独领风骚必暴富 | Claim the launch rewards first, then set off with the HOPE team
🏆 @凉拌杀手2 | A new season begins—which team will you team up with to climb the rankings this time?
📝 @金牌讲师 | Want to join a team? How do you apply?
📉 @xinxin2026 | After showing unrealized profit on a BTC short, why is he still looking toward 80K?
🎬 @苏森有很多木头 | After falling back to a key zone, what comes next for BTC?
🌐 @JS大鲨鱼 | Oil prices, U.S. Treasuries, and tech stocks—what is the market trading?
🎁 Selected authors receive 3 days of traffic support and have their content featured.
Come to Gate Square to discuss your views with authors and share your own trading insights 👇
https://www.gate.com/post
The next top post may come from you!
#每日神贴 #Gate广场
repost-content-media
BTC-0.74%
#GateStockInsightsChallenge + $MRVL
🚨 $MRVL Earnings Season Has Arrived: Is Marvell Ready for Another AI Breakout?
Marvell Technology is heading into one of the semiconductor industry's biggest earnings announcements, and the current backdrop is truly notable. 🔥
After an impressive AI-driven rally, $MRVL is now trading around $240, putting investors at an important crossroads: Can strong AI demand and its partnership with Google justify an even higher valuation, or have expectations become excessive?
📈 The Rally Has Already Been Very Strong
MRVL has delivered an extraordinary gain, rising
CryptoChampion
#GateStockInsightsChallenge + $MRVL
🚨 $MRVL Earnings Are Here: Is Marvell Ready for Another AI-Powered Explosion?
Marvell Technology is heading into one of the biggest earnings moments in the semiconductor sector, and the setup is absolutely fascinating. 🔥
After an incredible AI-driven rally, $MRVL is currently trading around $240, putting investors at a critical crossroads: can strong AI demand and the Google partnership justify even higher prices, or have expectations become too aggressive?
📈 The Rally Has Already Been Massive
MRVL has delivered extraordinary gains, rising nearly 196% year to date and more than 253% over the past twelve months. The stock has also surged around 23% in the past month, showing that investor enthusiasm remains extremely strong.
But this is not a low-risk momentum story anymore.
The stock has already experienced huge swings, previously falling roughly 50% from its highs before recovering strongly. That tells us one important thing: MRVL is a high-beta AI stock, and volatility can move extremely fast in both directions. ⚡
🤝 The Google Deal Changed Everything
The biggest reason behind the renewed excitement is Marvell's expanding AI relationship with Google.
Marvell issued Google a warrant allowing it to purchase up to 58.97 million shares at $206.58, with vesting tied to future revenue generated from custom AI products, networking solutions and memory technologies.
This partnership could become a major long-term growth engine. 🚀
The real opportunity is custom AI silicon. Analysts believe Marvell's custom AI accelerator and ASIC business could potentially exceed $4 billion next year and move toward $10 billion by 2028 if hyperscaler demand continues accelerating.
That is why the market is watching guidance almost more closely than the quarterly numbers.
📊 What Wall Street Expects
For fiscal Q2 2027, expectations are approximately:
💰 Revenue: $2.71 billion
📈 Revenue Growth: Around 35% YoY
💵 Non-GAAP EPS: Around $0.93
📊 EPS Growth: Around 39% YoY
Management has also pointed toward roughly $3 billion in quarterly revenue for fiscal Q3, which would represent another major step forward.
The data center business remains the heart of the Marvell story, contributing roughly 74%–76% of total revenue. AI accelerators, optical networking and custom silicon are now the key engines investors are betting on.
🎯 The Market Is Pricing a Huge Move
Options traders are expecting roughly a 12.4% earnings move, equal to approximately a $30+ swing.
Starting near $240, that creates two major scenarios:
🚀 Bull Case: Strong revenue beat + raised guidance + powerful Google commentary could push MRVL toward $252, then $265–$268, with a major breakout potentially targeting $280–$288.
🐻 Bear Case: Weak margins, cautious guidance or slower custom-chip growth could send the stock back toward $234, then the important $220–$222 support zone.
A deeper disappointment could even bring the stock toward the $206–$208 area, which is especially important because it sits close to Google's warrant strike price.
📍 Key Levels To Watch
🔹 Immediate Support: $234–$235
🔹 Major Support: $220–$222
🔹 Deep Support: $206–$208
🔸 First Resistance: $252–$253
🔸 Next Resistance: $265–$268
🔸 Bull Target: $280–$288
🔸 Long-Term Major Zone: $300+
📈 My Outlook
At $240, MRVL remains one of the most exciting AI infrastructure stocks in the market, but expectations are now extremely high.
For me, the most important things to watch are:
👀 Data center growth
👀 Gross margin trends
👀 Google custom-chip revenue
👀 New hyperscaler design wins
👀 Fiscal Q3 guidance
My view is cautiously bullish. 💡 The long-term AI story remains powerful, and a strong earnings report could put $280–$300 back into focus. However, with such a massive rally already behind it, even a small disappointment could trigger aggressive profit-taking.
$MRVL at $240 is not a simple bet anymore — it is a high-growth, high-expectation, high-volatility AI opportunity. 🚀⚠️
📍 Not financial advice. Always do your own research.
#Gate股票观点挑战 @Gate_Square #GateSquare #TopFiveLeaguesPreMatchPredictor
#GateEventContractsPointsLeaderboard
repost-content-media
MRVL-2.71%
Macro shock! Trump has unleashed an “oil nuclear bomb”—has the overture to a super bull market begun?
“Macro liquidity tides always precede the frenzy of candlestick charts.”
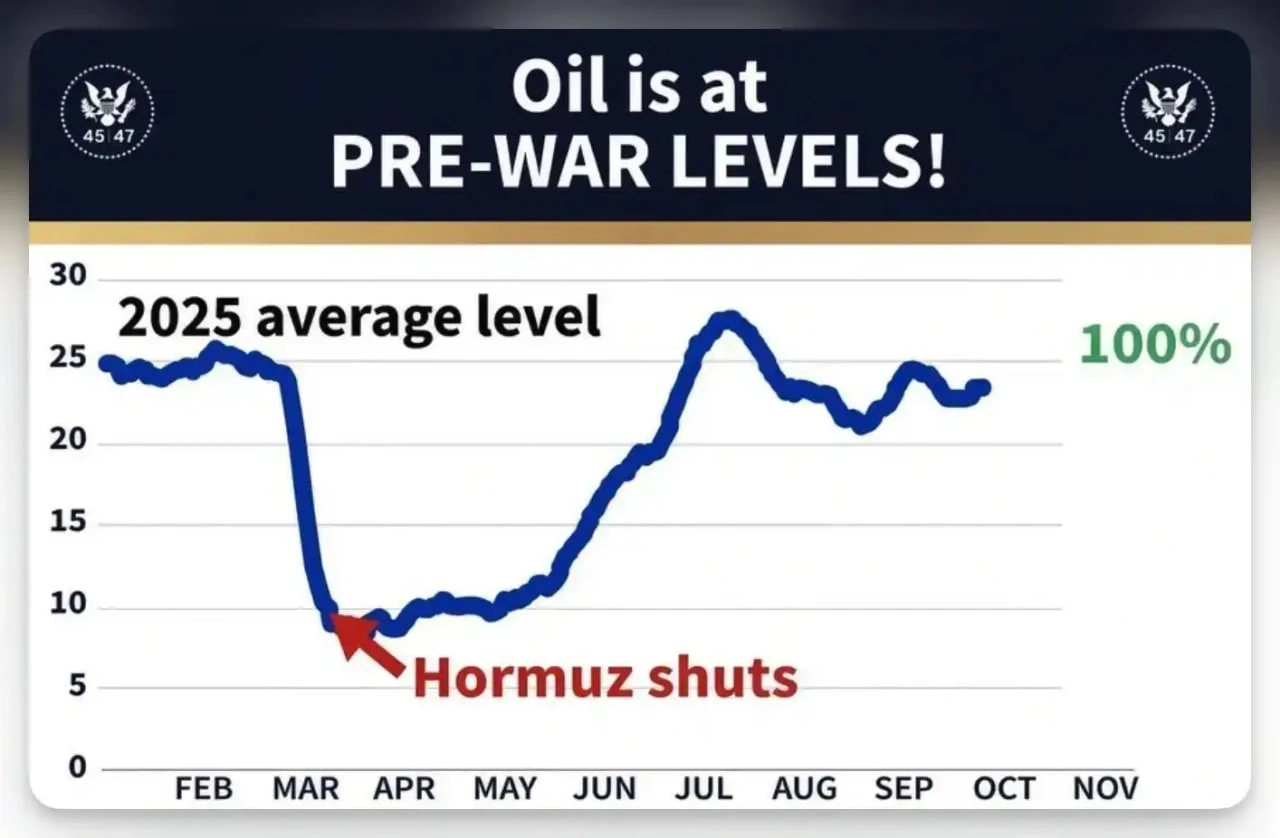
Based on the latest fundamentals, Trump declared that the U.S. military has completely controlled the Strait of Hormuz, with oil shipments far exceeding prewar levels. At the same time, cheap Russian diesel is providing support, forcing U.S. refineries to cut prices across the board.
In my personal view, this is definitely not merely a geopolitical struggle, but a precisely executed “nuclear strike on inflation.” Oil is t
Miger
Macro earthquake! Trump unleashes an “oil nuclear bomb”—the prelude to a raging bull market has sounded?
“The tide of macro liquidity always precedes the frenzy on the K-line.”
According to the latest fundamentals, Trump announced that the U.S. military has completely taken control of the Strait of Hormuz, with crude oil shipments dwarfing pre-war levels. At the same time, low-priced Russian diesel is coming to the rescue, forcing U.S. refiners to slash prices across the board.
In my view, this is by no means merely a geopolitical contest, but rather a precisely targeted “nuclear strike against inflation.” As the mother of inflation, a supply-side surge in crude oil will cause CPI expectations to plunge, forcibly broadening the Federal Reserve’s path to rate cuts.
Looking back at history, the global liquidity flood that followed the 2020 oil crash sent BTC straight to 69000. Now that traditional energy pricing power is being reshaped, massive liquidity will inevitably spill over into risk assets. Amid synchronized moves in commodities, the crypto market is by no means a safe haven, but rather the main battlefield for an explosive influx of capital!
The smokescreen of the main players’ shakeout has already been released. Are the chips in your hands still there? Follow Mige—Mige will help you precisely position for macro dividends! #Gate亮相TOKEN2049
repost-content-media
BTC-0.76%
$SPCX
Surging from 112 to a high near 152 this week, it is currently consolidating around 143.58 (+0.25%).
SuperTrend turned red intraday after rejection at 148.43, so in the short term, the price is taking a breather before the next upward move.
This is a tokenized way to gain exposure to SpaceX before its IPO without actually holding equity; remember that this is a simulated warrant, not a real stock.
GateLive
🌈 #GateLiveStreamingInspiration - Sep.10
Go live with the following topics now to receive extra official support and promotional exposure!
Today's Topic Recommendations:
🔹All Three Major U.S. Stock Indexes Fall for a Third Straight Day! Memory and optical communication stocks buck the trend as Apple unveils its foldable iPhone. Where is the next big opportunity in tech?
🔹Crypto Market Pulls Back Slightly! BTC slips below $78,000 this morning while ZEC approaches $1,300. Is capital starting to hunt for a new market narrative?
🔹Bitcoin Is Up 22%, but Miners Have Barely Moved! Why have Bitcoin mining stocks become the laggards of this bull run?
🔹On-Chain Meme Coins Cool Off Across the Board! MEME, CASHCAT, 4Stock, and USELESS all fall. Is the Robinhood Chain frenzy coming to an end?
🔹LAPTOP Plunges and Sparks Controversy! Biden’s son denies profiting and says he plans to “take back the narrative” for the long term. Are celebrity Meme coins still worth playing?
🔹BNC Stock Tumbles 15.62%! On-chain BNC4 trades at a roughly 23% premium to the underlying stock. Why is such a huge price gap emerging in tokenized stocks?
🔹Apple’s First Foldable iPhone Duo Is Here! Can the new device spark an upgrade cycle and give Apple shares another boost?
🔹Block Applies for a U.S. Federal Banking Charter! With plans for Bitcoin and stablecoin custody, are crypto companies turning into the “new banks”?
🔹U.S. DOJ Targets Nvidia’s Deal With Groq! With an antitrust investigation underway, could regulators put the brakes on Nvidia’s AI expansion?
🔹Trump Says the Iran War Will End After the Midterm Elections! With negotiations still possible, how would easing tensions affect oil prices and global markets?

🔥 Start streaming now: https://www.gate.com/live/apply
repost-content-media
SPCX-0.86%
$SPCX
Surging from 112 to a high of nearly 152 this week, it is currently consolidating around 143.58 (+0.25%).
SuperTrend turned red during the day after being rejected at 148.43, so in the short term, the price is taking a breather before the next upward move.
This is a tokenized way to gain exposure to SpaceX before its IPO without actually owning shares; keep in mind that this is a simulated certificate, not a real stock.
CasAbbe
$SPCX
Ripped from 112 to a high near 152 this week, now consolidating around 143.58 (+0.25%).
SuperTrend flipped red intraday after rejecting 148.43, so short-term it's taking a breather before the next leg.
This is the tokenized way to get pre-IPO SpaceX exposure without actually holding equity, worth remembering it's a mirror note not real shares.
repost-content-media
SPCX-1.77%
#Gate股票观点挑战
Pons is quietly making a major advance in prediction markets and on-chain trading. Data from DefiLlama shows that Pons generated approximately $693,125 in protocol revenue over 24 hours, ranking 8th among tracked protocols and surpassing several more familiar names.
The most notable comparison is with Polymarket, a platform that recorded approximately $635,221 over the same 24-hour period. Pons also surpassed fomo, which generated approximately $646,539. The gap is significant: Pons generated about $58,000 more than Polymarket and about $47,000 more than fomo during the measured
mohamed4145
#Gate股票观点挑战
Pons is quietly making a major move in the prediction-market and on-chain trading landscape. According to DefiLlama data, Pons generated approximately $693,125 in 24-hour protocol revenue, placing it 8th among tracked protocols and putting it ahead of several better-known names.
The most notable comparison is with Polymarket, which recorded around $635,221 in the same 24-hour period. Pons also surpassed fomo, at approximately $646,539. The gap is meaningful: Pons generated roughly $58,000 more than Polymarket and about $47,000 more than fomo during the measured window.
At the top of this particular comparison was Hyperliquid, with approximately $758,325 in 24-hour protocol revenue. That leaves Pons only about $65,000 behind Hyperliquid, showing how competitive the current revenue rankings have become.
The bigger takeaway is not simply that Pons reached eighth place. Revenue is an important indicator because it reflects actual economic activity flowing through a protocol rather than only token price or headline trading volume. Breaking above established platforms such as Polymarket in a single 24-hour period suggests that Pons is attracting meaningful user activity and monetization.
However, a 24-hour ranking should not automatically be interpreted as a long-term trend. Protocol revenue can fluctuate significantly depending on market conditions, major events, user activity and trading intensity. The more important question is whether Pons can maintain elevated revenue across multiple days and eventually convert short-term momentum into consistent protocol activity.
For the broader market, this is another sign that competition among on-chain trading and prediction platforms is intensifying. Hyperliquid remains a major revenue leader, while protocols such as Pons are showing that smaller or newer platforms can quickly climb the rankings when activity accelerates.
Key numbers: Pons $693,125 → Hyperliquid $758,325 → fomo $646,539 → Polymarket $635,221 in 24-hour protocol revenue.
The real signal to watch next is simple: Can Pons continue generating revenue near the $700K daily level, or was this an isolated surge? Sustained performance would make the latest ranking far more significant. @Gate_Square
NVDA+0.23%
The market suddenly shifted, with the trend turning bullish, causing the floating losses of quite a few people to rapidly widen; their positions were moving against the actual market direction, and the pressure they felt is easy to imagine.
This situation is actually not uncommon. The instinctive first reaction for many people is to keep waiting, hoping that the price can return to its initial level so they can exit at breakeven. This thinking is very simple, but the market has never changed its rhythm just because we wait. Occasionally, the market does turn back once or twice, making people f
OldXu'sWindVane
The market suddenly changed, turning upward, and many traders’ unrealized losses are rapidly expanding as the direction of their positions runs counter to the actual trend. The mental pressure is easy to imagine.
This situation is actually quite common. For many people, the first instinct is to wait a little longer, hoping that the price will return to its original level so they can exit without either making or losing money. This thought is simple and understandable, but the market never changes its pace simply because we wait. Occasionally, the market may indeed recover once or twice, making people feel that “waiting” is effective. But once this becomes a habit, it means completely handing control over to an unpredictable trend. In the long run, passive waiting often allows an unfavorable situation to deepen. A small fluctuation that was originally manageable may develop into a larger drawdown that is difficult to handle, leaving even less room for subsequent operations.
Behind price movements lies a contest between human nature and emotions; they are not entirely without discernible patterns. The key is whether our pace can keep up with these changes. Rather than pinning our hopes on an uncertain rebound, it is better to proactively assess whether our current position is reasonable. For example, is the proportion of our current position within a range that we can calmly accept? If the market continues moving in its current direction, do we have a clear point at which to respond?
There is no point dwelling on past choices; what matters is what to do next. When a position has already made you feel anxious, it may be a signal to reorganize your thinking. Proactive adjustment is not admitting defeat; it is keeping risk within a range you can manage and leaving room for subsequent operations.
I can currently open up 2 spots to review your positions. I can combine the current market conditions with your situation to sort through possible next steps, helping break down the complex situation and make your decisions clearer.
The above is for discussion and analysis only. Please view market fluctuations rationally.
$BTC $XAU $SNDK
BTC-0.76%
XAU+0.52%
SNDK-4.14%
$XBRUSD ‌$XTIUSD ‌
#GateStockInsightsChallenge
Oil Adjusts, Hormuz Normalizes and Bitcoin at $78,000: A Macro Story Connecting Both Markets
The oil market is undergoing a major repricing on August 26, with XBR around $88.65 and XTIUSDT around $82.55, while Bitcoin remains near $78,000–$79,000 after quickly moving above $80,000. At first glance, crude oil and Bitcoin appear to be completely different markets, but current developments show how closely they can become connected through inflation, interest-rate expectations, liquidity and overall risk appetite. Oil is declining as expectation
GateUser-e9411d91
#StrategyAdds4603BTC
STRATEGY IS BUYING BITCOIN AGAIN — AND THE $370M MOVE SENDS A BIGGER SIGNAL THAN THE NUMBER ALONE
Strategy has officially returned to aggressive Bitcoin accumulation.
The company announced the purchase of 4,603 BTC for approximately $370 million, at an average acquisition price of $81,418 per Bitcoin, including fees and expenses. The move increased Strategy’s total Bitcoin holdings to an extraordinary 845,050 BTC, worth roughly $66.4 billion at recent market prices.
That represents around 4.02% of Bitcoin’s maximum 21 million supply.
In other words, Strategy effectively controls about one out of every 25 Bitcoin that will ever exist.
But the most important part of this announcement may not be the size of the purchase.
It is the timing.
Strategy had not reported a Bitcoin purchase since June 22, when it added 520 BTC. That created a roughly ten-week accumulation pause, during which its Bitcoin holdings remained around 840,447 BTC.
Then, on August 30, Executive Chairman Michael Saylor posted two simple words on X:
“We’re back.”
One day later, the company revealed the 4,603 BTC purchase.
That sequence makes the message difficult to ignore: Strategy’s Bitcoin accumulation machine appears to be running again.
And the balance sheet tells an even deeper story.
Alongside the Bitcoin purchase, Strategy increased its USD cash position by $29 million, taking total USD assets to approximately $6.71 billion. The company also repurchased around $152 million of STRC preferred stock, while reporting 0.0% net leverage.
So this was not simply a Bitcoin purchase.
Strategy simultaneously increased BTC exposure, maintained a substantial cash reserve, and reduced preferred-stock exposure.
That creates a much stronger financial structure for future accumulation.
The wider corporate Bitcoin race is also becoming more competitive. Strive recently added approximately 1,800 BTC worth around $143 million, purchased at an average price near $79,431, while other corporate treasury companies such as Metaplanet continue building their Bitcoin positions.
Now consider Bitcoin itself.
BTC has recently been trading around $78,600, with intraday levels near $77,900. Short-term performance has been relatively flat, but the bigger picture remains impressive.
Bitcoin is approximately 25.1% higher over the past 30 days, recovering from around $62,800 on August 1. Over 90 days, BTC is up roughly 17.7%, while the rally from the $57,813 July 1 cycle low has reached approximately 35.9%.
However, Bitcoin is still around 12.7% below its 2026 opening level near $89,987 and approximately 19.8% below the January 14 high of $97,942.
That makes Strategy’s latest purchase particularly interesting.
The company is buying thousands of Bitcoin around the $80,000 region, despite BTC still being well below this year’s high.
For the market, that represents additional institutional demand.
But there is an important reality check: $370 million does not guarantee a Bitcoin pump.
Bitcoin trades billions of dollars in volume, and price is influenced by ETF flows, derivatives positioning, liquidations, Federal Reserve policy, inflation data, the U.S. dollar, whale activity and overall risk sentiment.
Strategy’s purchase is therefore better understood as a structural signal rather than a one-day price catalyst.
For Strategy itself, the mathematics are equally important.
Its overall Bitcoin average acquisition cost stands near $75,412 per BTC, compared with BTC around $78,600. That puts the treasury position approximately 4.2% above cost, representing an estimated paper gain of around $2.7 billion on roughly $63.73 billion invested.
The latest 4,603 BTC, purchased at $80,318, is slightly underwater at current prices — but Strategy’s investment thesis is measured in years, not days.
And with the company continuing to focus on increasing Bitcoin exposure per share, every additional BTC potentially strengthens that long-term strategy.
My view?
This is a meaningful bullish signal — but not a guaranteed price floor.
Strategy has shown that its conviction in Bitcoin remains intact after a ten-week pause. More importantly, the company appears to have used that period to strengthen liquidity and manage its capital structure before returning to accumulation.
If ETF inflows remain strong, institutional demand continues, and other corporations follow Strategy’s example, the impact could become much larger over time.
The real story is therefore not simply that Strategy bought 4,603 BTC.
The bigger story is that the world’s largest corporate Bitcoin holder has restarted accumulation around $80,000.
That tells the market something powerful:
Strategy still believes Bitcoin is undervalued on a multi-year horizon.
Whether the market agrees immediately is another question.
Watch the next weekly purchase.
Watch ETF flows.
Watch corporate treasury announcements.
Because if more companies start buying again, Strategy’s latest $370 million purchase could become less of an isolated headline — and more of the opening signal for another major wave of corporate Bitcoin accumulation.
#Gate事件合约晒单挑战 @Gate_Square #GateSquare #GateEventContractTradeSharingChallenge
XBRUSD+0.27%
XTIUSD-0.39%
BTC-0.76%
NVDA+0.23%
$XBRUSD ‌$XTIUSD ‌
#GateStockInsightsChallenge
Oil Adjusts, Hormuz Normalizes, and Bitcoin at $78,000: A Macro Story Connecting Both Markets
The oil market is undergoing a major repricing on August 26, with XBR around $88.65 and XTIUSDT around $82.55, while Bitcoin remains near $78,000–$79,000 after briefly moving above $80,000. At first glance, crude oil and Bitcoin appear to be completely different markets, but current developments show how closely they can become linked through inflation, interest-rate expectations, liquidity, and overall risk appetite. Oil is falling as expectations o
Jiaa_Insights
$XBRUSD ‌$XTIUSD ‌
#GateStockInsightsChallenge
Oil Pullback, Hormuz Normalization and Bitcoin at $78K: One Macro Story Connecting Both Markets
The oil market is going through a major repricing phase on August 26, with XBR around $88.65 and XTIUSDT around $82.55, while Bitcoin is holding near $78,000–$79,000 after briefly breaking above $80,000. At first glance, crude oil and Bitcoin appear to be completely different markets, but the current move shows how closely they can become connected through inflation, interest-rate expectations, liquidity and overall risk appetite. Oil is falling as expectations for improved shipping conditions through the Strait of Hormuz reduce part of the geopolitical supply premium, while Bitcoin is consolidating after a powerful weekly rally.
The biggest development in crude remains the possibility of a temporary shipping corridor through Hormuz. Iran and Oman have been discussing arrangements aimed at improving navigation and potentially allowing more commercial traffic through the strategic route. The market is responding before physical supply has fully normalized. This distinction is important because oil prices reflect expectations about future supply as well as current inventories. If traders believe more vessels will soon be able to move safely, the probability of an extended shortage decreases, and part of the geopolitical risk premium can disappear.
That is exactly what we are seeing in XBR at $88.65. The $90 level is now an important psychological resistance. If Brent can reclaim and hold above $90, it would suggest that buyers are attempting to rebuild the geopolitical premium. But continued trading below $90, followed by a break of the $86–$87 area, would strengthen the normalization thesis and could bring $84–$85 into focus. The market therefore has a clear technical battle between the previous supply-risk premium and the possibility of returning toward a more normal oil environment.
For XTIUSDT at $82.55, the technical structure is equally important. The immediate decision area is around $82–$83, while $85 becomes the first meaningful recovery level. If WTI reclaims $85 with strong momentum, the bearish pressure could weaken and prices could move toward $86–$88. But a decisive break below the psychological $80 level would be much more important. Sustained trading under $80 could open the way toward approximately $77–$78, particularly if Hormuz shipping activity continues to normalize.
However, actual physical traffic remains a key uncertainty. Recent reporting showed commercial vessel activity through Hormuz still running below its normal level, meaning the current oil decline is partly an expectations trade rather than proof that supply conditions have completely returned to normal. If traffic continues increasing, the bearish case for crude becomes stronger. If negotiations fail or shipping risks suddenly increase again, the risk premium could return quickly.
Now this becomes particularly interesting for Bitcoin.
BTC has just experienced one of its strongest short-term rallies of the year, climbing more than 23% over the past week and briefly breaking above $80,000 before traders began taking profits. On August 26, Bitcoin slipped roughly 1% toward the $79,000 region as the market consolidated after the sharp advance. CryptoQuant's Bull Score also rose to 80, its highest level since October 2025, with spot and futures demand expanding together.
The current BTC setup therefore looks different from the oil setup. Oil is losing part of its geopolitical premium, while Bitcoin is attempting to hold the gains created by improving liquidity expectations and renewed institutional demand. Recent ETF activity has also strengthened: U.S. spot Bitcoin ETFs recorded roughly $1.92 billion of inflows last week, the strongest weekly performance of 2026 according to recent market reporting.
This creates an interesting macro chain:
Lower oil → lower inflation pressure → potentially softer rate expectations → improved liquidity → stronger risk appetite → potential support for BTC.
Of course, this relationship is not automatic. Bitcoin can fall even when oil falls if investors interpret the move as evidence of weakening global demand or if risk sentiment deteriorates. But in the current environment, falling crude prices are helping reduce one of the inflationary risks that had been worrying markets.
BTC's immediate technical structure is therefore worth watching closely. Around $78,000–$79,000, Bitcoin is attempting to consolidate after its move above $80,000. The first major resistance remains around $80,000–$81,000, followed by approximately $83,000 if buyers can regain control. A sustained breakout above $83,000 would strengthen the short-term bullish structure and could bring $85,000 into focus.
On the downside, $77,000–$78,000 is the first important support area. If BTC holds this zone while ETF demand and spot activity remain strong, the recent breakout structure can remain intact. A deeper move below $75,000 would be more concerning because it would suggest that the latest rally is losing its momentum rather than simply experiencing normal profit-taking.
The cross-market picture is therefore becoming extremely interesting. XTIUSDT at $82.55 is approaching the critical $80 threshold, XBR at $88.65 is fighting to remain above the mid-$80s, while BTC around $78K–$79K is trying to consolidate above a major psychological breakout region.
The next major catalyst for crypto is also not isolated from traditional markets. Investors are watching U.S. inflation data, Treasury yields, Federal Reserve expectations and the upcoming Jackson Hole communication, while NVIDIA's earnings could influence broader technology and risk-asset sentiment. Lower oil prices are helping ease inflation concerns, while Bitcoin is simultaneously benefiting from renewed demand and improving liquidity expectations.
My current view is neutral-to-bullish for BTC but cautious around resistance, and bearish-to-neutral for oil while the Hormuz normalization story remains intact. For oil, the key levels are clear: XTIUSDT $80 downside threshold and $85 recovery level; XBR $86–$87 support and $90 resistance. For Bitcoin, $77K–$78K is the immediate support zone, $80K–$81K the first major resistance, and $83K the next confirmation level.
The important point is that these markets are now telling a connected macro story. If Hormuz shipping continues improving, oil remains under pressure, inflation expectations could ease and liquidity conditions could become more supportive for risk assets. That environment could help Bitcoin defend its recent gains.
But if geopolitical tensions return, crude could rapidly recover, inflation expectations could rise again and the entire risk-asset equation could change.
Oil is testing whether the geopolitical premium can disappear. Bitcoin is testing whether its $80K breakout can survive profit-taking.
For now, $80 WTI, $90 Brent and $80K Bitcoin are the three levels I would keep closest on the screen.
#OilMarket
#StraitOfHormuz
@Gate_Square
XBRUSD+0.27%
XTIUSD-0.39%
BTC-0.76%
NVDA+0.23%