
Share your thoughts
placeholder
Article
I did nothing—just went to the bathroom, and when I came back, the candlestick had already done the work for me. When the market dumped early, I glanced at the volume: the rebound was weak, overhead resistance was obvious, and every push upward fell just short. This isn’t what strength looks like; it’s fuel for the shorts.

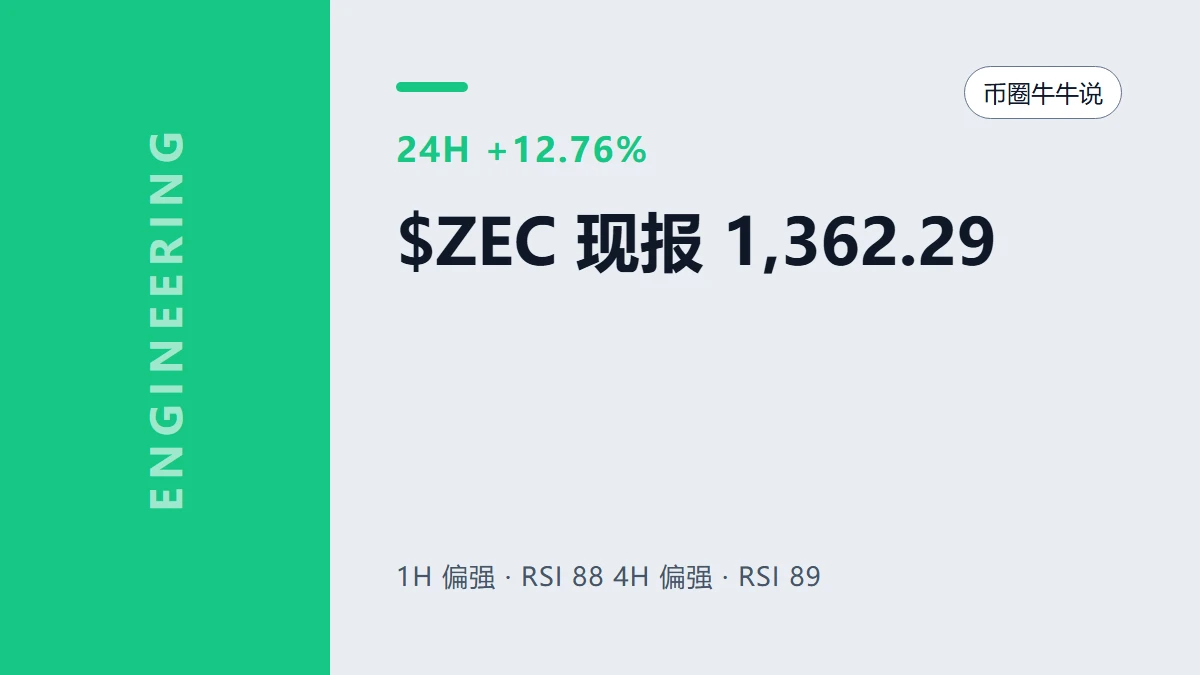
$ZEC $SOL
post-image
ZEC+2.63%
SOL+2.84%
[New Streamer]BTC CORRECTION | MAKE YOUR PROFIT
live-cover
LIVE11
9.6 DASH Coin Analysis
Put simply, DASH’s surge this time was driven by the Grayscale Zcash ETF taking off, with funds moving through privacy coins one by one and DASH, as an established leader, getting picked next. Technically, it formed a golden pit at 54.15 (below the Bollinger lower band at 62.32), followed by a large bullish candle that surged straight to 74.63—the textbook “whale accumulation–violent rally–breaking away from cost basis.” The price is now pulling back to the middle band at 67.45, while the MACD golden cross remains in place (0.09). The bulls are not completely dead, but $
post-image
DASH+21.40%
ZEC+3.21%
With this trend, I don't even need to think—the account is partying on its own.

When I opened the chart this morning, $BASED held after the pullback, funds quietly entered, and volume began recovering. These signs had already appeared around 0.05933.

Now it's at 0.06948, with unrealized gains of +824.46%. This profit feels really good; everyone aboard must be smiling.

But no matter how good it feels, the rules can't be broken: take profit on 80% first and bank the bulk of it; move the stop-loss on the remaining 20% to the entry price and let it choose its own direction. If it dares to p
post-image
BASED+1.89%
LAB+2.42%
DOGE+6.86%
Financial News, Crypto Updates, Real-World Strategies
live-cover
LIVE882
massive spike in fomo volume yesterday
> $428.65m traded
two weeks ago all trading terminals were doing less than $400m combined
post-image
The essentials… Let’s talk about Bitcoin’s long-term cycle and some of my personal views, for reference only—not investment advice. These are merely records of historical reviews.
As seen in Chart [1], the price has formed a double-bottom pattern around a major level and a high-volume trading zone; based on the volume-price relationship, after a prolonged decline, two waves of panic-driven bottom testing have occurred. Following two waves of support and consolidation, the price broke through the bottoming region on August 17 with a high-volume bullish weekly candle, gaining nearly 26.5%. Judgi
Everyone’s staring at SKYAI’s bounce—but the 4h chart just screamed something they’re ignoring.

$SKYAI /USDT - SHORT

Trade Plan:
Entry: 0.05955 – 0.06017
SL: 0.06280
TP1: 0.05766
TP2: 0.05619
TP3: 0.05399

Why this setup?
- 95% confidence on the short, and the 1D trend is already bearish—this isn’t a guess, it’s gravity.
- RSI on the 15m is at 63.66, meaning the last pop is running out of fuel right at our entry zone (0.05986).
- Why now? Price is hugging resistance between 0.06017 and 0.05955, while ATR (0.001223) shows volatility is compressing—breakouts here tend to snap hard.
-
SKYAI+5.21%
🛍️ QOMEX Summit returns to Dubai on 9 September 2026.
Its second edition will examine how AI, personalization and connected infrastructure are changing digital commerce, with 200+ senior leaders expected.
🤖 AI agents and automated customer journeys
⚡ Quick commerce and omnichannel operations
🔗 Data, payments and API-first platforms
📍 Al Habtoor Grand Resort, Autograph Collection, Marina, Dubai
Full announcement on BTCWire:
$SOL Signal】1H volume-expansion rally, bullish momentum across multiple timeframes
$SOL The 1H MACD histogram continues expanding at 0.1382, with 4H expanding in sync. The funding rate remains stable at 0.0033%, the bid-side share is 1.08, active buy orders surged to 580,000 lots between 12:00 and 13:00, and the price has held above EMA20.
🎯Direction: Long
⚡Entry/Limit order: 102.9004 - 103.2100
🛑Stop-loss: 102.1779
🚀Target 1: 104.7582
🚀Target 2: 105.5322
🛡️Trade management:
- Execution strategy: After reaching Target 1, reduce the position by 50% and move the stop-loss up to breakeven.
post-image
SOL+2.84%
BTC+0.83%
ETH+1.43%
Everyone’s watching ADA’s 15m RSI scream at 70—but the 4h chart is whispering a dirty secret nobody wants to hear.

$ADA /USDT - SHORT

Trade Plan:
Entry: 0.2177 – 0.2189
SL: 0.2237
TP1: 0.2142
TP2: 0.2115
TP3: 0.2075

Why this setup?
Why now?
- 1D trend is a **range**, not a breakout—mean reversion is the game.
- RSI 15m at 70.55 = overheated micro-spike, ripe for a snapback.
- ATR 1h (0.002252) tells us volatility is thin—traps are cheap to set.
- Entry ref 0.2183 with TP1 at 0.2142 (1.9% drop) is the low-hanging fruit, not the moon shot.

Debate:
Is this a fake pump to short int
ADA+3.93%
📊 MARKET: The crypto market added $14B in less than 24 hours, signaling a fresh increase in market strength.
With capital flowing back into digital assets, traders are watching whether this momentum can continue and push major cryptocurrencies toward new highs.
$BTC $ETH $BNB $SOL
#Gate60MillionUsers
post-image
BTC-2.35%
ETH-2.49%
BNB+8.42%
SOL+2.84%
  • 10
  • 2
#ShareMyFutureTradingReturns
it's loss 😢😢😢
$ETH Signal】1H breakout + bullish expansion
$ETH 1H momentum expands upward, and the price accelerated after breaking through 2461, with the high reaching 2473. The 4H MACD green bars are narrowing, indicating that bearish strength is fading. EMA20 and EMA50 are converging near 2458, with the short-term moving averages supporting the price. The funding rate is 0.0017%, showing no signs of overheating. Depth imbalance is -67%, with relatively heavy sell-side orders, but the price continues to rise as selling pressure is being absorbed by aggressive buyers. The risk-reward ratio at this level
post-image
ETH+1.36%
BTC-2.35%
SOL+2.87%
I see a lot of peolple say "how many times have you been wrong on $ICP ?"
Dude i dont need to be right everyday. I only need to be right the day $ICP touches $50 , $100 etc, but i understand that takes years in the making so im wiiling to be "wrong" everyday until that one day alone.
post-image
ICP+6.27%
JUST IN: Anthropic's Claude produced the first computer-checked formalization of Fermat's Last Theorem in Lean, closing a problem that stood for 350 years.
  • 2
Everyone’s staring at XLM’s 0.184—but the real trap is the 55% confidence you’re ignoring.

$XLM /USDT - SHORT

Trade Plan:
Entry: 0.184 – 0.184
SL: 0.188
TP1: 0.181
TP2: 0.179
TP3: 0.176

Why this setup?


Debate:
If 0.184 fails, do you trust the short to 0.179 or fade it back to 0.187?—tell me your stop placement.

⚠️ Personal market analysis only. NFA — manage risk and DYOR.
Educational content, not investment advice or a recommendation to buy, sell, deposit, or withdraw any asset. No paid promotion or referral/affiliate links.
XLM+3.69%
Everyone’s staring at 91.55—but the real trap is the 4h candle that hasn’t closed yet.

$CL /USDT - SHORT

Trade Plan:
Entry: 91.46 – 91.64
SL: 92.42
TP1: 90.90
TP2: 90.46
TP3: 89.81

Why this setup?
Why now? The range-bound 1D trend is your enemy—it rewards patience, punishes impulse.
- RSI 15m at 57.7 shows a weak bounce, not a breakout.
- ATR 1h (0.36) is tight: this coil snaps fast.
- Short bias (55) favors fading rallies into 91.64, not chasing longs.
- TP2 at 90.46 is only ~1.2% away—but only if 91.55 holds as resistance.

Debate:
Are you fading this pop to 91.64, or waiting
CL+0.91%
I originally only wanted to mooch a breakfast, but the market ended up trapping me in a six-month grind. I opened the chart this morning, and $SNDK ripped straight up from the 1503.37 area, without even giving me time to hesitate.

I had my eye on it during those days of bottom consolidation. Capital was quietly flowing in, key levels kept moving higher, and pullbacks never broke structure. I was actually worried that going long would make me grind through another round, but thankfully it didn't pull any tricks this time.

Now at 1761.84, +1220.73% secured. This run feels incredible—it's li
post-image
SNDK+2.91%
SOL+2.84%
DOGE+6.86%
Everyone’s staring at the 4H floor, but $HOME /USDT just armed a trapdoor at 0.00609—are you long enough to fall through it?

$HOME /USDT - SHORT

Trade Plan:
Entry: 0.00608 – 0.00610
SL: 0.00620
TP1: 0.00601
TP2: 0.00595
TP3: 0.00586

Why this setup?
Why now? The daily trend is already bearish, and this 4H signal is screaming SHORT with a 95% confidence score.
- RSI on the 15m is at 44.89—weak, no bounce fuel left.
- Entry zone 0.00608–0.00610 is a magnet; if we lose 0.00609, TP1 at 0.00601 is a formality.
- ATR (1h) is tight at 0.000047—the squeeze is primed for a sharp drop, not a
HOME+0.66%
Load More

Join 40 M users in our growing community

⚡️ Join 40 M users in the crypto craze discussion

💬 Engage with your favorite top creators

👍 See what interests you

View More