
Square
Following
Hot
News
Profile
Share your thoughts
placeholder
Article
Bullish on $SOCKS
post-image
With the same 1000U, some people are holding the bag at $WAL 0.0677, while others who bottom-fished at 0.0502 are already laughing. It is now 0.0512, down 15.7% in 24 hours, with a 565M trading volume—what does that indicate? Panic sellers are fleeing, but with selling this fierce, who is taking the other side?
Round one: the volume showdown. A 565M trading volume at this market-cap level means the turnover rate has been pushed to the limit. Rising volume during a decline either means the main players are unloading or that the market is shaking out and rotating holders. What is the difference
WAL-16.21%
1016 $DOGE Recent entry position for DOGE—just look at the daily chart. Every time the broader market makes any move, DOGE starts falling in advance.
I've bought at 0.06888 many times before and played the August range quite a bit. The last time, I held DOGE until it started moving at 0.083 and then exited. I haven't really watched DOGE since, because I think DOGE can sometimes be difficult to trade short-term.
We'll continue placing long orders around 0.06888 and 0.07, with a stop loss at the bear-market low of 0.067. Keep the stop-loss range slightly wider. Leave this long-term lottery orde
post-image
DOGE-0.33%
Careful, @crocat_x is an impersonator and most likely a rug!
Report.
The official crocat:native X is @CroCat_Token with CA 0x7Eb480c734eC5f6bd2B918F7393b59D59913DFFA
This is a good reminder as Cronos is getting more succesful, rugs and rats are also coming back.
Invest with eyes open, very easy to run in to these!
post-image
CRO+0.31%
🧑‍🍳 I touch crazy to get something done…and we all become friends 🫢
Bitcoin’s Long Term Cycle Chart Points to a Bigger Question: Are We in Another Accumulation Zone? 🙄
Bitcoin’s historical price cycles show a recurring pattern: major rallies, deep corrections, and long recovery periods.
The chart highlights previous peaks near $19,700 in 2017, $69,000 in 2021, and $126,000 in 2025, alongside earlier areas that some traders viewed as accumulation zones.
Now, the key question is whether the current price structure represents another opportunity to accumulate or whether the cycle is changing.
I think that the Historical patterns can offer useful context, but the
post-image
BTC+0.31%
🚨 JUST IN: 🇺🇸 Video platform Rumble transfers 95 $BTC to institutional crypto custodian and OTC trading provider Anchorage Digital. 👀
Rumble reported holding 293 Bitcoin at the end of Q2.
BTC+0.31%
Don’t even think about touching $BAT . It surged 26% in 24 hours, spiked to 0.2172 before crashing back to 0.2115, with $93 million in trading volume—this bizarre price-and-volume surge is a falling knife retail traders can’t catch.
But on-chain data shows that BAT’s active addresses have risen 40% over the past 7 days, while the Brave browser’s monthly active users have surpassed 80 million, so there is indeed substance to its fundamentals. The question is: Is this rally driven by news or purely a pump-and-dump? The order book shows huge sell orders around 0.2172, indicating extremely heavy sh
BAT+26.74%
The second target has been reached at 0.03300. Keep your eyes on it and secure your profits. Congratulations! 🎉🤑💰👇$AKE
post-image
AKE+21.31%
$GT ‌
Gate's derivatives trading data for September highlights the platform's growing momentum in this sector. Monthly derivatives trading volume reached $396.4 billion—a 38.2% increase from the previous month—marking the fastest growth rate among major exchanges.
This surge in volume has also translated into an expanded market share for Gate. The platform’s share of the derivatives market rose by 1.64 percentage points to reach 10.1%, securing it the third position in global rankings. This climb in the rankings reflects not only an increase in volume but also a highly competitive market posi
GT+0.09%
  • 5
  • 1
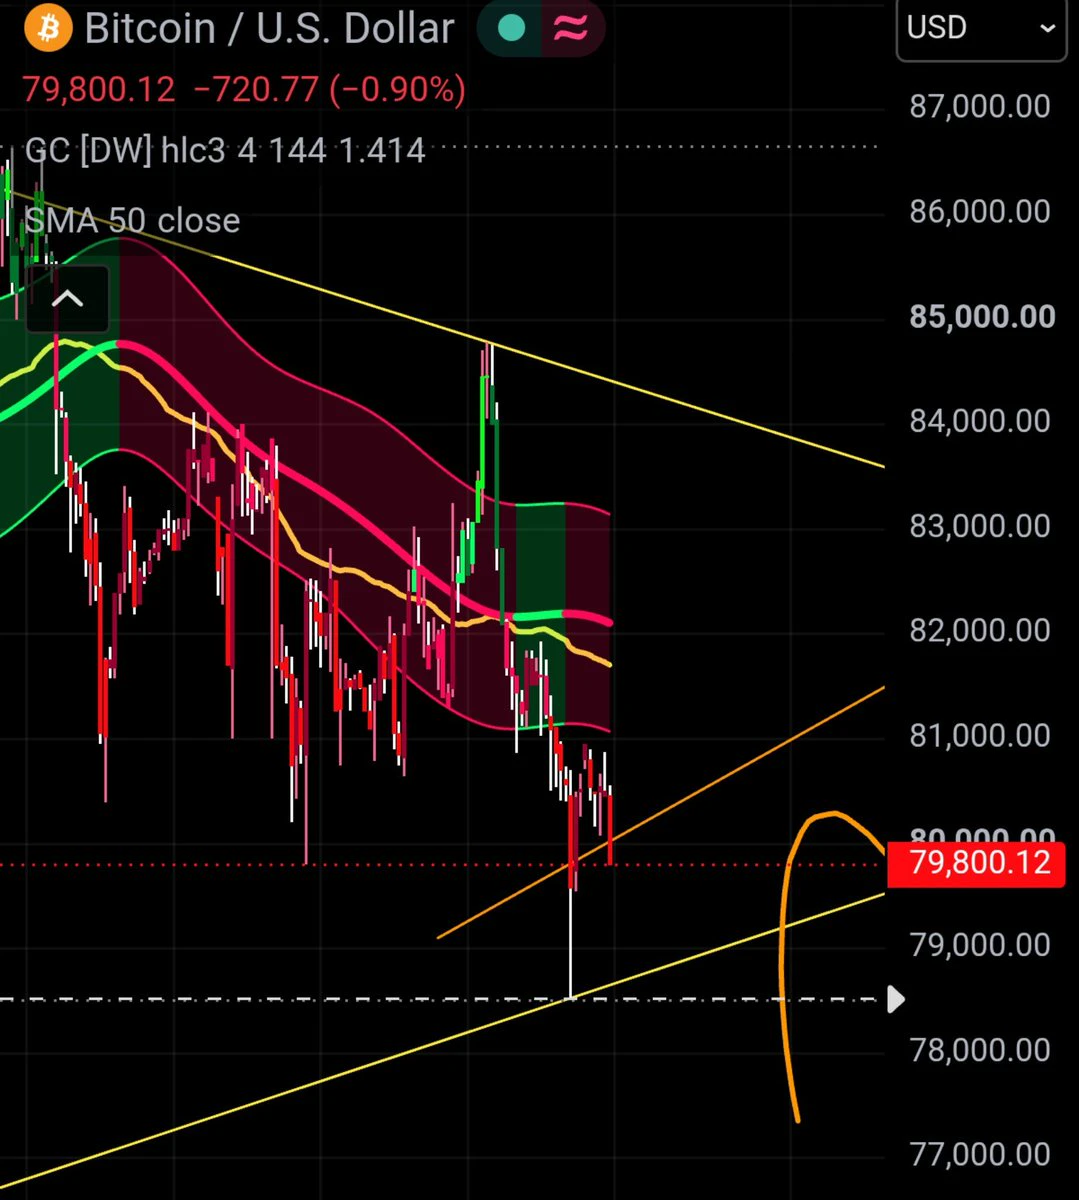
#Bitcoin Golden Cross loading.
You know what this means...
post-image
BTC+0.31%
Nothing says privacy like walking around with a phone with the Ledger logo on the back
post-image
$RENDER took decisive action, so the account performed better. This is a good reason to exit. Profits have been locked in. My daily watchlist: $BAT and $ETH .
post-image
RENDER+2.32%
BAT+26.74%
ETH+1.41%
SOL oscillated downward from the earlier high of 124.99, with the intraday low dipping to 100.51 before a slight rebound, reaching a high of 106.49. This rebound is merely a minor corrective bounce during the decline; the overall broader downtrend channel remains intact, and a rebound to resistance presents an opportunity to enter short.

From the chart, the daily highs have been gradually moving lower, and the bearish trend structure remains intact. This rebound is only a brief pause amid the decline. MACD remains weak and trending downward, while heavy pressure from previously trapped posit
post-image
SOL+1.48%
The more gold prices fall, the more aggressively China buys. From March to July, its purchases rose from 4.98 tons to 19.91 tons. This isn’t bottom-fishing; it’s welding a floor under gold prices. Ahead of the Fed decision, the market is already pricing in expectations. True liquidity providers only watch who is quietly absorbing the supply. Those holding gold should weigh this for themselves. If you have anything to add, see you in the comments.
post-image
GLDX+1.96%
PAXG+1.41%
Layout: Bitcoin, Ethereum, Dogecoin
live-cover
LIVE880
  • 4
BOUNDED FOR $10:
the $ICP wyckoff accumulation should be able to take the price to $10 just for short tem targets
post-image
ICP+2.10%
$AAOI
The correction continues. If the index hadn’t made a liquidity sweep, the other path would have remained valid. Today, it pulled back to the monthly EMA21-$74. On the other hand, it has also dipped as far as the support band during previous corrections. I normally use the support band as my reference for trends anyway.
I still think it’s forming a handle here. There’s no topping structure like the one at the 2017 peak
post-image
AAOI-2.87%
INDEX-1.54%
$MARSCOIN is currently in a high-volatility, weak-trend phase. Conclusion first: short-term bias is bearish; chasing longs is not recommended. If it rebounds to around 0.0782, a small short position may be cautiously attempted, but a hard stop-loss must be used.
The reasoning is as follows. MARSCOIN is currently at 0.0772, down 5.04% over 24h, with the amplitude over 30 candles reaching as high as 15.93%. Its volatility is significantly higher than BTC's 3.44%, making it a typical high-risk asset. In terms of moving averages, MA5=0.07824 remains above MA20=0.07621, so the apparent bullish ali
post-image
MARSCOIN-5.73%
BAT+26.74%
BTC+0.31%
Load More

Join 40 M users in our growing community

⚡️ Join 40 M users in the crypto craze discussion

💬 Engage with your favorite top creators

👍 See what interests you

Trending Topics

USSeptemberPPIBeatsExpectations

91.35k Views1.88k Discussing

US September PPI came in at 6.3% YoY, well above the 5.3% market expectation, pointing to renewed producer-side inflation pressure. Weekly jobless claims were 199K, broadly in line with forecasts. Could hotter inflation further reduce room for rate cuts, and what does it mean for $BTC, US stocks, and gold?

DrLinHanSpeaksAtOxfordUnion

135.63k Views1.86k Discussing

JapanAndKoreaStocksPlunge

47.27k Views1.76k Discussing

View More