
Share your thoughts
placeholder
Article
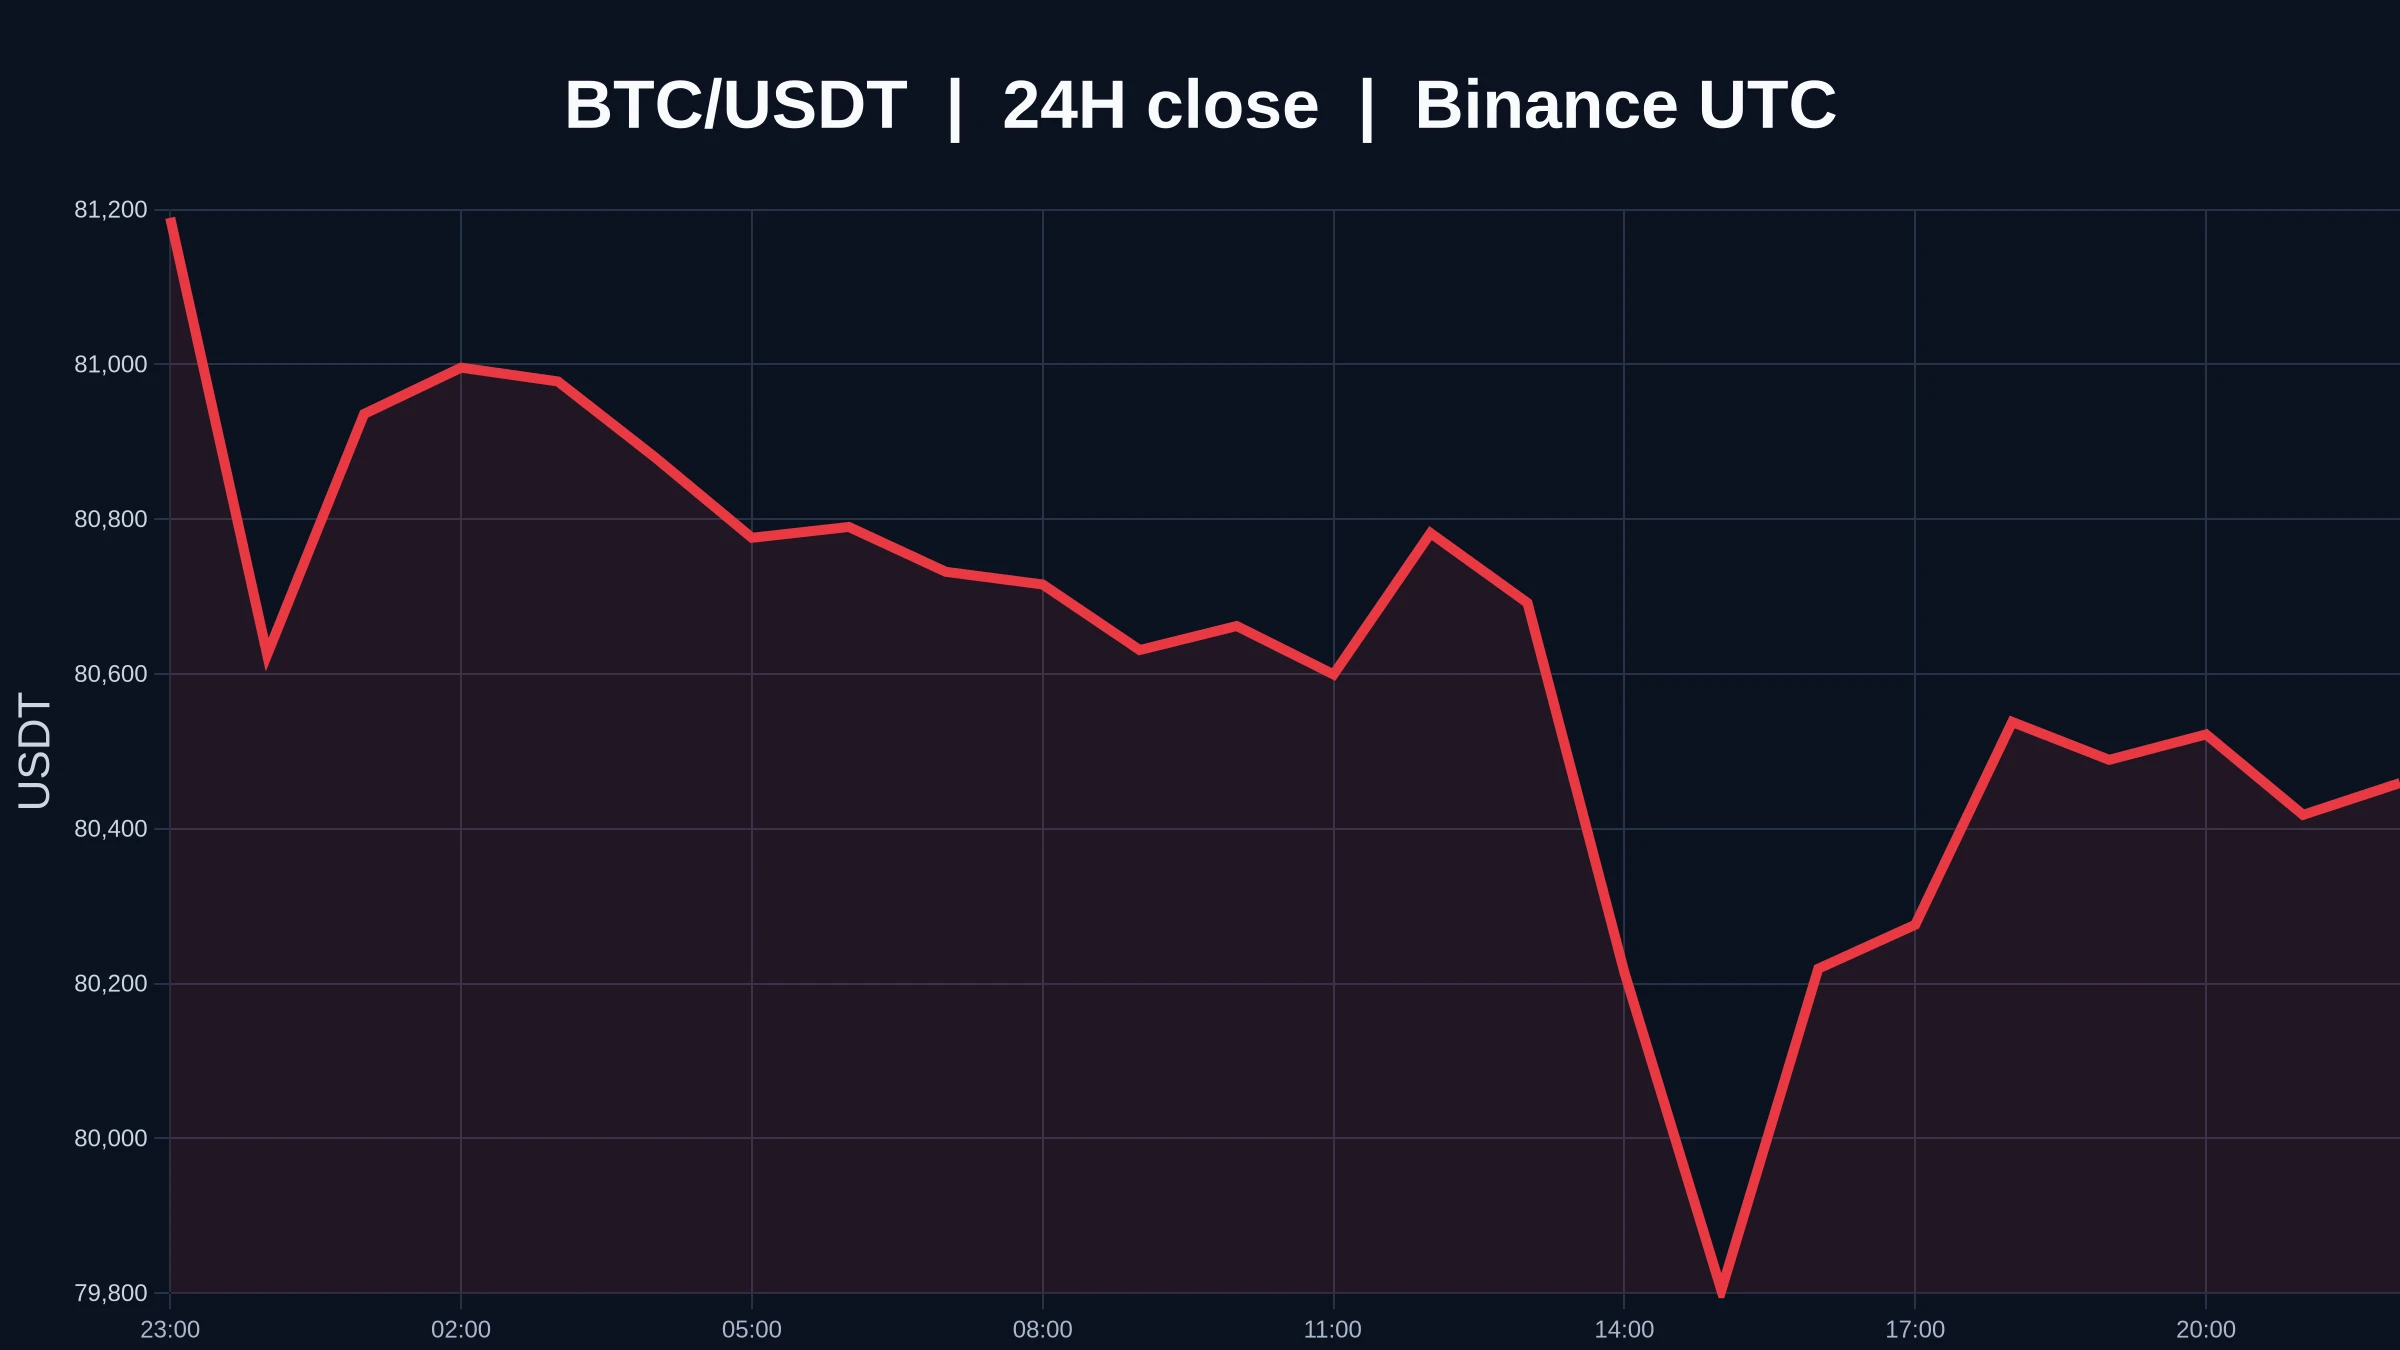
Overall market volatility was very low over the weekend, with the market still maintaining a weak structure.

The price has consistently failed to break above the 77300–77800 resistance zone, so in the short term, continue to look for a pullback around resistance.

On the hourly chart, after rising and then retreating on Friday, the market entered a narrow consolidation. The Bollinger Bands continue to contract, volatility is getting smaller, and the price has remained below the middle band.

Both bullish and bearish momentum are currently weak. There is no one-sided trend for now, and the
post-image
BTC+0.10%
I did nothing—just went to the restroom, and when I came back, the candlesticks had already done the work for me😅. $MU It climbed from 946.09 all the way to 967.36, and my account suddenly showed +159.63%. Honestly, I feel a little embarrassed making this money.

Looking back at the intraday plunge, everyone else was running while I watched the bids. The harder it was dumped, the more people stepped in to buy, and the pullback held the key level firmly. I didn't hesitate and bought the dip; looking back now, it was all a gift.

This profit feels great, but I'm not greedy. I took 80% in prof
post-image
MU-0.66%
ETH+0.55%
BNB+0.04%
Oracle is transforming from a “database company” into an AI infrastructure player
In the past, when Oracle was mentioned, many investors’ first reaction was still “database”; now, that label may be somewhat outdated. Q1 earnings showed that Oracle Cloud Infrastructure revenue grew 121% year over year to $7.4 billion, while total revenue increased 30% to $19.345 billion and adjusted EPS came in at $1.92, all above market expectations. The stock rose more than 7% at one point after hours, clearly showing that the market has begun reassessing Oracle through the lens of an AI infrastructure compan
ORCL-1.87%
  • 28
Rising Rate-Hike Expectations Could Instead Create the Next Buying Opportunity
The biggest market significance of this round of U.S. August CPI data is that it has brought “the Federal Reserve hiking rates again” from a low-probability event into the spotlight. Data showed that headline CPI rose 3.4% year on year and core CPI rose 2.4%, while the market’s probability of a September rate hike increased notably after the data was released.
In the short term, this is certainly not the scenario risk assets prefer. Higher interest rates raise funding costs, while a stronger dollar and higher U.S. T
BTC+0.06%
GLDX-0.03%
PAXG0.00%
  • 16
I was just about to curse it out, but then I looked at my account. Never mind—let it drop however it wants; I’ll shut up.

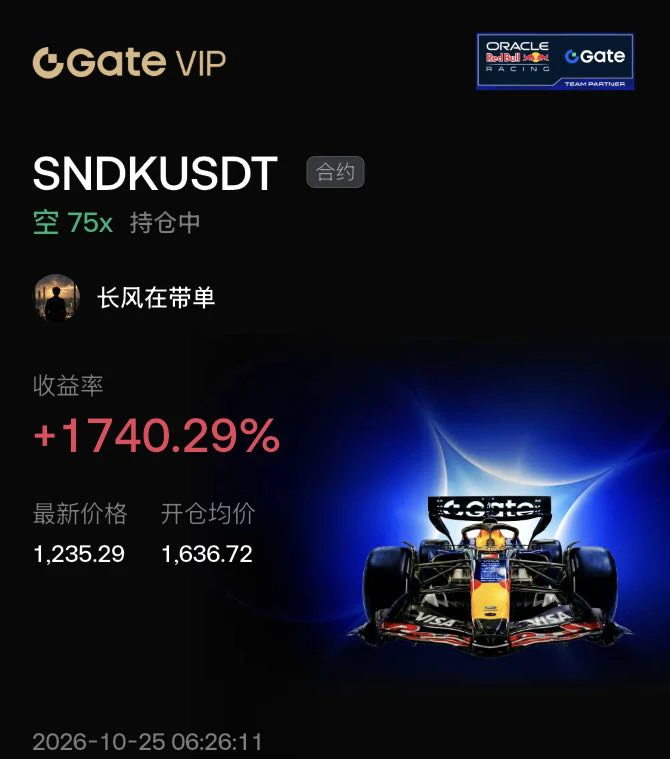
From 0.08529 to 0.06728, +415.77%—the wait was worth it. At the time, $LAB was weaker with each wave, buying support was clearly lacking, and the bull-trap vibes were strong. Seeing the bullish sentiment, I casually entered a short.

I’ve banked most of the profits first, closing 80%, and moved the stop loss on the remaining 20% to breakeven.

The market humbles everyone, especially those who think they’re the smartest. Don’t let profits inflate you, and don’t despair
post-image
LAB-11.62%
ADA+0.58%
SOL-0.58%
I’m watching $BNB for a short here.
BNB got rejected from the $741 area and the 1H chart has been printing lower highs since. The bounce around $724–$725 is holding for now, but price is still struggling to regain the $730 area, so sellers still look slightly stronger here.
Entry: $727.00–$729.00
Targets:
TP1: $724.50
TP2: $722.00
TP3: $718.50
Stop: $731.80
For me, $732 is the key level. As long as BNB stays below it, I’m looking for another move lower. A clean reclaim above $732 would invalidate the short idea.
#CoinDeskRevealsGateRWAPerpetualsTop3Globally #AugustCoreCPIBeatsExpectations
post-image
BNB+0.02%
  • 3
  • 1
Jia Nailiang and Li Xiaolu were pictured together as a family of three; perhaps everything from the past is truly in the past.
I watched a video in which Jia Nailiang explained how he livestreams—he is truly wise and hardworking.
As for Li Xiaolu, nothing more needs to be said; as Fan Wei’s Achilles’ heel, she is very beautiful.
post-image
Everyone is about to find out the daily trend is brutally bearish.

$H /USDT - SHORT

Trade Plan:
Entry: 0.0798 – 0.0808
SL: 0.0851
TP1: 0.0767
TP2: 0.0743
TP3: 0.0707

Why this setup?
Why now? The daily trend is bearish and the 1h price sits at 0.0803, right inside the entry zone of 0.0798 to 0.0808, giving us a clean short setup. The 15m RSI is 33.73, confirming exhaustion without yet touching oversold, so momentum is weak but not capitulated. The 1h ATR of 0.001999 shows the average hourly move, meaning our targets are realistically spaced rather than aspirational. We aim for TP1 at 0.07
H-3.96%
Layout for Bitcoin, Ethereum, and Dogecoin
live-cover
LIVE2,245
  • 1
#每周来晒 In crypto, why do people say, “It’s better to chase the highs than to casually buy the dip”

For educational purposes based on experience only; this does not constitute investment advice!

There is a stop-loss when you chase the highs incorrectly; when you buy the dip incorrectly, there is no bottom. Many retail investors suffer huge losses precisely because of “buying the dip.”

I. Several fatal problems with buying the dip

1. The bottom is formed, not guessed
What you think is the bottom is often merely a midpoint in the decline. There is no floor price in crypto; beneath the floo
post-image
$XRP is stuck at $1.36, and traders are waiting for its next move.
The CLARITY Act remains a major catalyst, and White House Executive Director Patrick Witt says today is a "bad day to be a CLARITY Act doomer."
At the same time, 2 new XRP ETF products have been pushed to October 11.
For now, XRP ETF flows have gone quiet, with zero net inflows on September 11.
On the chart, the story is simple: $1.40 is the wall. $1.30 is the floor.
Break $1.40, and XRP could run toward $1.50–$1.60.
Lose $1.30, and $1.20 comes back into view.
post-image
XRP+0.75%
#𝐆𝐚𝐭𝐞𝐌𝐞𝐦𝐞 let’s see. #ZCO
visit and join! Small actions, bigger future.#Gate8月透明度报告
The stop-loss I nervously canceled a few days ago—looking at it today, it feels like it saved me.
During the intraday bottoming process, $EDEN just stayed flat and unmoving. The bottom grew increasingly stable, grinding around 0.04609 without breaking down. I said at the time: if it doesn't break, hold it and go long.
Panic comes from having no plan; losses come from overthinking.
Don't let profits inflate, and don't despair over drawdowns.
Now at 0.04936, with +143.21% securely in hand—it was worth holding on. Take 80% off the table first, and move the stop-loss on the remaining 20% to the e
post-image
EDEN-1.69%
ZEC-3.20%
SOL-0.58%
$PEPE On The Move! 🚀
post-image
PEPE+3.69%
#AIStockGuruReportedlyBullishOnAI AI Stock Guru Reportedly Bullish on AI: Is the AI Rally Ready for Another Move?
Artificial intelligence continues to be one of the strongest narratives across global financial markets. As AI-related companies attract growing investor attention, a reportedly bullish view from AI Stock Guru has added another layer of interest to the sector.
The key question now is whether continued optimism around artificial intelligence can translate into another major move for AI-related stocks.
🤖 Why Is AI Still in Focus?
AI is no longer viewed simply as a technology trend.
post-image
  • 5
🔥 Gate × CNPY double benefits are here! Share 851,200 CNPY for free
Want a free airdrop and want to test Bitcoin’s price trend? Get both at once!
1️⃣ CandyDrop tasks: Complete simple tasks to directly share the 851,200 CNPY prize pool! 👉 Join now:
2️⃣ BTC price prediction: Post your prediction for the BTC price at 9/18 20:00 (UTC+8). The top 200 most accurate predictions will receive extra rewards! 🎯 My predicted price: $78,910
Come play together in the Gate event market! Which number are you bullish on? Tell me in the comments below 👇
#Gateio #CNPY #CandyDrop #BTC #Crypto
post-image
CNPY-4.89%
BTC+0.06%
$ETH Signal】4H structure intact, 1H squeeze awaiting a move, buy on pullback
$ETH Around 2522, the 1H Bollinger Bands narrowed to 2507-2544, compressing the range to an extreme. The 4H MACD histogram contracted at a positive value of 4.20, with bullish momentum weakening at elevated levels. The 1H RSI at 49.90 is stuck in the neutral zone, while EMA20 at 2524.51 is pressing horizontally on the current price, limiting the rebound strength.
Order book depth imbalance: -21.23%, bid/ask ratio: 0.65, with dense sell orders above. The funding rate is 0.0028%, OI is stable, and neither side is showi
post-image
ETH+0.55%
BTC+0.06%
SOL-0.62%
XRP is secretly rolling toward a range breakdown nobody sees coming.

$XRP /USDT - SHORT

Trade Plan:
Entry: 1.3604 – 1.3640
SL: 1.3792
TP1: 1.3495
TP2: 1.3410
TP3: 1.3283

Why this setup?
Why now? The 1h price sits at 1.3622 inside a narrow entry zone between 1.3604 and 1.3640, giving a clean trigger for the SHORT bias. The 15m RSI at 37.94 confirms sellers are still in control without being oversold. The 1h ATR of 0.007071 shows enough volatility to push XRP toward TP1 at 1.3495 and then TP2 at 1.3410. The daily trend is range, which often compresses before a directional move, and the inv
XRP+0.79%
Financial News, Crypto Market Updates, and Real Trading Strategies
live-cover
LIVE59
I was just about to go to the forum and start cursing, but then I saw my balance. Forget it—the market is always right.
When the whole screen was glowing green, $SOL clearly lacked enough buying support at the highs. The rebound was nothing but a bull trap—I nearly slapped the words “resistance above” right in everyone’s face. Friends who followed me into the short at 103.42 should all be waking up laughing from this move.
It’s now quoted at 101.74, with +151.9% already safely in the bag. Take 80% off the table first, move the stop-loss on the remaining 20% to around the entry price, and let
post-image
SOL-0.58%
ETH+0.55%
BTC+0.10%
Load More

Join 40 M users in our growing community

⚡️ Join 40 M users in the crypto craze discussion

💬 Engage with your favorite top creators

👍 See what interests you