Square
Following
Hot
News
Profile

VayneBoy

vip
Active for: 0.9y
Peak Tier 5
No content yet
12
Following
1.3k
Followers
16.4k
Liked
Bitcoin Buy the Dip or Wait? 🤔
live-cover
LIVE43
#WCTCS9 #BTC Bitcoin falls again—is the short-term rally over?
Looking at Bitcoin’s performance over the past few years, the market still appears to offer plenty of opportunities. Some analysts even believe Bitcoin could break through its all-time high again in 2027 and reach a new cycle peak in 2028.
But looking at the present, the market is clearly not so optimistic. Bitcoin has experienced a significant pullback, while bearish bets in the options market are concentrated around $80k.
Judging from historical cycles, Bitcoin could indeed continue to rebound. Well-known overseas analyst Root co
ThisIsTranslateContent:
#WCTCS9 #BTC Bitcoin falls again—is the short-term rally over?
Looking at Bitcoin’s performance over the past few years, the market still appears to offer plenty of opportunities. Some analysts even believe Bitcoin could break through its all-time high again in 2027 and reach a new cycle peak in 2028.
But looking at the present, the market is clearly not so optimistic. Bitcoin has experienced a significant pullback, while bearish bets in the options market are concentrated around $80k.
Judging from historical cycles, Bitcoin could indeed continue to rebound. Well-known overseas analyst Root compared the market cycles of 2015, 2018, and 2022 and found that after bottoming, Bitcoin regained its all-time high within roughly a year.
Following this pattern, if the current market follows a similar recovery trajectory, Bitcoin could set a new all-time high before mid-2027.
The relatively small decline in this market cycle is also why analysts remain optimistic. Based on the low near $60k, Bitcoin’s maximum decline was about 52%, below the roughly 77% to 85% declines seen in the previous three bear-market cycles.
If this adjustment has already released some of the market risk, Bitcoin may also need a smaller rebound than in previous cycles.
However, forecasts can only serve as a reference. Historical trends can help us understand the market, but they cannot guarantee that future market movements will repeat the past.
Especially after spot ETFs and institutional funds gradually changed Bitcoin’s market structure, whether the previous four-year cycle can continue remains controversial.
Recent options data shows that the market remains cautious about the short-term outlook.
Among the Bitcoin options expiring this Friday on Deribit, approximately $451 million in notional value of put options is concentrated in the $76k-$80k strike-price range, while open interest in puts is also higher than that in calls.
This indicates that investors are still guarding against the risk of Bitcoin falling further, but market pricing for sharp short-term volatility has declined.
The $76k-$80k range remains a price zone worth watching. If selling pressure increases again, these levels could be tested once more.
In addition, the macro environment cannot be ignored. According to an analysis published by MarketWatch yesterday, the market expects U.S. headline CPI growth in September to rise year over year from 3.4% in August to about 3.7%.
If inflation comes in above expectations, the Federal Reserve may reconsider raising interest rates, putting pressure on risk assets such as Bitcoin.
This is why, even though Bitcoin’s long-term trajectory still has room to run, its short-term performance may not be smooth. Interest-rate expectations, the dollar’s trajectory, and market liquidity could all affect investors’ risk appetite.
Conversely, there is no need to become excessively pessimistic simply because the market has pulled back. A price decline by itself does not mean the long-term trend has ended. After leveraged positions are liquidated and market sentiment cools, valuations may return to reasonable levels.
The key is not to use long-term logic as the basis for short-term trading. Even if BTC really breaks through its all-time high in 2027, that does not mean it cannot continue falling in the short term.
The crypto market today is neither as good nor as bad as imagined.
Likewise, looking at market cycles, opportunities usually emerge from declines rather than rises, while more risk accumulates on the way up.

repost-content-media
BTC+0.54%
  • 3
#韩股大跌你会抄底吗 #每周来晒 Godlike in the rally, burying investors in the selloff: A complete review of the Korean stock market’s wild ride
Among the world’s major markets this year, South Korea’s stock market has been the most dramatic: In June, the KOSPI index surged to an all-time high of 9,385 points; just four months later, the index fell below 6,500 points, with a maximum drawdown of over 30%. It fell 33% in July alone, the worst monthly performance on record—worse than any single month during either the 1997 Asian financial crisis or the 2008 global financial crisis. The prevailing market explana
ThisIsTranslateContent:
#韩股大跌你会抄底吗 #每周来晒 Godlike in the rally, burying investors in the selloff: A complete review of the Korean stock market’s wild ride
Among the world’s major markets this year, South Korea’s stock market has been the most dramatic: In June, the KOSPI index surged to an all-time high of 9,385 points; just four months later, the index fell below 6,500 points, with a maximum drawdown of over 30%. It fell 33% in July alone, the worst monthly performance on record—worse than any single month during either the 1997 Asian financial crisis or the 2008 global financial crisis. The prevailing market explanation is that the “AI rally is fading.” But stopping there would underestimate the nature of this crash. This article attempts to break down the complete logic behind the Korean stock market’s wild ride from four angles: pricing power, the industrial cycle, the geopolitical landscape, and capital structure.
I. It did not lose valuation—it lost “pricing power”
The narrative behind this round of soaring Korean stocks was extremely simple: AI requires massive amounts of memory, while Samsung Electronics and SK hynix are the undisputed global leaders in memory chips. As a result, capital priced the Korean stock market as an “AI core asset.”
The problem is that profit distribution across the AI industry chain is a highly asymmetric pyramid: companies controlling chip design and ecosystems take most of the gross profit; cloud providers obtain stable cash flow through subscriptions and services; and although memory manufacturers have achieved record profit margins, they are still essentially in the business of “selling shovels”—the price of the shovel is determined by downstream demand, not by the seller. More importantly, the “switch” controlling the narrative is not in Seoul’s hands. When US AI-sector earnings fall short of expectations and sentiment toward technology stocks cools, global capital’s first reaction is to exit high-beta assets, and Korean stocks happen to be among the most sensitive instruments in this round of AI trading. When others tell the story and others hold the switch, such assets are naturally among the strongest gainers in a rally and the hardest hit in a selloff.
II. The expansion wave is approaching the top of the cycle
Memory is the most typical cyclical sector in the semiconductor industry, and the script has remained unchanged for decades: prices rise → manufacturers reap windfall profits → collective expansion → oversupply → price collapse → capacity exits → the next upswing. This script played out in full in both 2018 and 2022. What makes this round unusual is the scale of the expansion. According to public reports, the United States has publicly pressured Samsung and SK hynix several times in recent months to increase memory capacity and build plants in the US; the two leaders’ capital expenditure plans for the coming years are unprecedented in scale, while US manufacturers are also significantly increasing investment, compounded by capacity expansion among Chinese manufacturers—the memory industry is entering a rare wave of global expansion, all taking place at the moment of peak profitability.
Anyone with even modest experience in cyclical stocks understands what this means: today’s windfall profits are sowing tomorrow’s oversupply. Smart money in the capital markets is choosing to leave early, essentially pricing in advance the supply-demand landscape expected around 2027. This is more alarming than any single day’s negative news.
III. The Chinese market: squeezed by both import substitution and export restrictions
China once accounted for 30–40% of global memory-market demand and was one of the most important sources of profit for Samsung and SK hynix. This core market is undergoing structural change under pressure from two forces. First is the acceleration of import substitution. After domestic memory leaders completed their IPO fundraising, they entered an expansion phase; mainstream products such as DDR5 are already being mass-produced and shipped, while China’s memory industry chain continues to make broad breakthroughs. The previous expectation that “high-end memory would remain in long-term shortage and Korean manufacturers would dominate the entire market” is being revised by reality. Second is the tightening of export restrictions. Due to the impact of US export controls, Korean manufacturers’ operating flexibility at their plants in China has declined considerably; supplies of some advanced products to China are restricted, and around 30% of the two companies’ capacity in China faces adjustment pressure. As one side retreats and the other advances, the market space surrendered by Korean manufacturers is being rapidly taken over by domestic memory producers. It must be emphasized that this is structural pressure on market share, not a one-off cyclical fluctuation—the cycle will return, but market share may not.
IV. The result: After sentiment ebbed, retail investors were left holding the bill
South Korea has not been inactive over the past two years. From the slogan of “enhancing corporate value” to adjustments to short-selling policies, regulators and policymakers have supported the rally all the way, pushing the index to a record high. But when it came to actual cash dividends, buybacks, and corporate-governance reforms, progress remained limited. The result of capital voting with its feet was that foreign investors recorded substantial net outflows for the year, reaching a record level; foreign ownership of Samsung Electronics fell to its lowest level since the 2008 global financial crisis; and those who rushed in with leverage were primarily local South Korean retail investors—according to Korean media statistics, margin debt in the market at one point approached a historic high of 38 trillion won, while leveraged ETFs further concentrated and weakened the risk exposure. What followed was a textbook stampede: share prices fell → brokers issued margin calls → forced liquidations → share prices fell further → more liquidations. According to Korean media reports, around one million accounts received margin-call notices at the peak, and a large number of accounts were liquidated outright. The bubble jointly inflated by policy and sentiment ultimately burst in the hands of those who believed in it most.
repost-content-media
  • 5
#WillYouBuyDipInKoreanStocks South Korean Stocks Are Falling — Is This a Buying Opportunity or a Warning Sign?
The recent decline in South Korean stocks, particularly Samsung Electronics and SK Hynix, has raised an important question for investors: Is this a temporary market correction, or could prices fall further before a recovery begins?
Samsung Electronics and SK Hynix are major players in the semiconductor industry. Their performance is closely connected to memory-chip demand, artificial intelligence development, global technology trends, and investor expectations.
If the market recovers,
BlackoutCryptoBoy
#WillYouBuyDipInKoreanStocks South Korean Stocks Are Falling — Is This a Buying Opportunity or a Warning Sign?
The recent decline in South Korean stocks, particularly Samsung Electronics and SK Hynix, has raised an important question for investors: Is this a temporary market correction, or could prices fall further before a recovery begins?
Samsung Electronics and SK Hynix are major players in the semiconductor industry. Their performance is closely connected to memory-chip demand, artificial intelligence development, global technology trends, and investor expectations.
If the market recovers, investors who buy at lower prices could potentially benefit. However, buying during a sharp decline also carries risks, as falling prices do not guarantee an immediate rebound.
My strategy would be to avoid rushing into the market. I would first examine company fundamentals, earnings expectations, semiconductor demand, and overall market sentiment. If the fundamentals remain strong, I would consider gradual buying rather than investing all my money at once.
For me, patience and risk management are more important than trying to predict the exact market bottom.
What would you do?
Would you buy the dip in South Korean stocks, wait for confirmation of a recovery, or stay on the sidelines until the market becomes more stable?
Share your thoughts and let's discuss the next move in the Korean stock market.
#每周来晒 #韩股大跌你会抄底吗
repost-content-media
  • 4
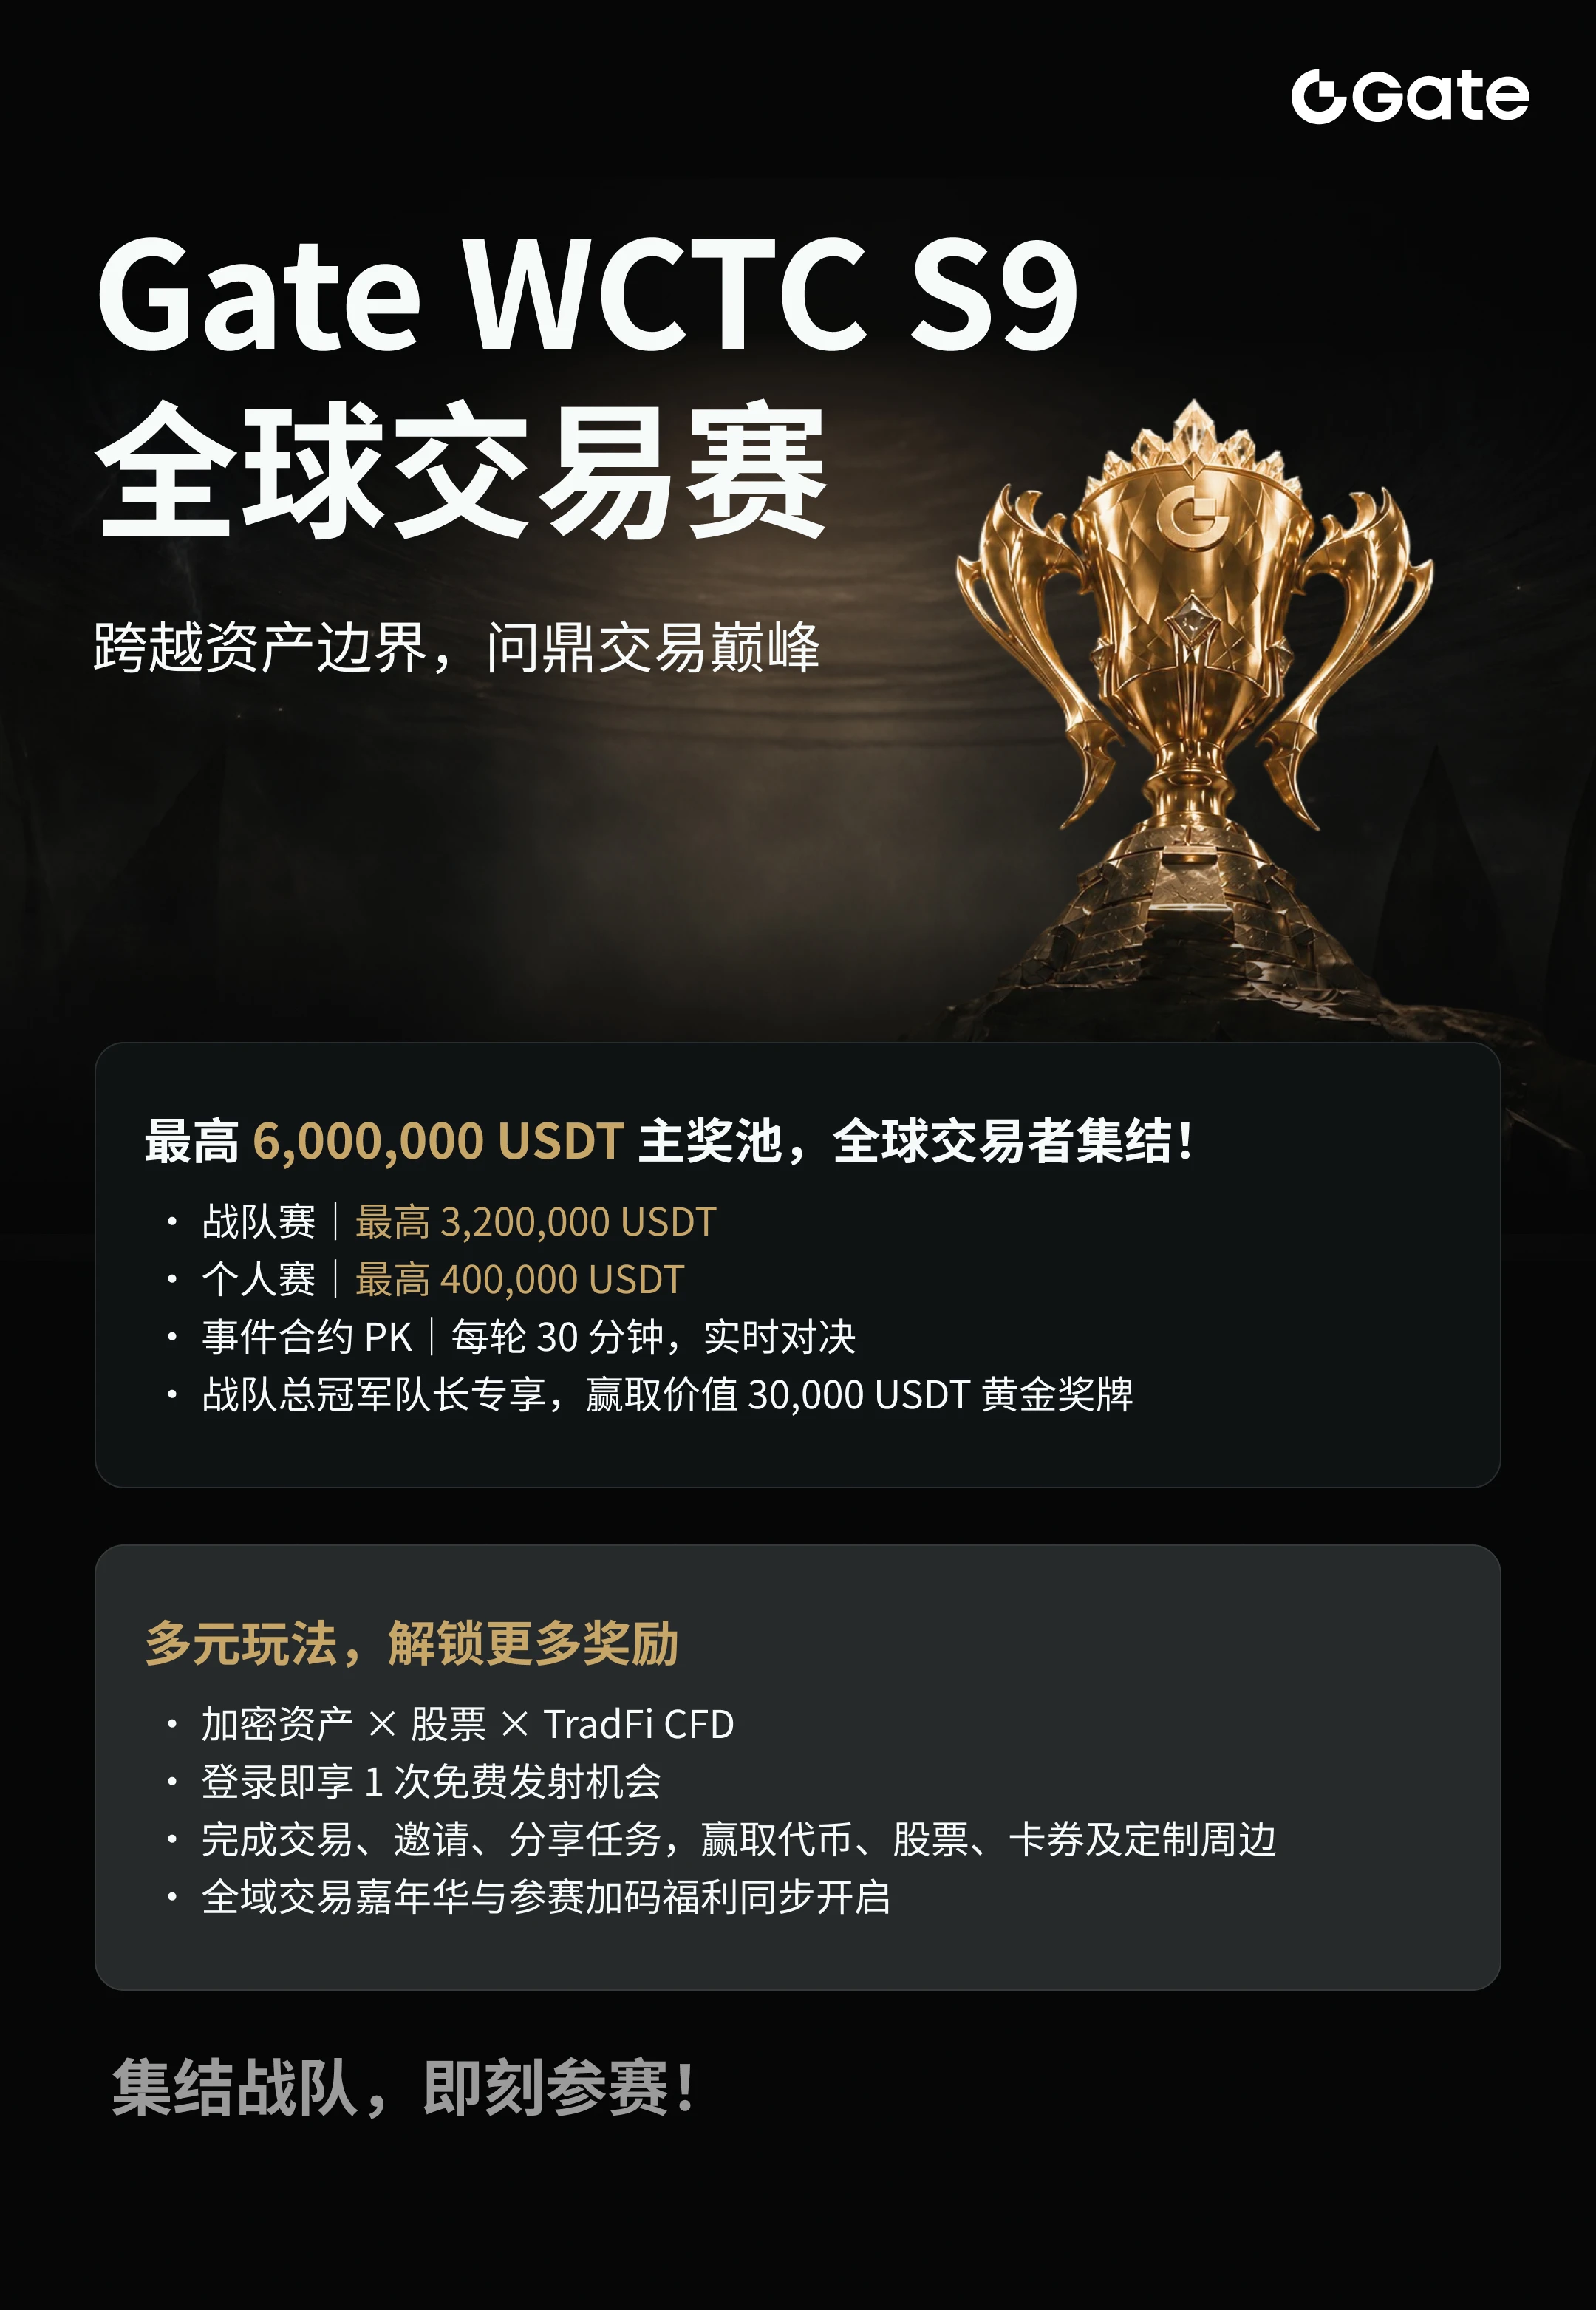
#GateWCTCS9GlobalTradingCompetition #WCTCS9: Gate’s Global Trading Competition Returns With a Massive 6 Million USDT Prize Pool
The global trading arena is heating up as WCTC Season 9 officially goes live on Gate, bringing traders worldwide together for one of the platform’s major trading competitions. With a total advertised prize pool of 6,000,000 USDT, this season offers opportunities for individual traders, competitive teams, and participants who want to test their trading strategies in a challenging global environment.
However, WCTC S9 is about more than individual performance. Teamwork,
BlackoutCryptoBoy
#GateWCTCS9GlobalTradingCompetition #WCTCS9: Gate’s Global Trading Competition Returns With a Massive 6 Million USDT Prize Pool
The global trading arena is heating up as WCTC Season 9 officially goes live on Gate, bringing traders worldwide together for one of the platform’s major trading competitions. With a total advertised prize pool of 6,000,000 USDT, this season offers opportunities for individual traders, competitive teams, and participants who want to test their trading strategies in a challenging global environment.
However, WCTC S9 is about more than individual performance. Teamwork, strategic planning, risk management, and consistency can all play an important role in the competition. Whether you prefer competing independently or working with experienced traders, this event introduces multiple competition formats designed to attract different types of participants.
UNDERSTANDING THE WCTC S9 COMPETITION
1. Team Competition: Up to 3,200,000 USDT
The team competition is one of the major highlights of WCTC S9. Participants can form teams, recruit members, develop strategies, and compete against other teams for leaderboard positions.
This format creates opportunities for traders to collaborate, exchange ideas, and learn from different approaches to the market. Team captains can recruit members through Gate Square, while traders looking for a team can connect with other participants and discuss their competition plans.
The advertised prize allocation for this category reaches up to 3,200,000 USDT. Actual rewards depend on the official competition rules, eligibility requirements, and ranking conditions.
2. Individual Competition: Up to 400,000 USDT
Traders who prefer to compete independently can participate in the individual competition. This category focuses on personal trading performance and gives eligible participants an opportunity to compete for leaderboard rankings.
It can be an opportunity to evaluate your strategy, improve your decision-making, and challenge yourself against traders from around the world. However, reaching a high ranking is not guaranteed, and market volatility can make trading results unpredictable.
The advertised prize allocation for the individual competition reaches up to 400,000 USDT.
3. Event Contract PK: 30-Minute Trading Showdowns
Another featured format is Event Contract PK, which offers real-time showdowns with rounds lasting 30 minutes.
This format is designed for participants interested in short-duration competitive events. It requires attention, discipline, and an understanding of the relevant product rules. Shorter rounds can also involve rapid price movements and significant risk, so participants should understand the product before joining.
WHY SHOULD TRADERS PAY ATTENTION TO WCTC S9?
The biggest attraction is the advertised 6 million USDT total prize pool, but the competition also offers other potential benefits.
First, participants can challenge themselves in a global trading environment and evaluate their strategies under competitive conditions.
Second, the team format encourages collaboration, allowing traders to connect with potential teammates and share market perspectives.
Third, Gate Square provides a space for participants to discuss strategies, share competition experiences, publish recruitment notices, and engage with the trading community.
In addition, the WCTC S9 promotional announcement highlights a separate 50,000 USDT prize pool for exclusive Gate Square activities, along with opportunities for GT gifts, merchandise rewards, and traffic support.
These Square-related benefits are subject to their respective event rules, eligibility requirements, and selection conditions. Simply publishing a post or joining the competition does not guarantee a reward.
HOW LONG WILL THE EVENT LAST?
WCTC Season 9 is currently live, according to the official announcement. However, the announcement provided here does not specify the competition's closing date.
Before registering, participants should check the official competition page for the complete schedule, registration deadlines, competition periods, reward distribution arrangements, and any applicable eligibility requirements.
Do not rely on assumptions about the ending date. Checking the official rules will help you understand exactly when to register and how long you have to participate.
IMPORTANT RISKS EVERY PARTICIPANT SHOULD UNDERSTAND
A large prize pool can attract attention, but trading competitions are not risk-free.
Market prices can move rapidly, and leveraged trading can amplify losses. Participation does not guarantee profits, a leaderboard position, or any particular reward.
Before entering, understand the competition rules, eligible trading products, scoring system, fee structure, and risk requirements. Never trade money you cannot afford to lose simply to improve your ranking.
A disciplined strategy and responsible risk management are more important than chasing rewards without a plan.
TEAM RECRUITMENT IS NOW OPEN
Are you planning to lead a team, or are you looking for experienced teammates to compete alongside you?
Gate Square offers an opportunity to connect with other participants, announce your recruitment plans, share your competition goals, and discuss strategies with the community.
If you are recruiting, explain your team's objectives clearly. If you are looking to join a team, review its expectations and communicate with its members before making a decision.
WCTC S9 brings together competition, community participation, and opportunities to test your trading approach on a global stage. The real challenge is not simply entering the competition; it is understanding the rules, managing risk, and making informed decisions throughout the event.
FINAL THOUGHTS
WCTC Season 9 is an important event for traders who want to explore Gate's global trading competition and participate in its associated Square activities. With a 6 million USDT advertised total prize pool, team and individual competition formats, 30-minute Event Contract PK rounds, and additional community reward opportunities, there are several aspects worth exploring.
Read the official rules, confirm the event schedule, understand the risks, and decide whether the competition fits your trading experience and goals.
The leaderboard is waiting, but preparation, discipline, and responsible decision-making should always come first.
Official Competition Registration:
https://www.gate.com/competition/wctc-s9
Join the Gate Square Community and Share Your Post:
https://www.gate.com/post
#WCTCS9 #GateWCTCS9全球交易赛
repost-content-media
GT-1.92%
  • 5
🔹XRP Ledger Moves to Clarify Security Concerns! Not a Single New
live-replay-cover
470 views10-12 15:30
01:01:16
🔹 Robinhoods on-chain activity cools down: Daily active users do
live-replay-cover
1,233 views10-11 16:41
07:58:43
🔹 Robinhoods on-chain activity cools down: Daily active users do
live-replay-cover
99 views10-11 15:49
00:14:48
🔹U.S. Stocks Are Rallying Again! Oracle and CRCL both jump over
live-replay-cover
512 views10-10 18:06
02:54:25
#GateMoneyOfficiallyLaunches 🥮 Gate.io Mid-Autumn Festival Red Packet Rain & Gate Money Official Launch! 🎁
Gate.io is bringing an extraordinary celebration to our global community! To mark the Mid-Autumn Festival, the Red Packet Rain campaign is now officially LIVE, offering all verified users a prime opportunity to claim exciting rewards with zero trading required. Coupled with the official rollout of Gate Money, digital asset management and daily Web3 financial utility are reaching a brand-new milestone.
🌟 Reward Pool Highlights
By simply participating during the campaign windows, users s
BlackoutCryptoBoy
#GateMoneyOfficiallyLaunches ​🥮 Gate.io Mid-Autumn Festival Red Packet Rain & Gate Money Official Launch! 🎁
​Gate.io is bringing an extraordinary celebration to our global community! To mark the Mid-Autumn Festival, the Red Packet Rain campaign is now officially LIVE, offering all verified users a prime opportunity to claim exciting rewards with zero trading required. Coupled with the official rollout of Gate Money, digital asset management and daily Web3 financial utility are reaching a brand-new milestone.
​🌟 Reward Pool Highlights
​By simply participating during the campaign windows, users stand a chance to unlock a diverse selection of benefits directly deposited into their Gate.io accounts:
​🪙 Random Crypto Tokens – Direct token distributions to boost your spot portfolio.
​📈 Contract Position Trial Vouchers – Test futures trading strategies with zero personal capital risk.
​🎯 Prediction Market Trial Vouchers – Forecast market trends and engage with high-yield product features.
​💸 Trading Fee Cashback Vouchers – Significantly reduce trading friction and platform fees on upcoming transactions.
​📜 Fractional Shares of Popular Stocks – Expand your financial horizons by acquiring fractional exposure to global equities.
​🛠️ Step-by-Step Participation Guide
​Complete Event Registration: Head over to the official campaign page on the Gate.io app or desktop portal and hit the registration button.
​Identity Verification (KYC): Ensure your Gate.io account is fully verified to meet compliance and eligibility criteria.
​Claim Your Red Packet: Enter the event page during the active time slots and tap the Red Packet Pop-up on your screen to unpack your surprise reward!
​⏰ Today's Official Claim Windows (UTC+8)
​Slot 1: 12:00 – 15:00 (UTC+8)
​Slot 2: 20:00 – 23:00 (UTC+8)
​⚠️ Key Rules & Eligibility:
​First Come, First Served: Rewards are limited per session. Log in right as the timer starts to maximize your chance!
​Participation Cap: Each eligible user can participate a maximum of 3 times throughout the event duration.
​Single Claim Rule: Users who have successfully claimed during a specific round cannot re-claim in that same session.
​🚀 Why Trade & Earn on Gate.io?
​Gate.io remains a premier choice for crypto traders globally, providing top-tier security, deep market liquidity, and groundbreaking financial products:
​100% Proof of Reserves (PoR): Gate.io consistently maintains verifiable, user-auditable 100% reserves to ensure complete asset safety.
​Gate Money Ecosystem: Designed to bridge daily financial solutions with seamless Web3 asset transfers and global digital payments.
​Comprehensive Market Access: Over 1,700 listed tokens, institutional-grade futures, startup launchpads, and integrated DeFi solutions—all inside one ecosystem.
​👉 Claim your Mid-Autumn good luck now:
https://www.gate.com/campaigns/mid-autumn-2026
​#Gate #Gate月满交易节 #MidAutumnRedPacketRain #GateMoneyOfficiallyLaunches
repost-content-media
  • 3
#CFTCProposesNew���CryptoAssetMarket”Category CFTC Proposes "Crypto Asset Market" (CAM) Category: A Historic Shift in U.S. Regulation 🇺🇸⚡
The global crypto landscape has reached a defining inflection point! The U.S. Commodity Futures Trading Commission (CFTC) has officially initiated a landmark regulatory proposal introducing the "Crypto Asset Market" (CAM) category.
This framework represents a structural evolution away from outdated, restrictive models and toward clear, fit-for-purpose national rules for digital asset spot, leverage, and derivative transactions. By establishing federal sta
BlackoutCryptoBoy
#CFTCProposesNew���CryptoAssetMarket”Category CFTC Proposes "Crypto Asset Market" (CAM) Category: A Historic Shift in U.S. Regulation 🇺🇸⚡
The global crypto landscape has reached a defining inflection point! The U.S. Commodity Futures Trading Commission (CFTC) has officially initiated a landmark regulatory proposal introducing the "Crypto Asset Market" (CAM) category.
This framework represents a structural evolution away from outdated, restrictive models and toward clear, fit-for-purpose national rules for digital asset spot, leverage, and derivative transactions. By establishing federal standards—including mandatory Proof-of-Reserves (PoR) requirements and rigorous token listing rules—the CFTC aims to cement digital assets into the mainstream financial architecture while driving institutional clarity.
🔍 How Key Assets Stand to Benefit Under Clear CFTC Oversight
Regulatory clarity provides a solid foundation for fundamental utility assets to expand globally:
1️⃣ Bitcoin ($BTC ) – The Sovereign Digital Commodity
As the undisputed gold standard of crypto commodities, $BTC stands as the primary beneficiary of a unified CFTC framework. Clearer institutional channels mean deeper liquidity, streamlined derivatives trading, and accelerated treasury adoption globally.
2️⃣ XRP ($XRP ) – Institutional Cross-Border Settlement
Institutional liquidity thrives on regulatory certainty. Under a standardized CFTC framework, $XRP's core value proposition—near-instantaneous, low-cost cross-border payments for banking networks—gains immense structural tailwinds.
3️⃣ Stellar ($XLM ) – Enterprise Asset Tokenization & Payments
Focused on real-world financial inclusion and cross-asset transfers, $XLM benefits significantly from defined federal compliance rules, paving the way for institutional stablecoin issuance and tokenized real-world assets (RWA).
4️⃣ Tezos ($XTZ ) – On-Chain Governance & Institutional Smart Contracts
Known for its self-amending blockchain architecture and formal verification security, $XTZ is built for enterprise-grade smart contracts. Regulatory clarity opens doors for formal institutional DeFi deployment on Tezos.
🚀 Why Gate.io is Built for the Regulatory Evolution
As regulatory standards tighten worldwide, Gate.io remains steps ahead in compliance, transparency, and liquidity:
🔐 Pioneering 100% Proof of Reserves (PoR):
Long before regulatory mandates like the CFTC’s CAM proposal highlighted PoR, Gate.io implemented audited, zero-knowledge cryptographic Proof of Reserves, guaranteeing 1:1 backing for all user assets.
💧 Deep Liquidity Across Core Markets:
Trade $BTC,$XRP, $XLM,$XTZ, and over 1,700+ crypto assets on Gate.io with institutional-grade depth, minimal slippage, and razor-thin spreads across both Spot and Futures products.
🌐 Comprehensive Web3 & Multi-Asset Access:
From Gate Startup launchpads to advanced financial tools like Gate Money, Gate.io provides an end-to-end portal designed for retail and institutional traders alike.
🎯 Conclusion: The Next Era of Digital Finance
The CFTC's move toward establishing a dedicated Crypto Asset Market (CAM) category isn't just news—it is a signal that crypto is maturing into a core global asset class. Platforms built on transparency, deep liquidity, and security will lead this next market expansion.
👉 Trade BTC, XRP, XLM, XTZ and explore institutional-grade trading today:
https://www.gate.com
$BTC $XRP $XLM $XTZ #CFTCProposesNew���CryptoAssetMarket”Category
BTC+0.54%
XRP+0.42%
XLM-2.30%
XTZ+3.79%
  • 3
#BitmineAddsMoreETH,HoldingsTop6.01M 🔥 INSTITUTIONAL POWER MOVE: Bitmine Crosses 6.01M ETH — 99% Toward the Legendary “Alchemy of 5%”!
The numbers just dropped, and the Ethereum supply story just got a whole lot tighter.
Bitmine Immersion Technologies (NYSE: BMNR), chaired by Tom Lee, has once again delivered an uncompromising statement of conviction:
💥 Latest Weekly Acquisition: +15,112 ETH
📊 Total ETH Holdings: 6,016,414 ETH
💵 Treasury Value: ~$16.4 Billion (at $2,726/ETH)
🏛️ Share of Total Supply: 4.9% of Ethereum’s 122.1 million ETH
🎯 Progress to “Alchemy of 5%” Target: 99% complete
BlackoutCryptoBoy
#BitmineAddsMoreETH,HoldingsTop6.01M 🔥 INSTITUTIONAL POWER MOVE: Bitmine Crosses 6.01M ETH — 99% Toward the Legendary “Alchemy of 5%”!
The numbers just dropped, and the Ethereum supply story just got a whole lot tighter.
Bitmine Immersion Technologies (NYSE: BMNR), chaired by Tom Lee, has once again delivered an uncompromising statement of conviction:
💥 Latest Weekly Acquisition: +15,112 ETH
📊 Total ETH Holdings: 6,016,414 ETH
💵 Treasury Value: ~$16.4 Billion (at $2,726/ETH)
🏛️ Share of Total Supply: 4.9% of Ethereum’s 122.1 million ETH
🎯 Progress to “Alchemy of 5%” Target: 99% complete — only ~89,000 ETH remaining
This is not a one-off buy.
This is the 15th consecutive month of uninterrupted weekly ETH accumulation that began on June 30, 2025. No pauses. No excuses. Just relentless institutional demand removing ETH from the open market week after week.
The Real Engine Behind the Numbers
While most of the market debates price, Bitmine is building a cash-flow machine:
5,067,309 ETH already staked (≈84% of total holdings)
Projected annualized staking revenue: ~$363 million
7-day annualized yield: 2.63%
This is not speculative holding. This is productive capital generating real yield while simultaneously tightening liquid supply.
Why This Matters for Every $ETH Holder on Gate.io
When a single publicly listed company approaches control of 1 out of every 20 ETH in existence, the market structure changes. Liquidity becomes scarcer. Institutional conviction becomes visible on-chain and in the order books.
On Gate.io, you sit at the center of this shift:
Deepest ETH liquidity across Spot, Futures, and Margin
Seamless access to ETH staking and yield products via Gate Earn
VIP fee discounts that reward high-volume traders who understand institutional flows
Real-time market depth so you can position alongside the same capital that is quietly absorbing supply
Scarcity is no longer a theory.
It is being engineered in real time by one of the largest corporate Ethereum treasuries on the planet.
The future belongs to those who recognize structural demand before the rest of the market fully prices it in.
👉 Trade ETH with institutional-grade liquidity, upgrade your VIP status, and stay ahead of the supply squeeze — only on Gate.io
https://www.gate.com
#BitmineAddsMoreETH #HoldingsTop6.01M #BitmineAddsMoreETH,HoldingsTop6.01M
repost-content-media
BMNR-1.57%
ETH-0.44%
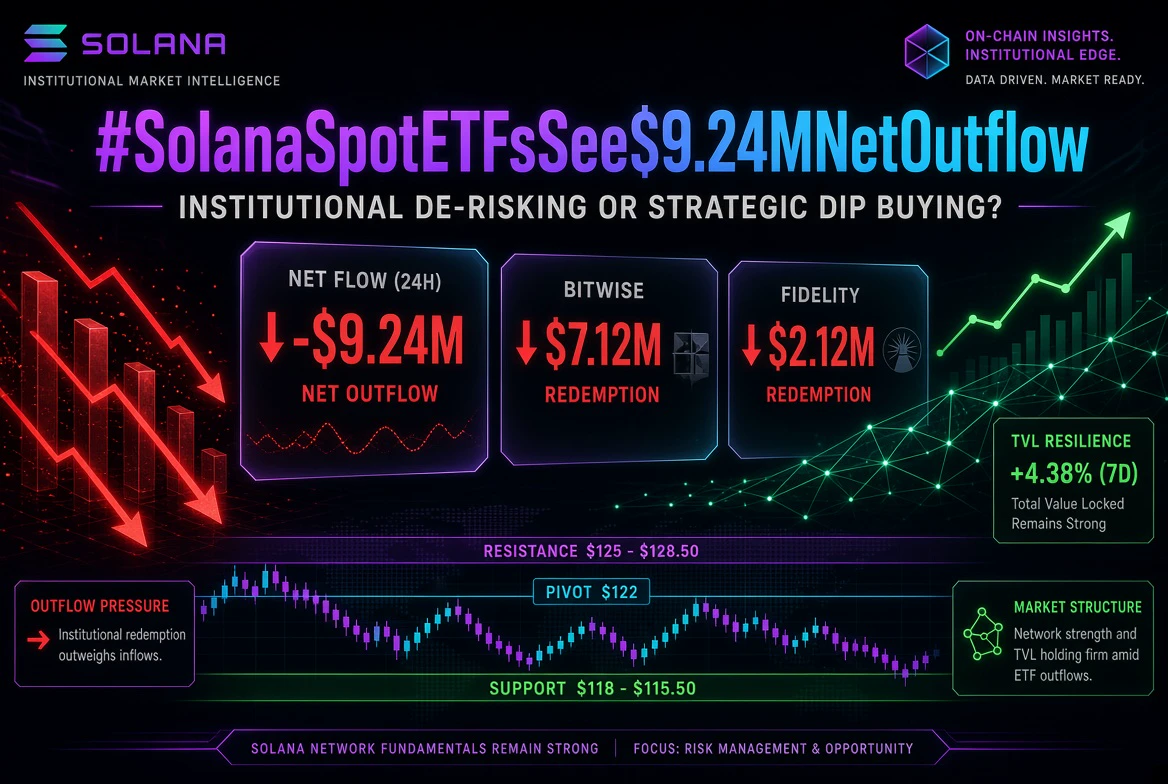
#SolanaSpotETFsSee$9.24MNetOutflow
Institutional De-risking or Strategic Dip Buying?
US Spot Solana ETFs registered a net outflow of $9.24 Million, marking a temporary pause in institutional accumulation. As macroscopic shifts and regulatory updates continue to shape the digital asset landscape, tracking daily ETF flow metrics offers key insight into smart-money positioning.
📊 Comprehensive Flow & On-Chain Breakdown
Institutional Fund Outflows: The primary contributor to today's negative net flow was Bitwise ($BSOL), accounting for approximately $7.12M in redemptions, followed by Fidelity
BlackoutCryptoBoy
#SolanaSpotETFsSee$9.24MNetOutflow
Institutional De-risking or Strategic Dip Buying?
US Spot Solana ETFs registered a net outflow of $9.24 Million, marking a temporary pause in institutional accumulation. As macroscopic shifts and regulatory updates continue to shape the digital asset landscape, tracking daily ETF flow metrics offers key insight into smart-money positioning.
📊 Comprehensive Flow & On-Chain Breakdown
Institutional Fund Outflows: The primary contributor to today's negative net flow was Bitwise ($BSOL), accounting for approximately $7.12M in redemptions, followed by Fidelity ($FSOL) with roughly $2.12M.
Macro Accumulation Context: Despite this daily net outflow, aggregate cumulative inflows across major Spot Solana ETF products remain firmly in positive territory above $1.6B+, signaling intact structural demand.
On-Chain & Liquidity Dynamics: Solana’s Total Value Locked (TVL) and Decentralized Exchange (DEX) daily volume continue to demonstrate network resilience, maintaining heavy usage despite short-term ETF capital reallocation.
📈 Technical Outlook & Strategic Levels
Resistance Zone : $125.00 - $128.50 [Key Breakout Target]
Current Pivot : $122.00 [Volume Weighted Average Price]
Support Floor : $118.00 - $115.50 [Major Demand & Liquidity Zone]
Short-Term View: High-frequency ETF redemptions typically exert immediate pressure on spot order books. Watch for liquidation clusters near key support ranges before establishing direction.
Risk Management: Volatility following daily fund flows favors disciplined Dollar-Cost Averaging (DCA) or awaiting structural retests over high-leverage entry.
💬 Gate Community Discussion & Strategy Exchange
How are you adjusting your spot and futures positioning following today's ETF metrics?
🚀 Bullish Accumulation: Viewing the $9.24M outflow as routine profit-taking and scaling into long-term spot positions.
🐻 Bearish Caution: Expecting further downside pressure on $SOL until ETF flows flip net positive.
⚖️ Hedging & Range Trading: Executing grid trading or delta-neutral strategies within the $115–$125 channel.
Drop your technical analysis and market bias in the comments below! 👇
#Solana $SOL
repost-content-media
SOL-0.57%
#BTCBreaksThrough$86,000 BTC Holds Critical Structure After $86K Breakout — Updated Market Breakdown & Outlook
Bitcoin recently surged through the $86,000 level (intraday highs near $86,900–$87,200), marking a decisive technical reclaim of a major multi-month resistance zone. While price has since consolidated near $83,000–$83,500, the structural significance of the breakout remains intact. This move was fueled by persistent institutional demand, improving macro conditions, and forced short covering.
Institutional Drivers & On-Chain Fundamentals
Spot ETF Accumulation Continues: U.S. spot Bitco
BlackoutCryptoBoy
#BTCBreaksThrough$86,000 BTC Holds Critical Structure After $86K Breakout — Updated Market Breakdown & Outlook
Bitcoin recently surged through the $86,000 level (intraday highs near $86,900–$87,200), marking a decisive technical reclaim of a major multi-month resistance zone. While price has since consolidated near $83,000–$83,500, the structural significance of the breakout remains intact. This move was fueled by persistent institutional demand, improving macro conditions, and forced short covering.
Institutional Drivers & On-Chain Fundamentals
Spot ETF Accumulation Continues: U.S. spot Bitcoin ETFs posted net inflows of ~$119M on the latest reported day, with +$239M over 7 days and +$3.46B over 30 days. BlackRock’s IBIT remains the dominant absorber of supply.
Macro Tailwind: Cooling inflation data and shifting rate-cut expectations have supported broader risk-on sentiment across equities and crypto.
Derivatives Dynamics: The push above $86,000 triggered meaningful short liquidations, amplifying upside momentum through forced buy-backs.
Exchange Reserves: Continued net outflows from major centralized exchanges signal ongoing migration into long-term custody and institutional wallets — a classic supply-tightening signal.
Technical Structure & Key Levels
Level
Price Zone
Significance
Resistance 2 (Major Target)
$88,500 – $90,000
Psychological + liquidity cluster
Resistance 1 (Local Pivot)
$86,000 – $86,800
Breakout zone / prior supply node
Current Price Area
~$83,200 – $83,500
Consolidation after breakout
Immediate Support
$82,800 – $83,000
Recent low / volume shelf
Demand Floor
$84,000 – $84,500 (reclaim) / $81,500 – $82,000
Stronger structural base if deeper retest
Short-term bias: As long as Bitcoin holds above the $82,800–$83,000 demand zone and eventually reclaims $86,000 on a daily close, the path of least resistance remains toward the $88,500–$90,000 liquidity pocket. A failed retest of $86k that breaks lower opens room for a deeper flush into the $81.5k–$82k region.
Execution Framework
Volatility remains elevated post-breakout. Preferred approaches:
Spot accumulation on successful support holds or controlled pullbacks.
Tight risk management on leveraged positions — avoid over-sizing in this range.
Grid / range strategies between $83k–$86.5k while waiting for directional resolution.
Gate Community — How are you positioned?
Accumulating spot on dips into support?
Running strict risk-managed leverage?
Deploying grid bots in the current consolidation range?
Drop your charts, levels, and bias below. Let’s discuss.
#Bitcoin $BTC #GateMoneyOfficiallyLaunches #USSeptemberJobs29K
BTC+0.54%
IBIT+0.47%
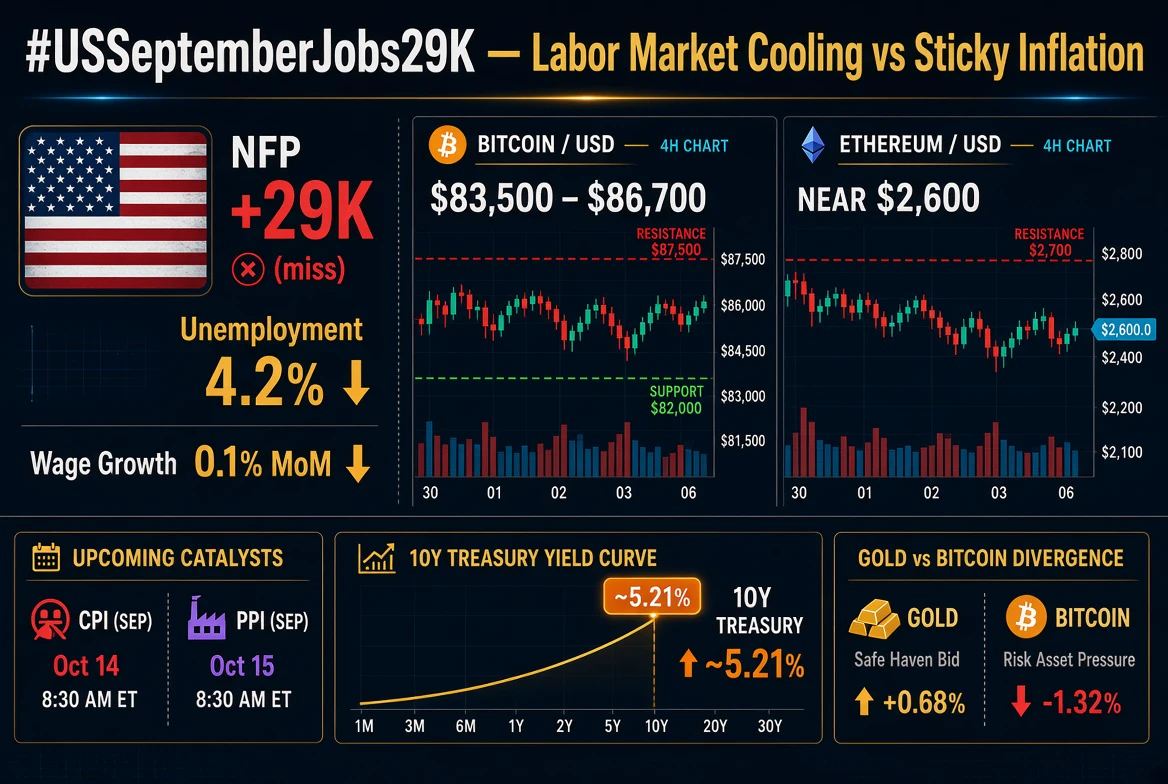
#USSeptemberJobs29K — Labor Market Cooling vs. Sticky Inflation: Macro Playbook for BTC and ETH
The U.S. Labor Department's September Nonfarm Payroll (NFP) report delivered a sharp macroeconomic shock to global risk assets. Nonfarm payrolls expanded by just 29,000 jobs—substantially missing consensus estimates of roughly 90,000—while the national unemployment rate ticked upward from 4.1% to 4.2%. Downward revisions removed 29,000 jobs from August (adjusted from 162,000 to 133,000) and subtracted approximately 60,000 positions across prior months.
Concurrently, Average Hourly Earnings rose a m
BlackoutCryptoBoy
#USSeptemberJobs29K — Labor Market Cooling vs. Sticky Inflation: Macro Playbook for BTC and ETH
The U.S. Labor Department's September Nonfarm Payroll (NFP) report delivered a sharp macroeconomic shock to global risk assets. Nonfarm payrolls expanded by just 29,000 jobs—substantially missing consensus estimates of roughly 90,000—while the national unemployment rate ticked upward from 4.1% to 4.2%. Downward revisions removed 29,000 jobs from August (adjusted from 162,000 to 133,000) and subtracted approximately 60,000 positions across prior months.
Concurrently, Average Hourly Earnings rose a modest 0.1% month-over-month (3.0% YoY), signaling a simultaneous deceleration in both wage growth and labor participation momentum.
Macro Dynamics & Treasury Yield Friction
While a weakening labor market typically fuels dovish monetary policy expectations, the cross-asset price action revealed underlying structural friction:
Treasury Yield Reversal: The Benchmark 10-Year U.S. Treasury yield spiked downward by ~8 basis points toward 5.15% following the NFP release before aggressively rebounding toward 5.21%. The 2-Year yield followed a similar path, recovering toward 4.82%, while the 30-Year yield anchored near 5.62%.
The Stagflationary Trap: Long-term yields holding above 5.00% indicate that debt markets remain heavily concerned about persistent inflation (August CPI at 3.4% YoY; PPI elevated at 5.4% YoY). As long as risk-free yields offer competitive real returns, high-beta crypto assets face persistent allocation headwinds.
* Gold vs. Bitcoin Divergence: Gold demonstrated superior capital preservation, rallying toward $4,223/oz and holding its structural gains, whereas Bitcoin's initial liquidity-driven spike above $86,700 was met with heavy overhead sell orders, driving prices back into range parameters.
Technical Market Structure & Strategic Key Levels
===================================================================================
ASSET RESISTANCE 2 RESISTANCE 1 CURRENT PIVOT SUPPORT 1 SUPPORT 2
===================================================================================
Bitcoin $87,500 - $90,000 $85,300 - $85,500 $84,000 $83,500 - $83,800 $82,000 - $82,500
Ethereum $2,725 - $2,760 $2,680 - $2,700 $2,600 $2,590 - $2,610 $2,550 - $2,570
===================================================================================
Bitcoin ($BTC ) Technical Analysis
Range Dynamics: BTC continues to consolidate between $83,500 and $86,700. A sustained daily close above $87,500 is required to confirm a structural breakout toward the psychological $90,000 target.
Downside Liquidity Risks: Losing the $83,500 support base exposes the major institutional demand zone between $82,000 and $83,000. A failure to defend $82,000 would invalidate the mid-term bullish structure.
Ethereum ($ETH ) Relative Weakness
Altcoin Health Benchmark: ETH remains constrained near $2,600, significantly underperforming BTC. Reclaiming $2,680–$2,700 is the immediate operational requirement for short-term buyers.
Systemic Impact: Until ETH establishes a clear daily close above its key moving averages ($2,725–$2,760 zone), broad altcoin exposure carries elevated directional risk.
Key Macro Catalysts & Playbook
The focus shifts directly to upcoming inflation prints and federal policy decisions:
Upcoming Inflation Data: September CPI (October 14) and PPI (October 15) serve as the ultimate directional triggers for Q4 digital asset liquidity.
Bullish Scenario (Cooling Inflation): A CPI print coming in under expectations paired with 10-Year Treasury yields dropping back below 5.00% provides the macro clearance required for BTC to push past $87,500 toward $90,000.
Bearish Scenario (Sticky Inflation): A hotter-than-expected CPI print will keep bond yields elevated, potentially forcing a breakdown below $83,500 and driving a liquidity sweep down to $82,000.
Strategic Trading Blueprint
Patient Execution: Avoid initiating high-leverage market entries within the middle of the $84,000 range.
Key Triggers: Look for high-volume spot absorption around the $82,000–$83,000 support cluster for long accumulation, or trade momentum on a confirmed close above $87,500.
Macro Monitor: Track the 10-Year Treasury yield as a leading indicator—yield expansion above 5.25% demands tight risk management across all crypto positions.
#ShareWeekly #PlanYourTradesThisWeek #USSeptemberJobs29K
repost-content-media
BTC+0.54%
ETH-0.44%
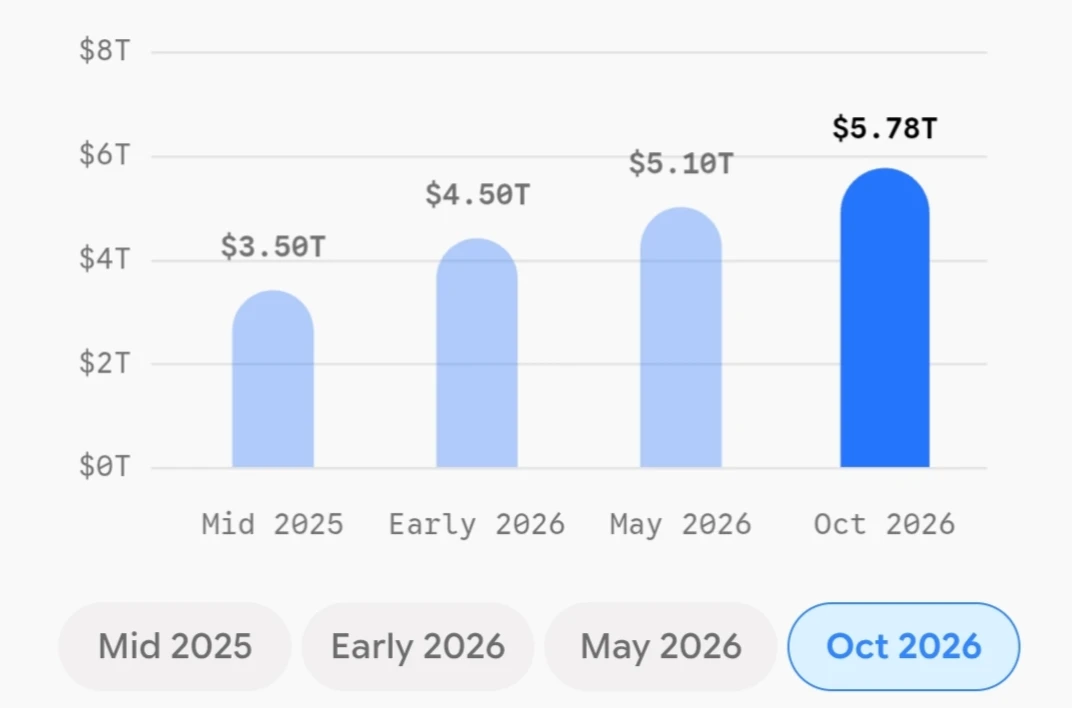
#NvidiaHitsRecordHigh Nvidia ($NVDA) has surged to a new record high above $243 per share, pushing its market capitalization past $5.75 trillion and bringing the semiconductor titan within striking distance of a historic $6 trillion valuation.
The recent rally—which has added more than $1.2 trillion in market value this year—is being propelled by surging Blackwell AI chip demand, a major revenue surge from key manufacturing partner Foxconn, and upgraded price targets across Wall Street.
NVIDIA Path to $6 Trillion
Market cap progression & primary fundamental catalysts
Oct 2026 — Foxconn Surge &
BlackoutCryptoBoy
#NvidiaHitsRecordHigh Nvidia ($NVDA) has surged to a new record high above $243 per share, pushing its market capitalization past $5.75 trillion and bringing the semiconductor titan within striking distance of a historic $6 trillion valuation.
The recent rally—which has added more than $1.2 trillion in market value this year—is being propelled by surging Blackwell AI chip demand, a major revenue surge from key manufacturing partner Foxconn, and upgraded price targets across Wall Street.
NVIDIA Path to $6 Trillion
Market cap progression & primary fundamental catalysts
Oct 2026 — Foxconn Surge & Rubin Roadmap
Cap:
$5.78T
Share:
$243.37
Wall Street valuation upgrades fueled by Foxconn revenue surge (+47%) and formal Rubin next-gen architecture roadmap preview.
Foxconn +47%
Rubin Architecture
Wall Street Upgrades
Core Drivers Behind the Record High
Explosive AI Infrastructure Capex: Hyperscalers (Microsoft, Meta, Alphabet, and Amazon) continue to expand capital expenditure for AI data center deployments, heavily favoring Nvidia's enterprise GPU architecture.
Foxconn Revenue Surge: Major manufacturing partner Foxconn reported a 47% year-over-year revenue surge, signaling robust hardware assembly demand for Nvidia's high-density server racks.
Wall Street Price Target Upgrades: Analysts at Morgan Stanley and other major firms reaffirmed "Overweight" ratings with target prices as high as $300, citing software/service high-margin income and forward P/E compression as earnings outpace stock gains.
Near $6 Trillion Threshold: Nvidia now accounts for a dominant share of the S&P 500's year-to-date gains, consolidating its position as the world's most valuable public enterprise.
repost-content-media
NVDA+0.61%
MSFT+0.80%
META+3.05%
AMZN+0.03%
  • 1
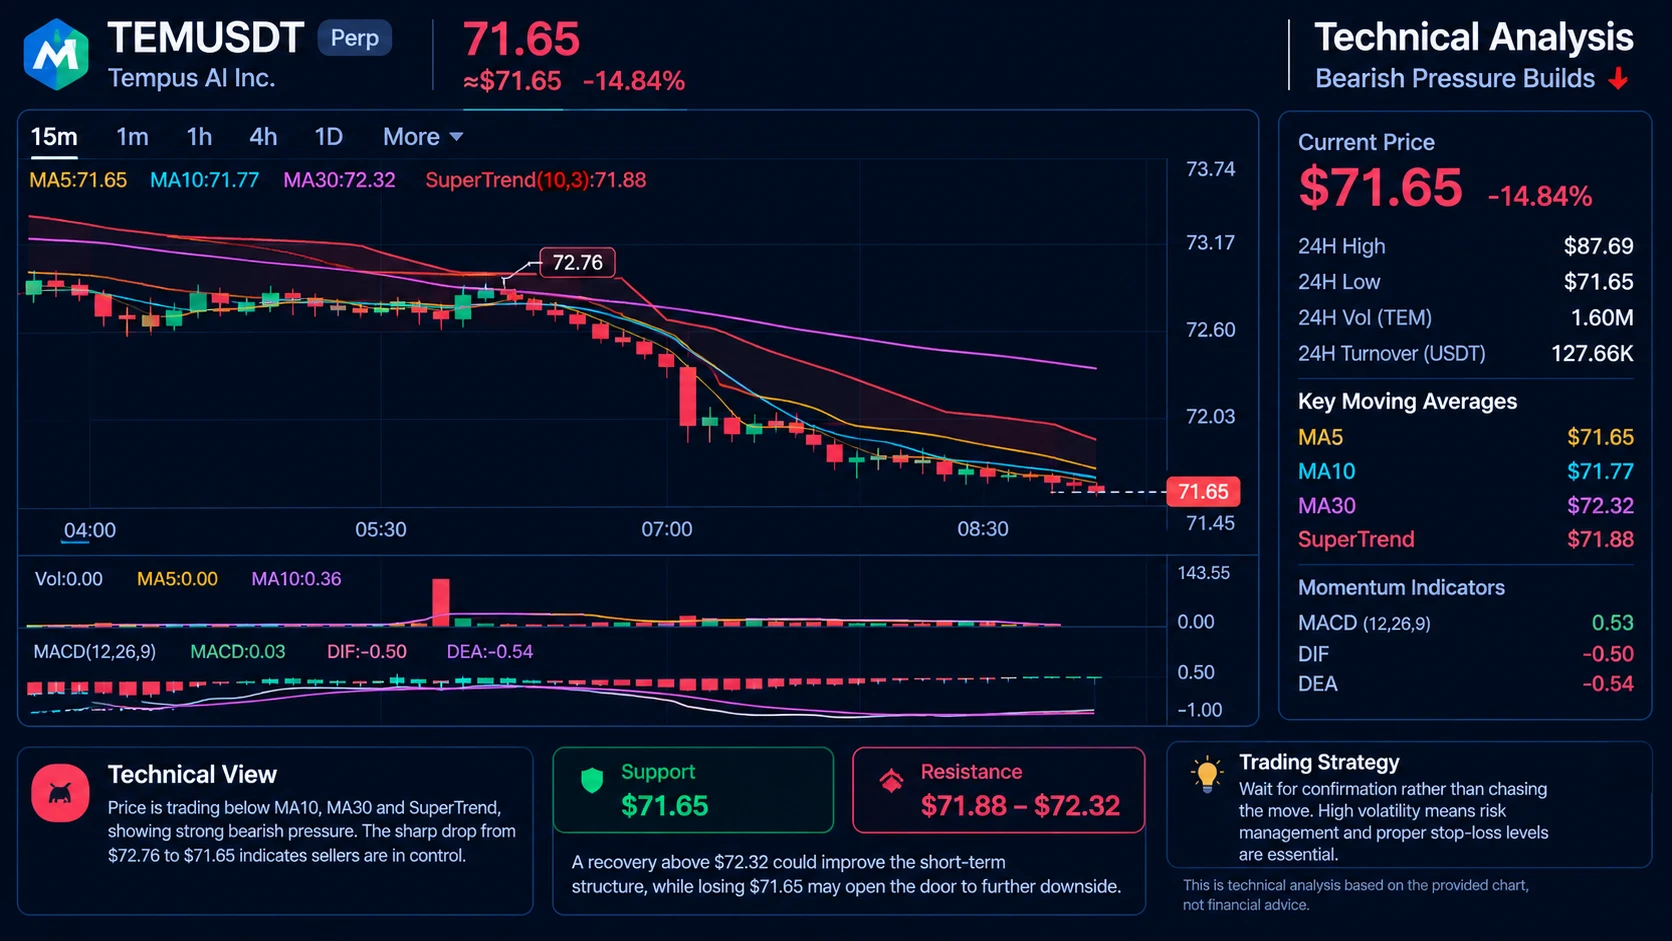
TEMUSDT Technical Update — Bearish Pressure Builds
TEMUSDT is currently trading around $71.65, down approximately 14.84%, showing strong short-term selling pressure.
Key data from the chart:
Current Price: $71.65
24H High: $87.69
24H Low: $71.65
24H Turnover: ~$127.66K USDT
MA5: $71.65
MA10: $71.77
MA30: $72.32
SuperTrend: $71.88
MACD: 0.03
DIF: -0.50
DEA: -0.54
Technical View
The 15-minute chart is clearly under pressure. Price is trading below the MA10, MA30 and SuperTrend, which keeps the immediate trend bearish. The sharp move from around $72.76 toward $71.65 also shows sellers currently h
BlackoutCryptoBoy
TEMUSDT Technical Update — Bearish Pressure Builds
TEMUSDT is currently trading around $71.65, down approximately 14.84%, showing strong short-term selling pressure.
Key data from the chart:
Current Price: $71.65
24H High: $87.69
24H Low: $71.65
24H Turnover: ~$127.66K USDT
MA5: $71.65
MA10: $71.77
MA30: $72.32
SuperTrend: $71.88
MACD: 0.03
DIF: -0.50
DEA: -0.54
Technical View
The 15-minute chart is clearly under pressure. Price is trading below the MA10, MA30 and SuperTrend, which keeps the immediate trend bearish. The sharp move from around $72.76 toward $71.65 also shows sellers currently have control.
Support: $71.65
Resistance: $71.88–$72.32
A recovery above $72.32 could improve the short-term structure, while losing $71.65 may open the door to further downside.
Trading Strategy: Wait for confirmation rather than chasing the move. High volatility means risk management and proper stop-loss levels are essential.
This is technical analysis based on the provided chart, not financial advice.
repost-content-media
  • 1
#NvidiaHitsRecordHigh 🚀📈
NVIDIA Hits a New All-Time High — What This Really Means for Gate.io Traders
NVIDIA just pushed into fresh record territory, and the market is paying close attention. This isn’t just another tech stock making a new high. NVIDIA has become the purest public-market proxy for the AI boom. When it moves like this, it sends a signal that goes far beyond Wall Street.
For Gate.io traders, these moments matter. The line between traditional markets, AI infrastructure, and digital assets is getting thinner every month. Strong risk appetite in big tech often shows up later in
BlackoutCryptoBoy
#NvidiaHitsRecordHigh 🚀📈
NVIDIA Hits a New All-Time High — What This Really Means for Gate.io Traders
NVIDIA just pushed into fresh record territory, and the market is paying close attention. This isn’t just another tech stock making a new high. NVIDIA has become the purest public-market proxy for the AI boom. When it moves like this, it sends a signal that goes far beyond Wall Street.
For Gate.io traders, these moments matter. The line between traditional markets, AI infrastructure, and digital assets is getting thinner every month. Strong risk appetite in big tech often shows up later in crypto sentiment, liquidity, and sector rotations. Ignoring that connection is like trading with one eye closed.
Why This High Actually Matters
A record high in NVIDIA is not just price action — it’s a confidence vote.
Investors are still willing to pay up for companies that sit at the center of AI infrastructure: chips, data centers, computing power. That tells us something important about the current market mood. Risk appetite is alive. Growth narratives still have fuel. Capital is still hunting for the next wave of technological dominance.
But here’s the key question every serious trader should ask:
Is this strength isolated to one stock, or is it reflecting a broader risk-on environment?
Because if the second answer is true, then crypto markets — especially AI-related tokens, infrastructure plays, and high-beta assets — often feel the second-order effects.
The Gate.io Angle
On Gate.io, traders don’t just watch candles. They watch narratives, capital flows, and cross-market signals.
Right now the dominant narrative is clear: AI is infrastructure. It’s no longer a futuristic story. It’s already reshaping how companies build products, process data, and compete. NVIDIA sits at the heart of that build-out. When the market rewards that story this aggressively, it reinforces the entire AI theme across asset classes.
Crypto doesn’t move in a vacuum. When traditional markets show strong confidence in technology and growth, it can support better conditions for digital assets too. But it never happens automatically. Crypto remains its own animal — faster, more emotional, and more sensitive to liquidity and sentiment shifts.
That’s why smart Gate.io traders treat NVIDIA’s move as useful information, not a trading signal.
What Traders Should Actually Watch
A breakout to new highs can create powerful FOMO. It can also create traps.
After a move like this, the checklist is simple but important:
Is volume confirming the move or fading?
Are buyers still defending higher levels, or is the price stalling?
How is broader risk sentiment behaving (Nasdaq, growth stocks, Bitcoin dominance)?
Is the AI narrative still expanding, or is it starting to look crowded?
Are crypto AI tokens and related narratives showing relative strength or lagging?
A record high is not an automatic entry. Sometimes the best move already happened. Other times the real opportunity comes after the inevitable consolidation or pullback.
Discipline beats excitement every time.
The Bigger Picture for Digital Assets
We’re living in a market where technology, AI, and blockchain are increasingly interconnected. NVIDIA’s strength is a reminder that powerful narratives still move capital at scale.
For Gate.io users, the lesson is clear:
Stay close to the major themes. Understand why money is flowing where it’s flowing. But never trade the headline alone.
AI is today’s dominant story. Tomorrow it could be tokenization, real-world assets, modular blockchains, or something we haven’t fully priced yet. The traders who win long-term are the ones who can read the narrative without becoming its prisoner.
Final Thought
is more than a stock milestone. It’s another data point in a larger shift: AI is reshaping markets, technology is shaping sentiment, and crypto continues to evolve inside that same environment.
On Gate.io, the advantage goes to those who stay informed, respect risk, and trade with a plan instead of chasing every green candle.
Watch the trend.
Study the structure.
Protect the capital.
The market always gives opportunities. The question is whether you’re ready when they appear.#NvidiaHitsRecordHigh
repost-content-media
NVDA+0.61%
BTC+0.54%
  • 1
📊 Livestream Recap: Ethereum Drops Below 2,700 USDT
Today, I completed a Gate Live session focused on Ethereum (ETH) falling below the 2,700 USDT level, while its 24-hour gains narrowed to around 0.20%.
During the livestream, we discussed how quickly short-term momentum can change in the crypto market and why key psychological price levels such as 2,700 USDT deserve close attention.
🔎 Key points from the discussion:
• ETH’s recent price movement and weakening short-term momentum
• Why the 2,700 USDT level is important for traders
• Potential support and resistance areas to watch
• How volume
BlackoutCryptoBoy
📊 Livestream Recap: Ethereum Drops Below 2,700 USDT
Today, I completed a Gate Live session focused on Ethereum (ETH) falling below the 2,700 USDT level, while its 24-hour gains narrowed to around 0.20%.
During the livestream, we discussed how quickly short-term momentum can change in the crypto market and why key psychological price levels such as 2,700 USDT deserve close attention.
🔎 Key points from the discussion:
• ETH’s recent price movement and weakening short-term momentum
• Why the 2,700 USDT level is important for traders
• Potential support and resistance areas to watch
• How volume and market sentiment can influence ETH’s next move
• Why traders should wait for confirmation instead of reacting emotionally to every price change
📈 My takeaway:
A small 24-hour gain does not necessarily mean strong bullish momentum. For ETH, holding or reclaiming important levels can provide more useful information about the market’s short-term direction.
💬 What do you think?
Can ETH reclaim 2,700 USDT and build stronger momentum, or could sellers push the price lower first?
Share your ETH outlook and the key level you are watching.
Thank you to everyone who joined the livestream, watched, commented, and shared their views.
ETH-0.44%
#BTCBreaksThrough$86,000 📊 ZEC/USDT Structure & Gate.io Liquidity Insights: Deep Technical & On-Chain Analysis
An analysis of ZEC/USDT on Gate.io, evaluating price action, order book liquidity, technical metrics, and fundamental drivers.
📈 Technical Structure & Trend Metrics
Following a massive macro expansion from $60 to $1,699, ZEC experienced a healthy 20% structural pullback to current levels around $1,367.
$1,699 (Recent Swing High) 🛑
\
\ ~20% Retracement (Market Cooldown)
\
---> $1,367 (Current Price) 🎯
|
|--- $1,280 – $1,330
BlackoutCryptoBoy
#BTCBreaksThrough$86,000 📊 ZEC/USDT Structure & Gate.io Liquidity Insights: Deep Technical & On-Chain Analysis
An analysis of ZEC/USDT on Gate.io, evaluating price action, order book liquidity, technical metrics, and fundamental drivers.
📈 Technical Structure & Trend Metrics
Following a massive macro expansion from $60 to $1,699, ZEC experienced a healthy 20% structural pullback to current levels around $1,367.
$1,699 (Recent Swing High) 🛑
\
\ ~20% Retracement (Market Cooldown)
\
---> $1,367 (Current Price) 🎯
|
|--- $1,280 – $1,330 (Primary Support Zone) 🛡️
|--- $1,233 (Macro Invalidated Level / Daily Close Stop) 🚨
Key Technical Indicators:
EMA Alignment: The 50-day EMA remains positioned safely above the 200-day EMA, maintaining an intact macro bullish trend structure.
RSI Cooldown: RSI has reset from overbought territory back into a neutral-to-weak range, clearing leverage heat without breaking market structure.
Bollinger Bands Compression: 30-candle volatility on daily/4-hour charts has compressed under 5%, signaling an impending high-volatility expansion move.
MACD Dynamics: The daily MACD histogram sits in red/green transition territory; short-term momentum is consolidating, but trend direction remains upward.
🎯 Gate.io Trading Ecosystem & Order Book Advantage
Trading ZEC specifically on Gate.io offers strategic and structural liquidity advantages:
| Gate.io Feature / Tool | Tactical Trading Benefit |
|---|---|
| Order Book Depth (ZEC/USDT) | High institutional liquidity around the $1,280–$1,330 bid ladder minimizes execution slippage. |
| Gate.io Grid Trading Bot | Ideal for range-bound accumulation between $1,280 and $1,500 during low-volatility Squeeze phases. |
| Perpetual Futures Depth | Transparent funding rate metrics allow traders to track long/short leverage distribution in real time. |
| Gate.io Startup & Proof of Reserves | 100% Proof-of-Reserves backed custody provides secure holding for spot accumulation. |
⚙️ Fundamental Catalysts: The NU7 Upgrade & Institutional Inflows
🚀 Technical Network Upgrade (NU7)
Block Speed: Block times decrease from 75s to 25s (3x throughput capacity).
Emission Control: Block rewards are reduced proportionately to keep net daily supply inflation unchanged.
Network Sustainability Mechanism: 60% of transaction fees are directed to future mining reserves, preserving long-term network security.
Supply Dynamics: Approximately 30% of ZEC supply remains locked inside the shielded pool, restricting liquid circulating float.
🏛️ Regulatory Clarity & ETF Drivers
SEC Clearance: The two-year SEC investigation into the Zcash Foundation concluded with zero charges.
Grayscale Spot ETF (ZCSH): Institutional capital continues to enter through spot ETFs, elevating market cap floor levels.
💡 Execution & Strategy Guidelines
> Risk Disclosure: Chasing market breakouts mid-range carries poor risk-to-reward metrics. Strategic scaling into high-liquidity zones yields cleaner execution.
>
Scale-In Zone: $1,280 – $1,330 (Gate.io Spot/Grid entry ladder)
Hard Stop Loss: Below $1,233 (Daily close below invalidates macro bullish structure)
Take Profit Targets:
TP1: $1,500 – $1,550
TP2: $1,699 (Previous High Test)
TP3: $1,850+ (Extension Phase)
ZEC-1.65%