
Square
Following
Hot
News
Notifications
Profile
Share your thoughts
placeholder
Article
🔥Fed's Cook: Current interest rates are not restrictive enough
🔴Summary of Fed Governor Lisa Cook's remarks:
- The 25 bps hike in September was not enough to change the inflation trajectory. October PCE is estimated at around 3.8%
- Financial conditions remain too loose: interest rates have not slowed AI investment, while rising stock prices continue to support spending
- Delaying tightening could cause inflation to become entrenched in the economy
- There is still little evidence that AI has had a significant impact on employment
🔴At the October FOMC meeting, Cook voted against the decisio
post-image
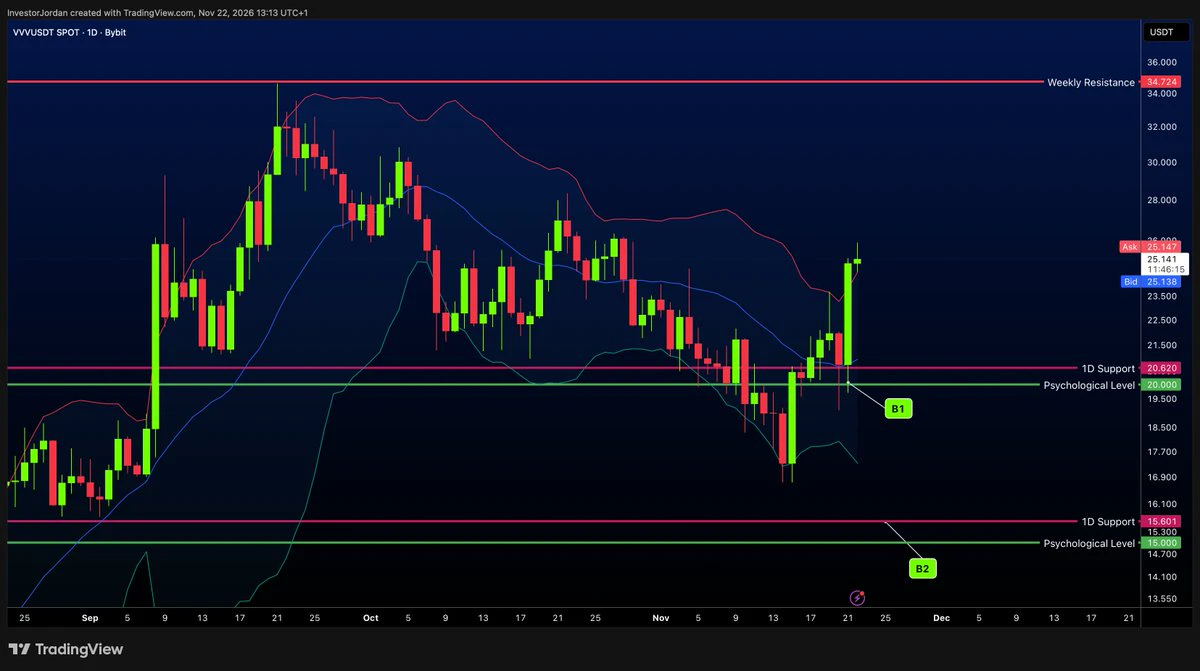
Can we take a moment to appreciate the INSANE strength in $VVV?
While the rest of the market has been selling off, VVV has bounced almost perfectly from our Buy Zone and is already up 27% in just 2 days.
Absolute strength.
post-image
VVV-1.61%
Trenches
IDOL
I
bade
b
IDOL
0x3b...ab07
Market Cap
$.
Change
.
24h Vol
$.
Holders
.
PIEVERSE
P
bade
b
PIEVERSE
0x0e...25a9
Market Cap
$.
Change
.
24h Vol
$.
Holders
.
JAGENT
J
bade
b
JAGENT
0x8e...ae15
Market Cap
$.
Change
.
24h Vol
$.
Holders
.
Singularity
S
bade
b
Singularity
7R4M...pump
Market Cap
$.
Change
.
24h Vol
$.
Holders
.
CLAUDIA
C
bade
b
CLAUDIA
2j5S...W2ZM
Market Cap
$.
Change
.
24h Vol
$.
Holders
.
I have 30 coins + Bitcoin that I follow for months for trading and investing, and to provide better service to subscribers
But do I stick with them forever? Of course not.
I’m not just a technical analyst who looks at charts; I follow the coins themselves, their projects, and their flows to decide whether to stick with them or remove them from my investment list
I don’t consider any coin a constant unless its continued existence is stable, because money is precious
So when you’re thinking about buying a coin, don’t buy it for the chart
Buy it for its actual movement alone, and then look at the
post-image
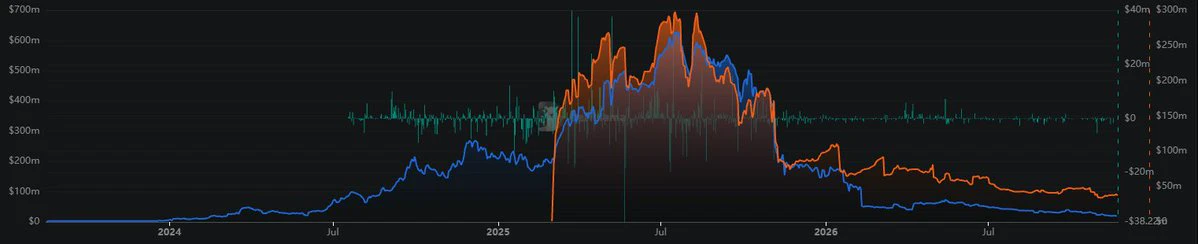
Bitcoin’s 4-year cycle isn’t dead; what’s dead is the patience of people in a hurry to get rich.

Everyone online is shouting “the cycle is broken” and “a financial crisis is coming.” I checked the complete data for all four cycles:

1. The timing is spot-on. This cycle’s top was October 6, 2025, 534 days after the April 2024 halving—right in the historical 12–18-month post-halving window for a top (368 / 525 / 549 days in the previous three cycles). The cycle hasn’t disappeared; it’s just been compressed by institutional capital. The maximum drawdown this cycle was about 54%, compared with 77
post-image
BTC-0.67%
  • 2
  • 1
🌹Qiuyu | 5 years of unwavering commitment, sharing trade-entry ideas every day
Long-term tracking of price levels + direction, with a consistently stable historical win rate📈GT: Building positions in batches after a sharp drop. 5GT subscription channel open for 3 days👇

https://www.gate.com/zh/profile/秋雨何时了

🌹 In two days, it climbed from 55,130/1540 to 61,000/1730. The rise wasn’t luck—it was a structure that took shape while we waited. Four probes of the bottom held; the fifth was the final washout. Once the V-reversal closed, wave five kicked off—
🌹I laid out this rhythm in the strateg
GT-2.41%
BTC-0.67%
  • 1
Same day, same weekly candlestick 📉📈
Innolight fell from 1415 to 393, losing more than 70% 😭
ICBC rose from 6.53 to 9.40, hitting a new high 🚀
One is the “core AI asset” you’ve been chasing for half a year 🤖
The other is the “big elephant” you thought was too slow and never even bothered to look at 🐘
The market never lacks opportunities; what’s lacking is your ability to hold on 🤷‍♂️
ICBC+0.25%
$MAGMA The 24-hour trading volume is 41.7M, and the price rose from 0.2050 to 0.2750, up 28.57%. Volume has picked up, but structurally, something about it feels off.
There are three possibilities. First, big money really came in and swept up tokens, with volume-backed breakout above the previous high. This kind of volume is usually followed by lower volume on a pullback, so you can let it play out. Second, holders who were underwater are using the rally to trade out of their positions. The volume is distribution, and this pattern often can't hold sideways once it reaches its target. Third, sh
MAGMA-0.57%
  • 2
  • 1
#BLESS #WCTCS9 #ShareWeekly
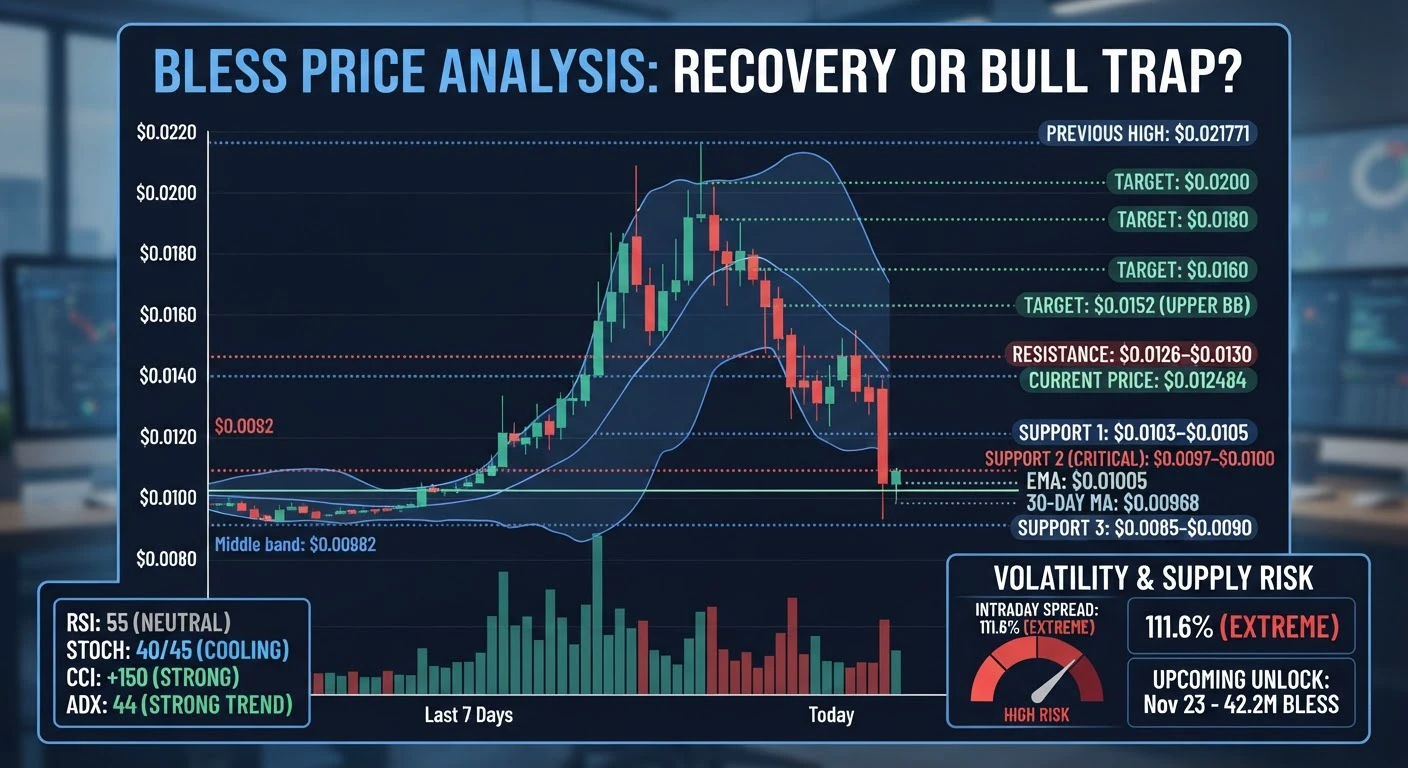
BLESS RICE ANALYSIS: Is This a Genuine Recovery or Another Bull Trap? Key Levels, Market Momentum, and Trading Opportunities

BLESS is entering a critical phase where both bulls and bears have strong reasons to remain active. After a powerful weekly recovery followed by a sharp daily correction, the market is presenting an important question: are buyers preparing for another upward move, or is the recent rally losing strength? Based on the November 21, 2026 reference snapshot, BLESS was trading around $0.012484, with a 24-hour low near $0.010288 and a high around $0
post-image
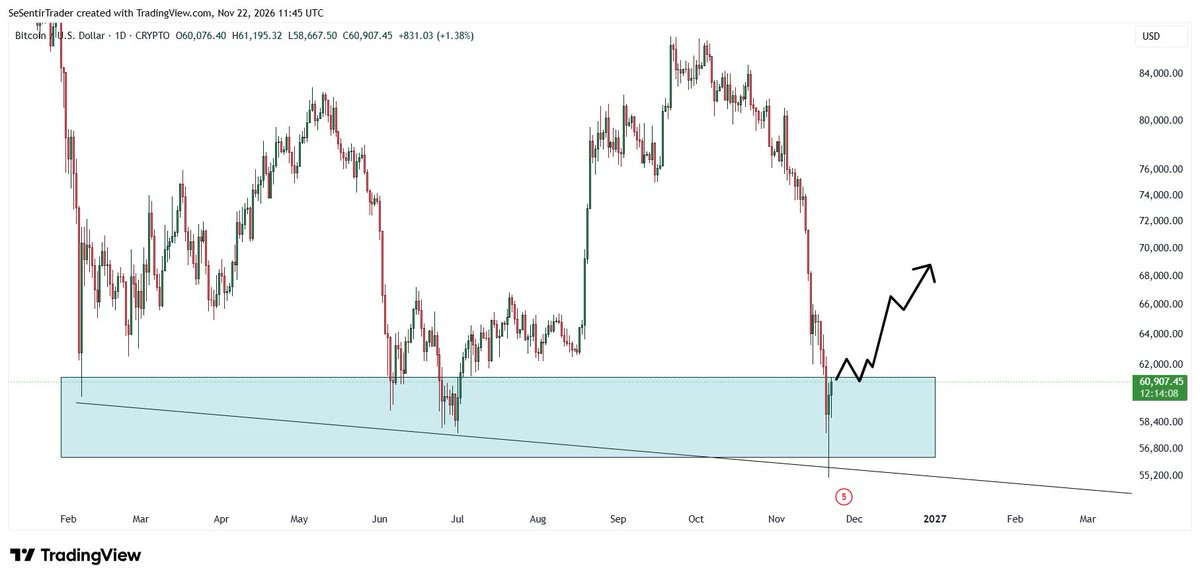
$BTC
Bullish scenario
Bitcoin is currently at a crossroad. Price action in the next few days will determine whether we go lower or higher. I'm not making any moves now, just waiting.
I shared a bearish scenario, this is the opposite one.
$BTC staying above 60,000$, at least for a few days, would be a good indicator of a recovery.
On the contrary, if bears keep pushing us around 56,000$, then a monster crash remains possible.
post-image
BTC-0.67%
  • 1
I changed my mind. $BLESS A 24.70% bullish candle like this is treated by many as a textbook example of a “high-volume breakout,” with 236.2M in trading volume seen as ironclad proof that money is flowing in. I used to see it that way too, but after reviewing several similar tokens, I realized that argument doesn’t hold up.
High trading volume doesn’t mean big money is buying. It only means a lot of turnover, with both buyers and sellers pushing hard. Genuine buying shows up as the price holding firm and not breaking down on a pullback, not as a one-day jump from 0.0107 to 0.0148 followed by
BLESS-2.00%
  • 1
  • 1
🔥 GATE.IO ⚡ | CRYPTO MARKET ALERT | WHATS NEXT FOR BTC? 📊🚀
live-cover
LIVE2,195
BTC-0.67%
SOL-0.77%
ETH-1.26%
ETH SURPASSES 1700USDT
live-cover
LIVE7,078
XRP-1.12%
BTC-0.65%
SOL-0.74%
DOGE-0.18%
ZEC+1.29%
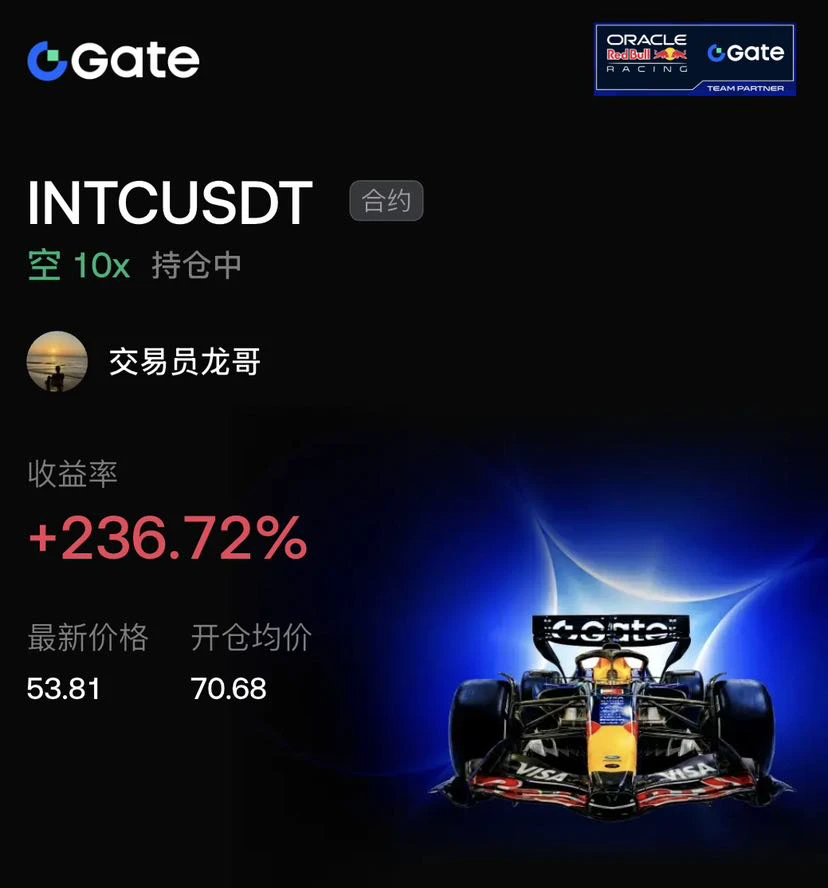
$INTC The logic behind this sharp drop from the highs is actually very clear.

There was severe bearish divergence near 70.68, with volume shrinking, so I went straight into a 10x short. The price dropped smoothly to 53.81, locking in a 236% gain. Once the downtrend was confirmed, riding it was faster than anything else.

With 10x leverage, there were also rebound wicks along the way. Fortunately, I stuck to strict discipline, moved the stop-loss up to breakeven, and held the position throughout. In the end, trading comes down to mindset and rules.

Shorts in profit at these lows could dump th
post-image
INTC+0.05%
BTC-0.65%
ETH-1.23%
an evening by the water has a distinct flavor
post-image
Officially starting trade signals tomorrow, targeting 10x!
post-image
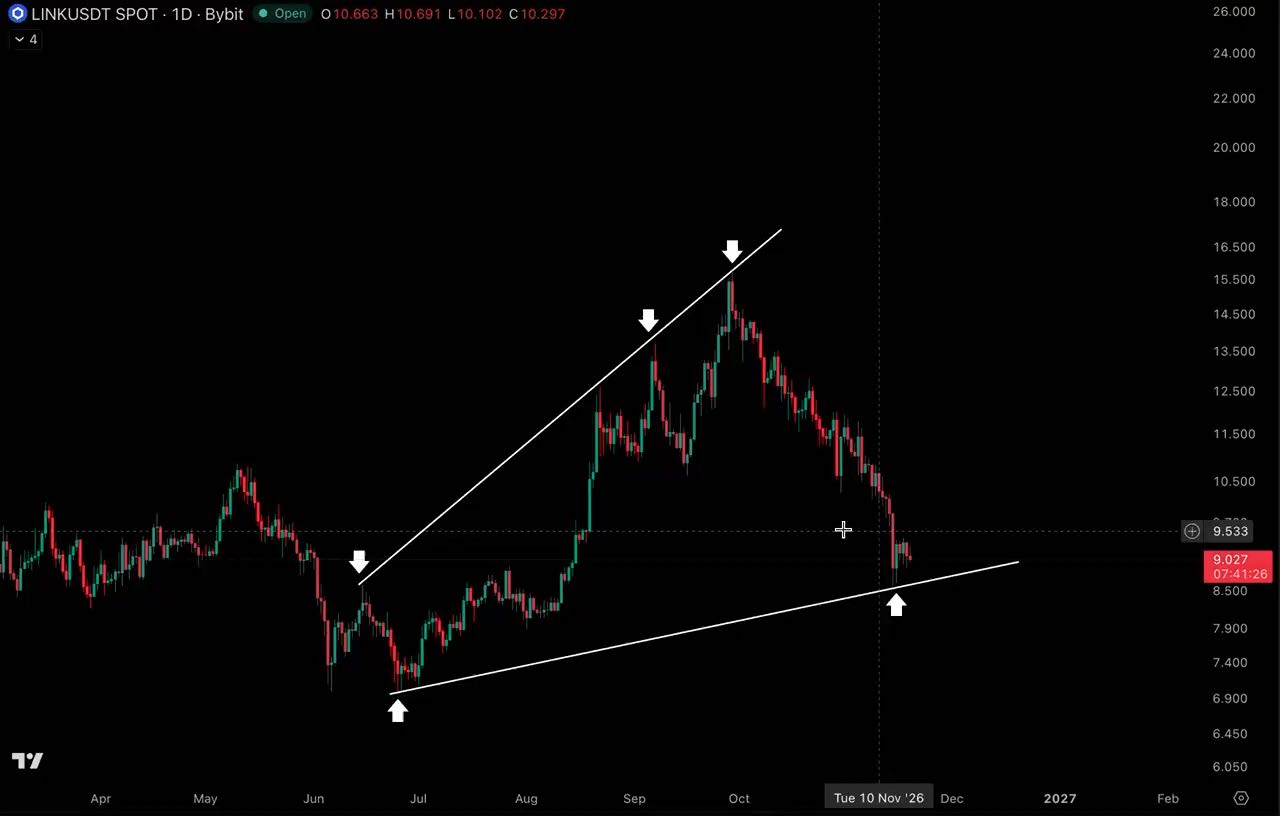
months of higher lows, multiple successful retests, and now $LINK is back at support

would be a shame for bears if buyers defend this one again
LINK-0.18%
$PIEVERSE Spotted the market makers dumping, and the very next second it plunged from 3.68 to 3.2. I was still replying to comments in the plaza and hadn’t added to my position. Fuck!!!🌿!!!
post-image
PIEVERSE+0.58%
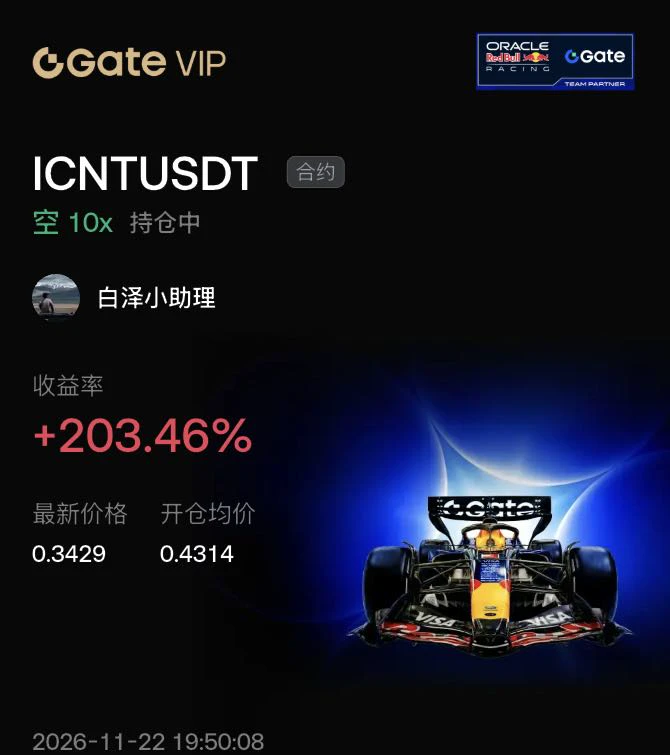
$ICNT It went live on a major European payment platform on November 17–18, and its price rose from around 0.33 to about 0.52, pushing it into the top gainers during those two days.

Your entry price is in the pullback from that peak.

It then continued lower: down 11.3% on 11/19, flat around 0.34 on the 20th and 21st, and down another 10.5% during the day today. The new users brought in by the launch were a one-off; once the hype faded, the price returned to reflecting real demand.

Today the broader market’s fear index was between 7 and 11, indicating extreme fear, and the crypto market as a
post-image
ICNT-10.47%
AKE+6.39%
  • 2
Load More

Join 40 M users in our growing community

⚡️ Join 40 M users in the crypto craze discussion

💬 Engage with your favorite top creators

👍 See what interests you

Trending Topics

BTCReboundFaces60KTest

2.1M Views30.1K Discussing

BTC rebounded from around $55,300 on November 21, briefly reclaiming $60,000 before pulling back to around $59,300. The $60K level is back in focus as traders assess whether the recovery can last. Is this rebound a sign of stabilization or a short-lived recovery? Would reclaiming and holding $60K be enough, or do you need confirmation from trading volume and fund flows?

PCEAndGDPDataNextWeek

259.5K Views2.6K Discussing

GateDirectIPOPhase3ANTAllocates92100Shares

837.2K Views5K Discussing

View More