



Share your thoughts
placeholder
Article
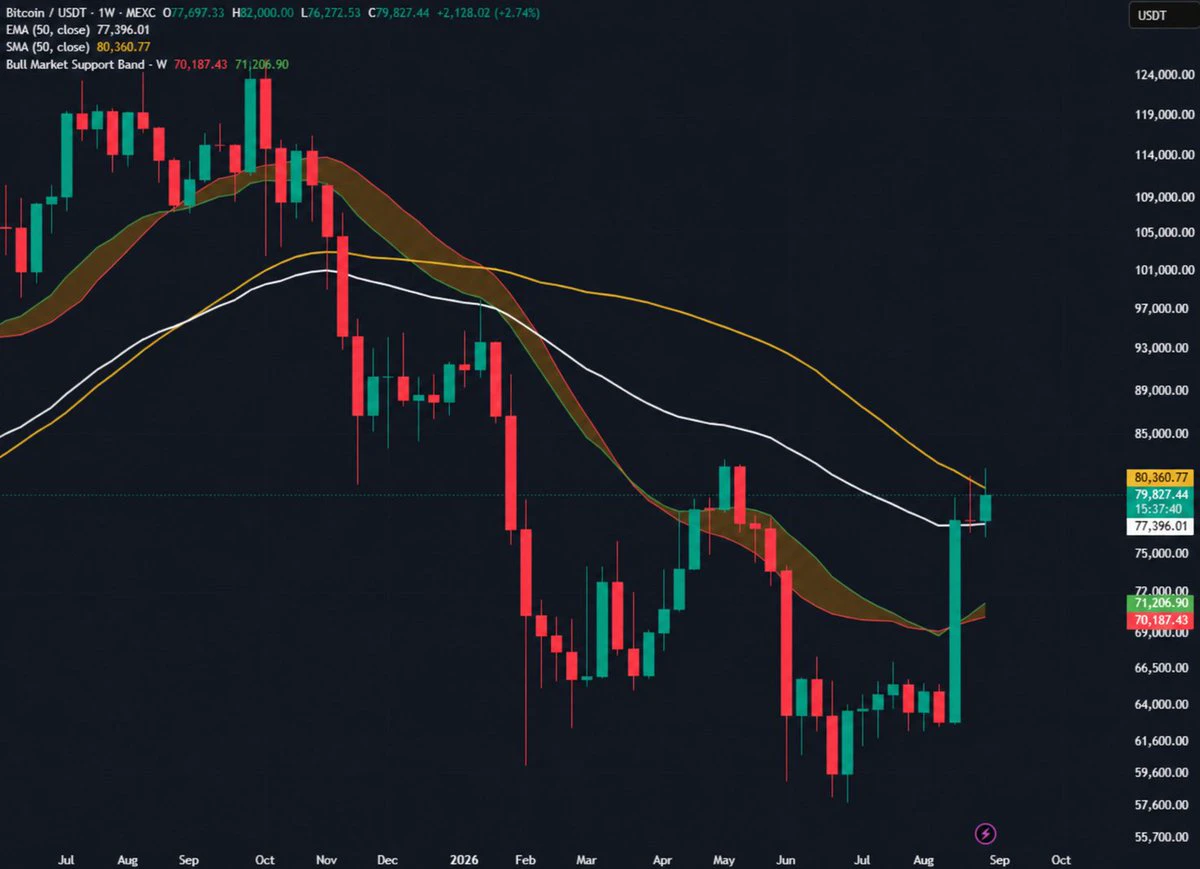
$BTC is hovering around the $80,000 level, and the next weekly close could be very important.
Bitcoin is now testing the 50-week moving average, a key level that has acted as major resistance.
If BTC can break above it and close the week above $80K, it could be a strong sign that the market has finally found its bottom.
For now, the weekly close is what matters.
post-image
BTC-0.03%
  • 3
#ALTSEASON 2026 💸
Shill me your 100x gems! 👀💎🚀
👇
post-image
GEMS+1.15%
Market update
live-cover
LIVE1,608
full bull
- but with intention & patience based on experience
Locked in bottom entries on software and crypto stocks.
Locked in bottom entries on quality alts.
Locked in bottom entries on commodities.
Traded the rh eco highly profitably, and I'm still holding potential next narrative leaders.
Shared the entire trading journey, setups, thesis work and overall market thinking, transparently on this account.
Fully focused on staying in my own lane. My trading framework is solid, my execution is unemotional and I’m completely unfazed by all the PnL screenshots. I’m in no rush to chase more money
post-image
RH+0.98%
🐋 WHALE WATCH : The G7 just issued a major warning Quantum computers are coming for $BTC encryption.
Here is the real breakdown:
=> 6.9M BTC currently sit in addresses exposing public keys
=> That includes -1.1M Satoshi coins ($80B+) at potential long term risk
=> Defense is already brewing: BIP 360 (quantum safe addresses) is live on testnet
The nuclear option to freeze unmigrated coins was already shut down. Why ? Because immutability > short term fear.
Decentralization will adapt without compromising its core principles. Are you moving your stack to quantum safe addresses when BIP 360 goe
post-image
BTC-0.03%
JUST IN: Willy Woo says Bitcoin is decoupling from U.S. stocks, a pattern similar to 2015-2017 pre-bull run. If confirmed, this could signal renewed BTC-led strength despite stock-market fragility. $BTC
post-image
BTC-0.03%
Everyone’s watching $ETH /USDT sideways—but the 4h tape is quietly loading a trapdoor.

$ETH /USDT - SHORT

Trade Plan:
Entry: 2496.36 – 2502.06
SL: 2526.56
TP1: 2478.69
TP2: 2465.02
TP3: 2444.50

Why this setup?
Why now?
- 1D trend is *range*, not bull—so rallies are sellers’ gifts.
- RSI 15m at 49.23 = zero momentum, just waiting for direction.
- ATR 1h at 11.39 means volatility is coiled; the 2499.21 ref is the pivot.
- Short setup armed: TP1 2478.69, TP2 2465.02—risk to SL 2526.56 is only ~1% for a 1.4% move down.

Debate:
If price taps 2499.21 again, do you fade it or wait for
ETH+1.06%
【$RAYSOL Signal】Long | 4H MACD bullish expansion
$RAYSOL RSI 4H 79.52, buying demand gap.
4H MACD bullish momentum is expanding, while the 1H red bars are shortening, indicating insufficient short-term follow-through. Order book depth imbalance: -7.90%; the share of aggressive buyers is declining. OI is stable, with the funding rate at -0.0128%; shorts have not retreated.
🎯Direction: Long
⚡Entry/Limit order: 1.131495 - 1.134900
🛑Stop-loss: 1.078155
🚀Target 1: 1.220017
🚀Target 2: 1.262576
🛡️Trade management:
- Execution strategy: After reaching Target 1, reduce the position by 50% and move
post-image
BTC-0.03%
ETH+1.09%
SOL+3.00%
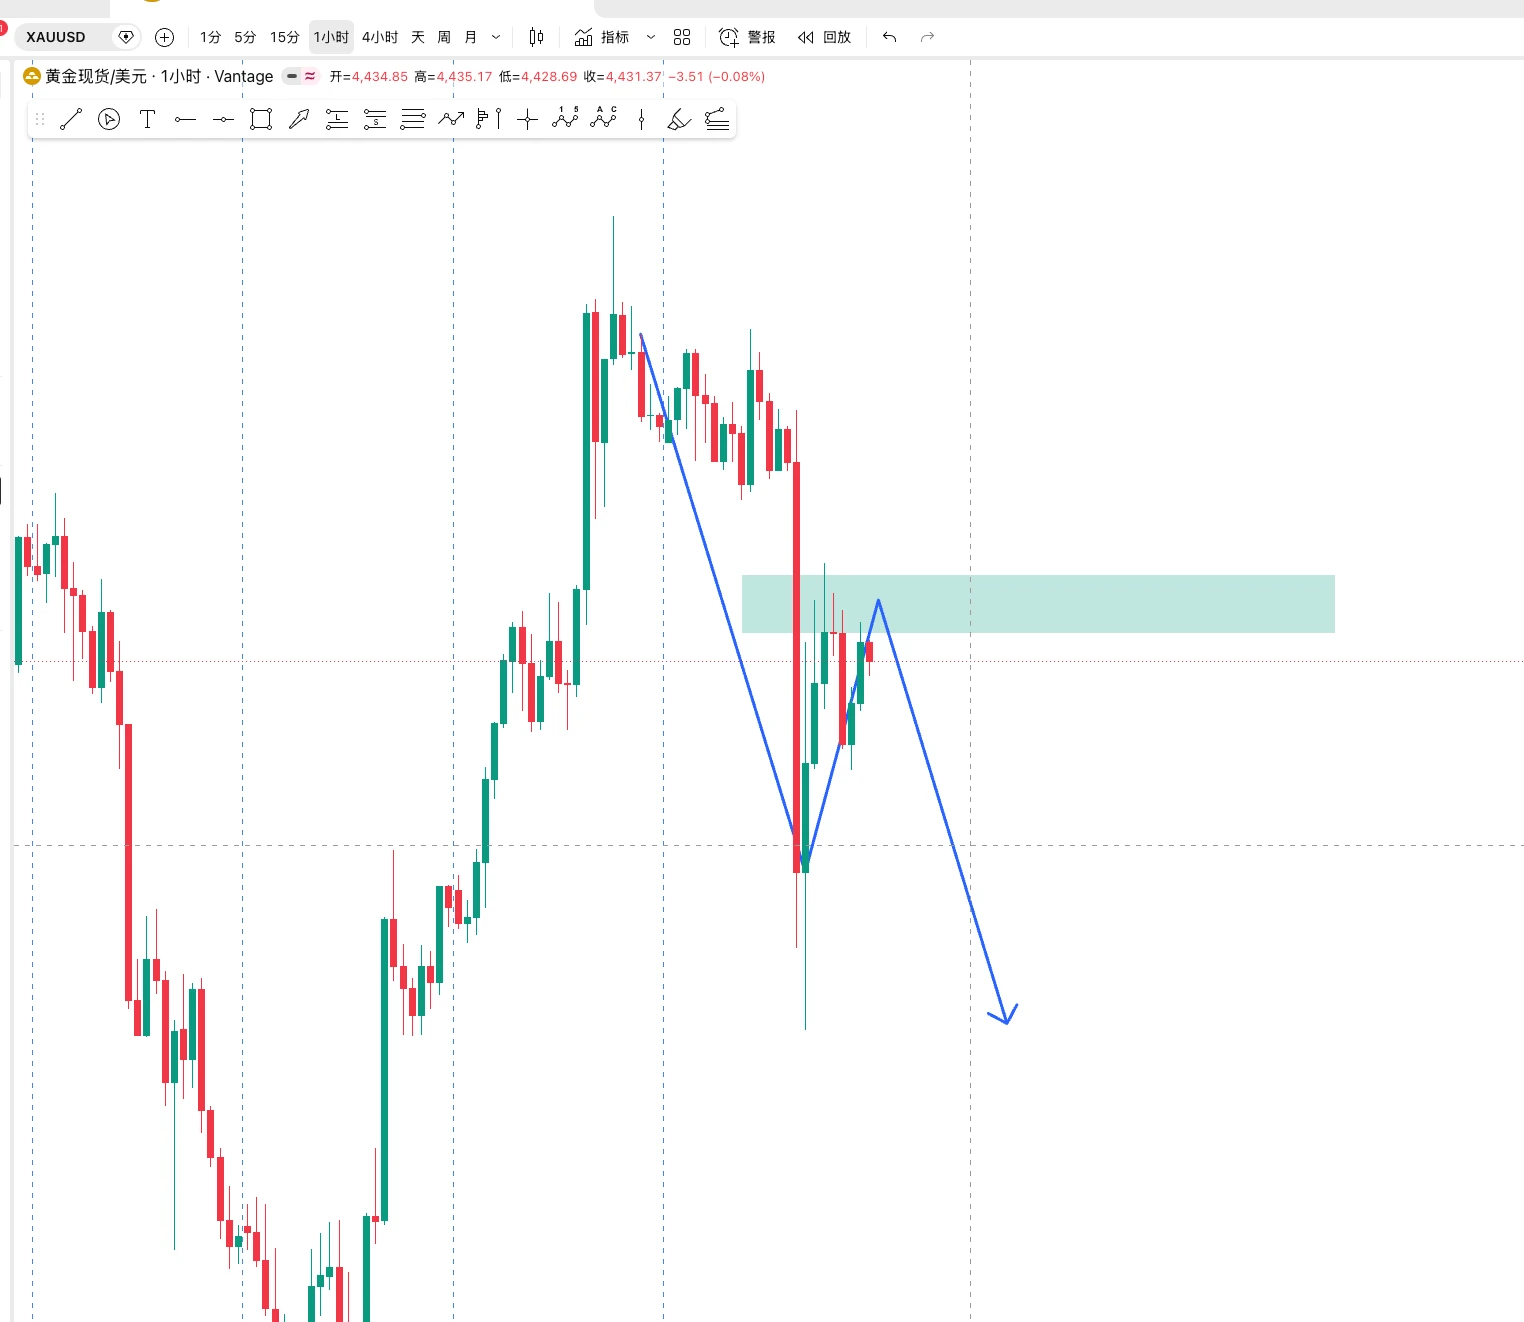
XAU gold is currently bearish
Expecting a gap at Monday’s open
The short position is already on board, waiting for the flowers to bloom
$XAUUSD
post-image
XAUUSD-0.95%
#GateEventContractTradeSharingChallenge #ZEC
Zcash (ZEC) is showing exceptionally strong momentum. With your quoted current price around $1,189, the latest market data places ZEC around $1,184, with an intraday high near $1,204 and low around $1,005. That means the 24-hour move is roughly +16–19%, depending on the exchange and exact snapshot.
The most important development is that ZEC has successfully moved above the psychological $1,000 area after breaking through a major multi-year resistance zone. Recent reports attribute the acceleration partly to a short squeeze, with roughly $13M+ in Z
ZEC+15.50%
  • 1
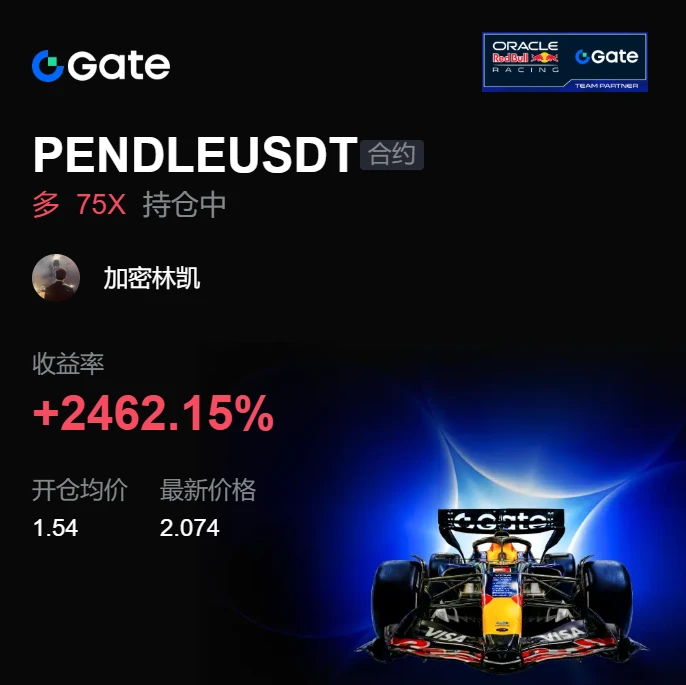
My hand trembled slightly when I set the stop-loss a few days ago, only to discover this morning that it was unnecessary filial piety.
When the screen was glowing green, I really did doubt myself, but the last thing I saw before bed was the pullback finding solid support right on cue, with volume still holding up—a textbook shakeout coming to an end.
So I went straight into a long position at the right level, with the price pinned at 1.540 and the bull-bear dividing line crystal clear. When I refreshed this morning, it had shot straight up to 2.072, with my position up +2452.93%. Watching the
post-image
SOL+3.02%
SNDK+0.68%
MARSCOIN market cap breaks through $265 million to reach a new all-time high, with a 24-hour increa
live-cover
LIVE1,463
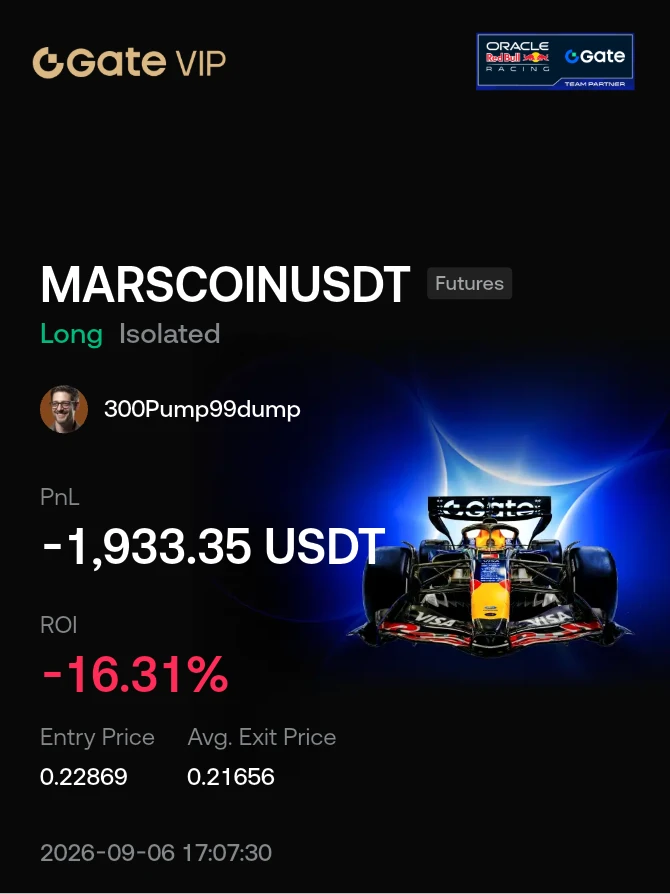
$MARSCOIN long closed by stoploss overnight.
Structure and RSI changed to bearish on higher time-frames. Guess there won't be more pumps to another ath.
Opened big short around 0.19 zone.
Waiting for a drop to 0.09.
#MARSCOIN
post-image
MARSCOIN-21.67%
Everyone’s chasing SKYAI pumps, but the 4H chart just whispered a 95% secret.

$SKYAI /USDT - SHORT

Trade Plan:
Entry: 0.05863 – 0.05919
SL: 0.06161
TP1: 0.05688
TP2: 0.05554
TP3: 0.05351

Why this setup?
- The 1D trend is bearish, and our 4H bias flips SHORT with 95% confidence—this isn’t a guess, it’s a freight train.
- RSI on the 15m sits at 49.54—neutral, but that’s the calm before the breakdown, not a bounce signal.
- Entry zone: 0.05891–0.05919. If we lose 0.05865, the invalidation triggers—but until then, TP1 at 0.05688 is the first exit ramp, TP2 at 0.05554 is the real money.
SKYAI+0.89%
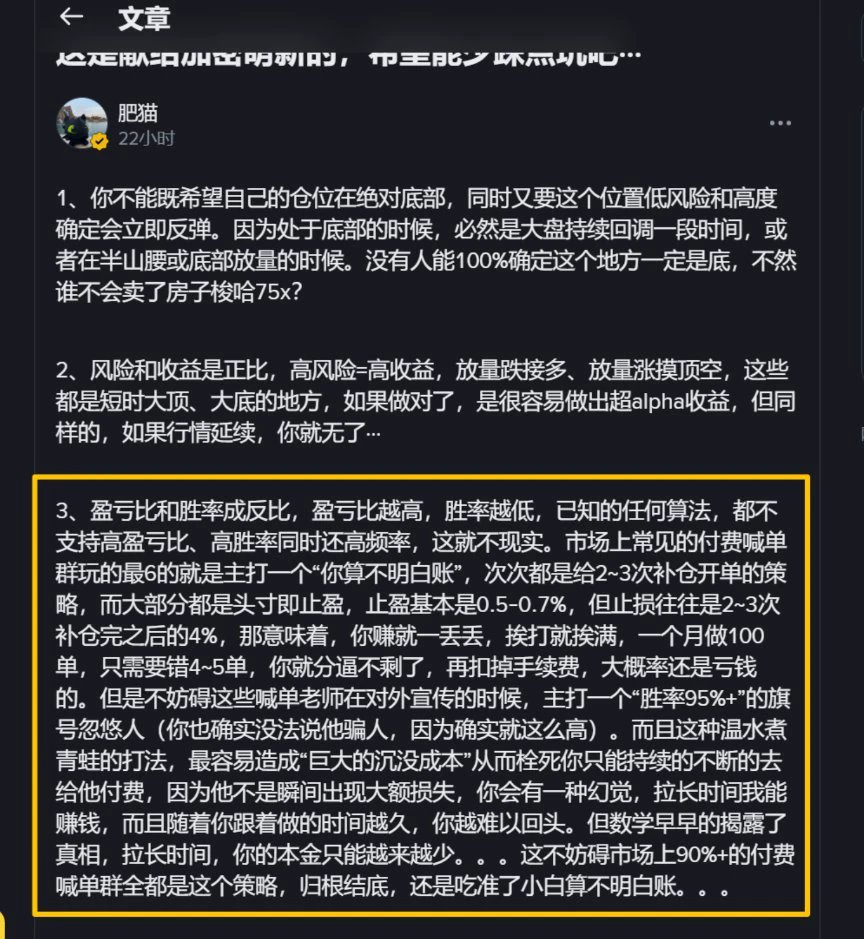
What I posted yesterday is indeed something many beginners just can’t figure out··· Let’s put it in more straightforward terms···
For example, with a 95% win rate, and a stop-loss on every trade, does that mean he is guaranteed to make money?
Not necessarily, absolutely not··· If you see someone constantly emphasizing their win rate while never mentioning their risk-reward ratio, you should basically steer clear···
Using the simplest calculation, suppose every trade is 100u at 100x leverage, with the take-profit set by default at 0.5–0.7%. Then the profit from each take-profit trade is 5
post-image
4-12.88%
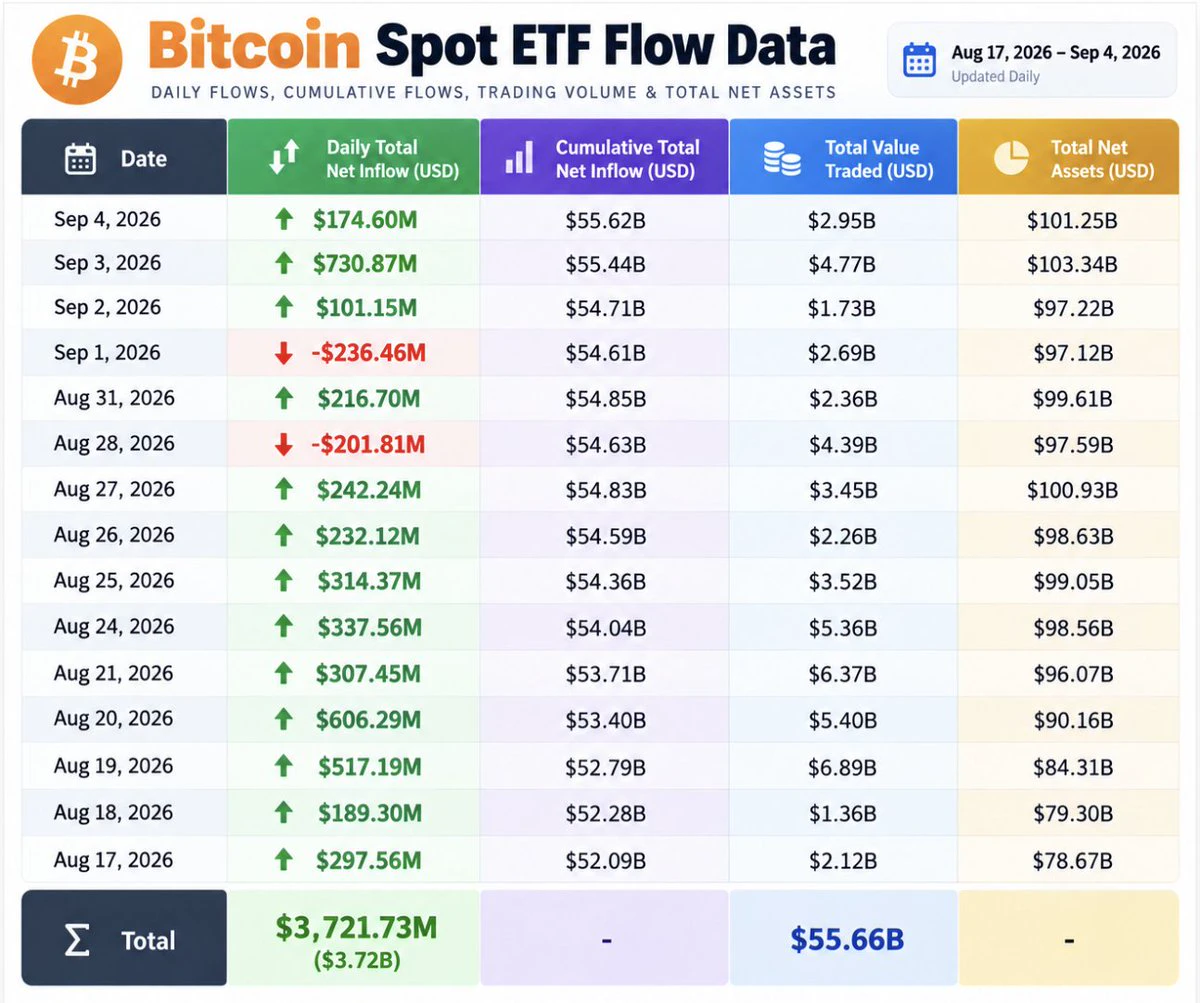
bitcoin:native INSTITUTIONAL MONEY IS F**KING BACK!
🇺🇸 Bitcoin ETFs $3.72B Net Inflows + $55.66B Traded in just the last 15 trading days. Showing strong demand and bullish momentum!
post-image
BTC-2.35%
🔥 Which Memes are heating up fast in this wave?
$MARSCOIN , $USELESS , $PONS , $BASECAT , and $牛来 have been active recently, with new and established Meme hotspots taking turns leading the market.
From hundredfold narratives to new-chain Memes, and from established favorites to market newcomers,
opportunities in the Meme market often lie in the next rotation of hotspots.
Hot Memes, all on Gate Futures
Join the Robinhood Meme frenzy now: New users get 3 USDT on their first order, and trading rewards can reach up to 8,000 USDThttps://www.gate.com/announcements/article/101528
MARSCOIN-21.67%
USELESS-16.02%
PONS-8.78%
BASECAT-9.13%
牛来-17.77%
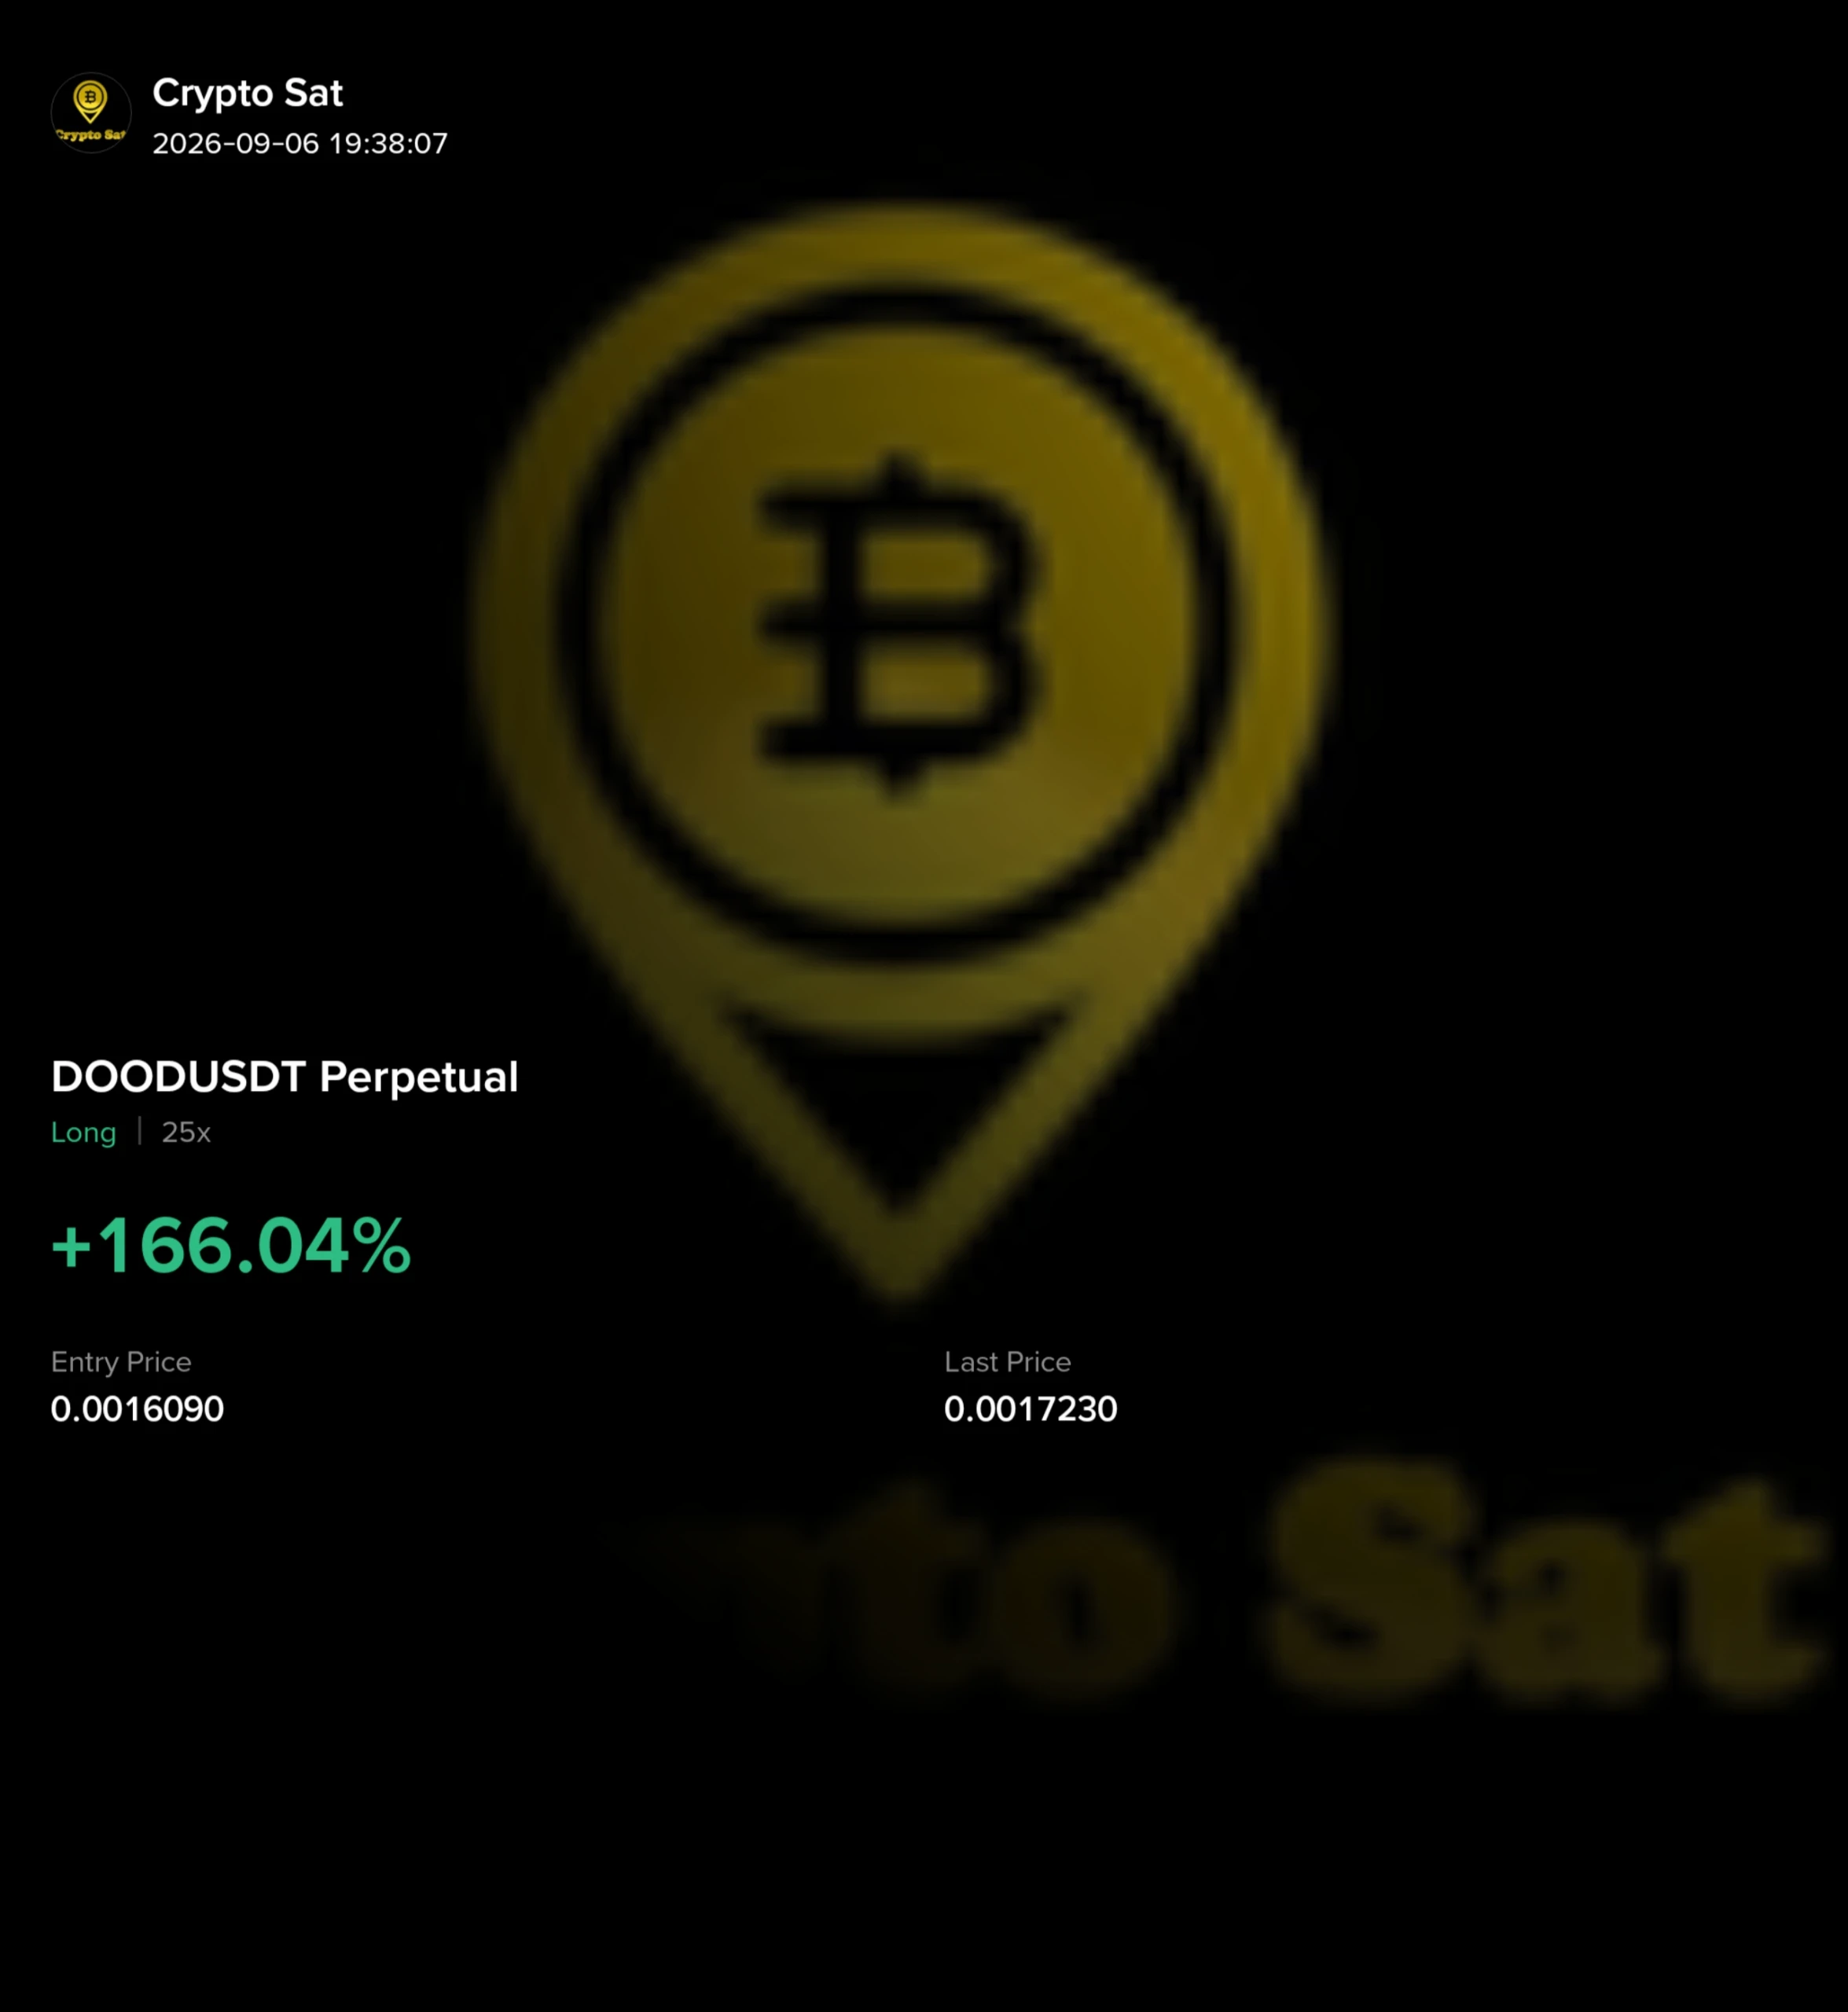
$DOOD 2nd target done 🎯
Set your stop-loss at Target 1 once TP3 is achieved 😉
post-image
Original content no longer visible
DOOD+18.53%
Nobody's watching PEPE's 15-minute RSI bleed—that's exactly when the trap springs.

$PEPE /USDT - SHORT

Trade Plan:
Entry: 0 – 0
SL: 0
TP1: 0
TP2: 0
TP3: 0

Why this setup?
- 4h bias flips SHORT at 55% conviction while 1D stays range—mean reversion is the play.
- RSI(15m) at 41.98 shows momentum fading *before* price breaks—early warning, not lagging.
- Range-bound 1D + short-term weakness = sell the rip, not the dump.
- Why now? The "Armed" status means the setup is live, not theoretical.

Debate:
If PEPE dips below yesterday's low but RSI stays above 35, are you fading the short o
PEPE+0.25%
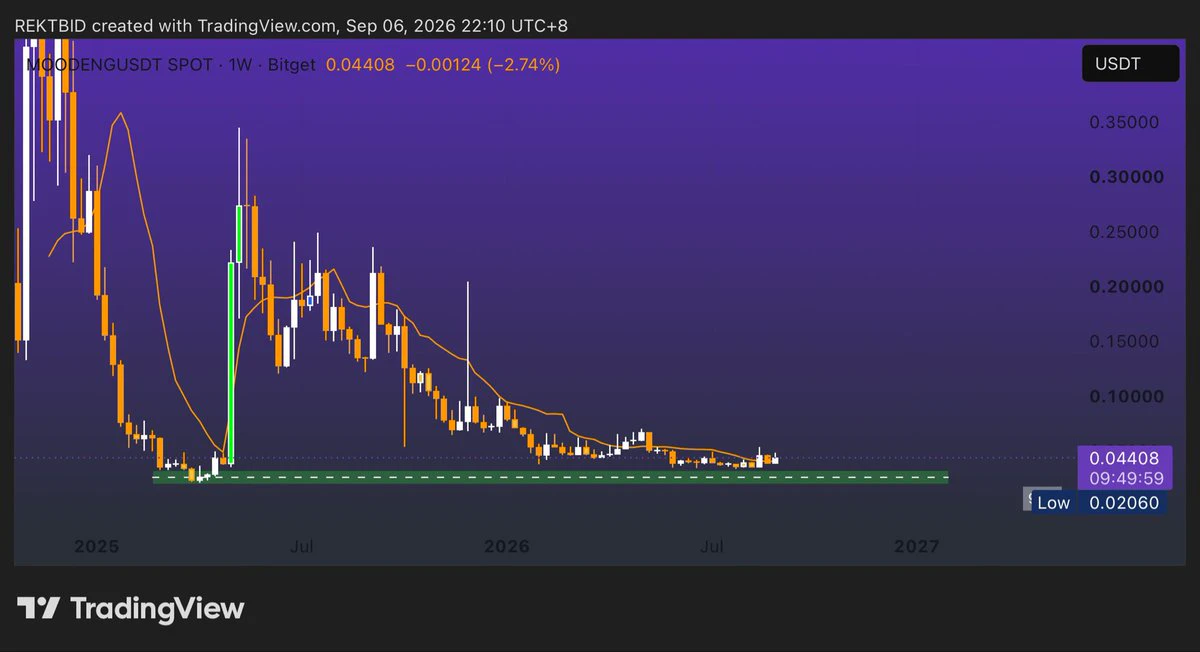
$MOODENG looking good above weekly rvwap here for long
post-image
MOODENG+4.04%
Load More

Join 40 M users in our growing community

⚡️ Join 40 M users in the crypto craze discussion

💬 Engage with your favorite top creators

👍 See what interests you

View More