Share your thoughts
placeholder
Article
#SenateReleasesNewCLARITYAct
The Senate is about to take its first real procedural test on the CLARITY Act. On September 15 the chamber votes on cloture for the motion to proceed. That step requires 60 votes. Republicans hold 53 seats, so at least seven Democrats have to cross over if every Republican stays on board. Right now those Democratic votes are not locked in.
The latest 630-page text that Republicans released last week makes some adjustments on DeFi and credit unions. Protocols that are decentralized in name only but still controlled by identifiable parties would need to register wit
No vision, can’t hold on—the profits on this move are paper-thin, but I love it to death.

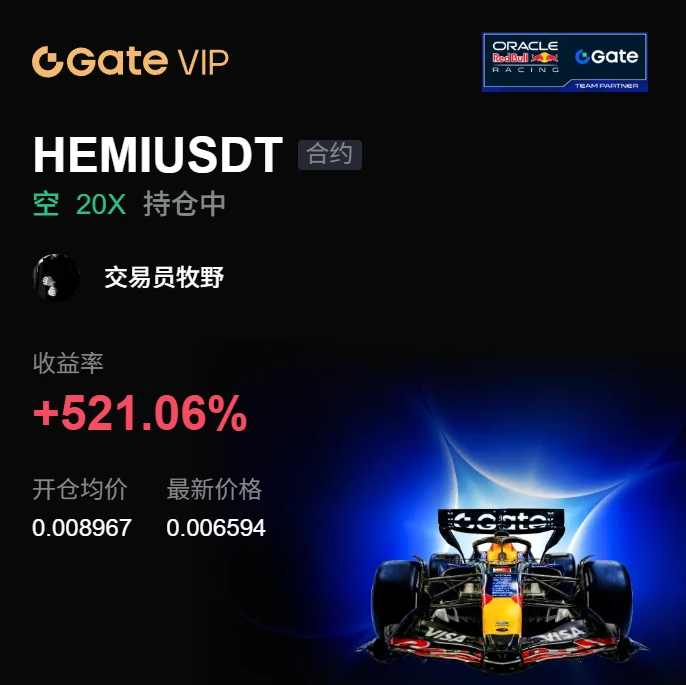
When the market was grinding out a bottom intraday, I said that blindly chasing longs was the easiest way to end up doing pointless work. $HEMI It pushed toward the highs several times in a row but failed to hold, with volume shrinking each time and the buying support visibly weakening. It was clearly a bull-trap script, yet some people insisted it was the prelude to a breakout. I couldn’t be bothered to argue and directly placed a short order at 0.008967. I just took a glance, and the price has already
post-image
HEMI-2.59%
DOGE-1.51%
BNB-2.64%
#CoinDeskRevealsGateRWAPerpetualsTop3Globally
CoinDesk Reports Gate Among the Global Top 3 for RWA Perpetual Trading
The Real-World Asset (RWA) derivatives market is rapidly becoming one of the most interesting areas at the intersection of traditional finance and crypto.
According to the market coverage referenced in this narrative, Gate ranked among the global top three exchanges for RWA perpetual trading, with reported August trading volume of approximately $64.7B–$64.8B.
Even more notable is the reported ~158% month-over-month growth.
For me, the most important number is not simply the $64.
BTC-0.79%
ETH-1.93%
NDAQ-0.64%
INDEX-2.10%
On September 13, the U.S. Producer Price Index (PPI) for August rose 5.4% year-on-year, while the Consumer Price Index (CPI) for August came in at 3.4% year-on-year, with core CPI increasing 0.3% month-on-month. As a result, pricing in the interest rate swap market for a Federal Reserve rate hike next week rose to approximately 90%, and the three major U.S. stock indexes retreated from their highs throughout the week. (Jinshi)$XAUAUD
XAUAUD+0.54%
$AAPL
Apple Inc. shares ended the trading week on a strong note, closing at $332.27 (+1.75% for the day).
After a local pullback to $320, buyers seized the initiative, confirming the strength of the long-term uptrend.
Brief technical analysis:
Trend structure: A sustained bullish bias remains on the chart.
Key moving averages (20, 50, and 200 EMA) are pointing upward. Holding the $320–$321 zone paved the way for a local assault on resistance levels.
Breakout of $330:
A firm close above the psychological $330 level activated the bullish scenario. The nearest medium-term target for buyers i
AAPL+1.71%
Can I get a GM?
Say it back
post-image
#晒出我的持仓收益 CME FedWatch data shows that the probability of the Federal Reserve raising rates by 25 basis points in September has reached 89%, more than doubling from 38% before the Jackson Hole global central bank symposium at the end of August, while there is only an 11% probability of keeping the current target rate range unchanged. Meanwhile, the market has begun pricing in a potential path toward a second rate hike this year, with tightening expectations continuing to build. Economic fundamentals provide core support for a rate hike. On the inflation front, U.S. August inflation data releas
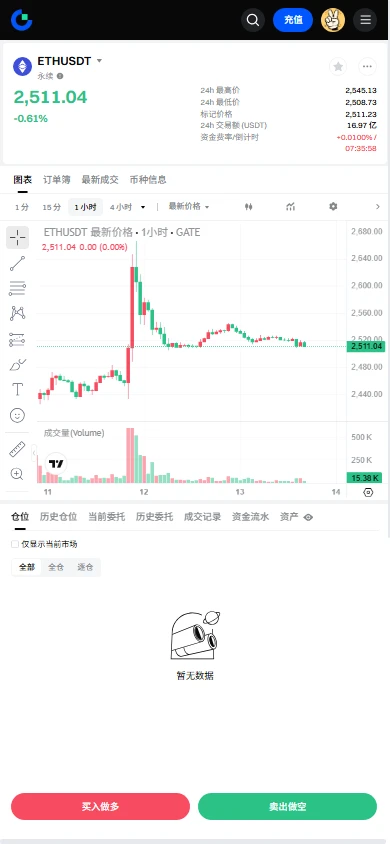
$ETH Signal】Long + 1H lower-band retest/order-book support
$ETH 1H retesting the lower band, 2509.64, RSI 41.80, with price pressing toward 2507.53 and 4H EMA20 at 2506.17 close by. The order-book depth ratio is 3.94, with strong bids below. Funding rate 0.0049%, OI stable. 1H MACD bearish bars expanding, while 4H bullish bars are shortening. Risk-reward ratio 1.50; the stop-loss distance is acceptable, but position size should be kept under control.
🎯Direction: Long
⚡Entry/Limit order: 2502.1111 - 2509.6400
🛑Stop-loss: 2455.0165
🚀Target 1: 2591.5753
🚀Target 2: 2632.5430
🛡️Trade manageme
post-image
ETH-1.91%
BTC-0.79%
SOL-2.17%
Gate Futures New Listing: $EMBER
🔹 Trading pair: $EMBER / $USDT
🔹 Trading time: Now open
🔹 Supports 1 - 10x leverage, trading bots, and copy trading. Can memes even pair up with stocks? $EMBER Really knows how to play
🔥 Trade $EMBER: https://www.gate.com/zh/futures/USDT/EMBER_USDT
More details: https://www.gate.com/zh/announcements/article/101710

GateLaunch
Gate Futures New Listing: $EMBER
🔹 Trading pair: $EMBER / $USDT
🔹 Trading time: Now open
🔹 Supports 1 - 10x leverage, trading bots, and copy trading. Can memes even pair up with stocks? $EMBER Really knows how to play
🔥 Trade $EMBER: https://www.gate.com/zh/futures/USDT/EMBER_USDT
More details: https://www.gate.com/zh/announcements/article/101710

repost-content-media
EMBER+29.11%
  • 3
Good Morning Frens!🌤☕️ Happy Sunday everyone!
post-image
By day I was cursing the damn market makers; by night, my short position had already grown into a money tree.

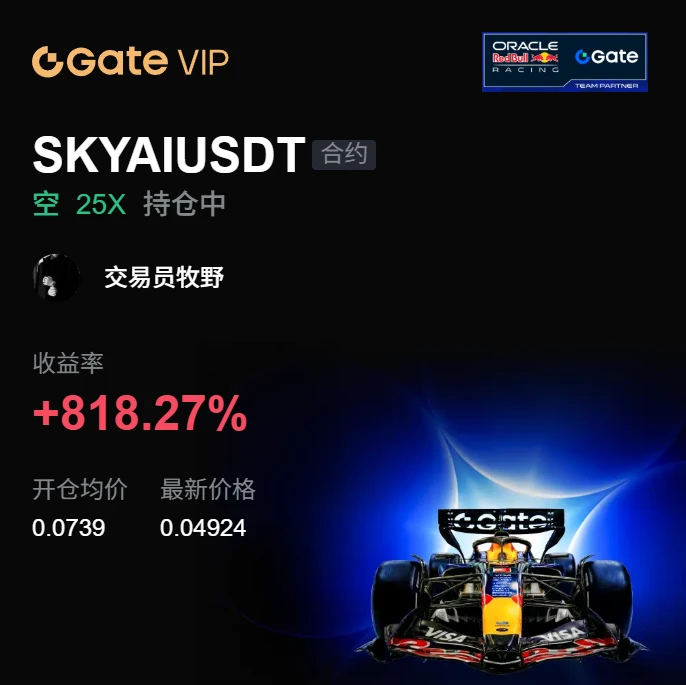
When the screen was glowing green, I didn't rush to act. After watching for more than ten minutes, I realized $SKYAI wasn't an unjustified sell-off—there simply weren't any buyers below. It tried to rebound, but the volume failed to come in, and then it rolled over again. This kind of market doesn't require sophisticated analysis; just wait for it to show weakness. I opened a short around 0.07390 with the trend, without taking a heavy position or making any unnecessary moves. I just
post-image
SKYAI-4.16%
BNB-2.64%
BTC-0.79%
It only took a bathroom break, and when I came back, the candlestick chart had already wiped out my losses for me.

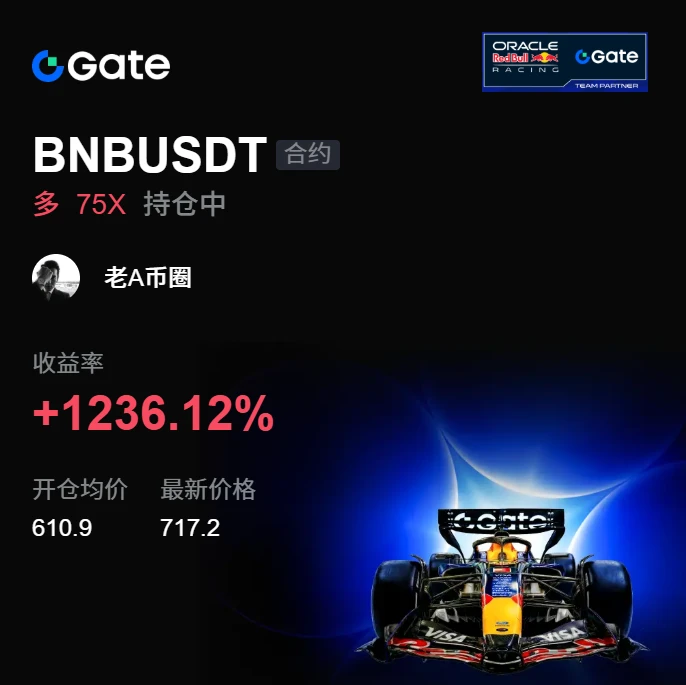
A few days ago in the early morning, when $BNB pulled back, the key level of 610.90 held, and buyers kept stepping in. I only gave one reminder at the time: don’t panic-sell, go long.

Now at 717.25, with +1236.12% secured. It was truly sluggish at first, but once it moved, it was truly sweet.

The market is waited out, and profits are held onto.

Being out of the market isn’t a sin; opening positions recklessly is the mistake.

First take profit on 80%, move the remaining
post-image
BNB-2.64%
DOGE-1.51%
ZEC-5.86%
$LAB /USDT is quietly building a bearish setup that most traders are still ignoring.

$LAB /USDT - SHORT

Trade Plan:
Entry: 0.06607 – 0.06805
SL: 0.07656
TP1: 0.05994
TP2: 0.05519
TP3: 0.04806

Why this setup?
Why now? The daily trend has been bearish for a while, and the 1h RSI at 45.88 shows weakening momentum without yet hitting oversold, which favors continuation downward. The 1h ATR of 0.003958 tells us volatility is compressed enough that a decisive move can quickly sweep the entry zone of 0.06706, where the 1h price sits. The plan targets TP1 at 0.05994 and TP2 at 0.05519, while the
LAB-8.26%
  • 1
#OracleQ1EarningsBeatStockUpOver5% 🚀 Oracle Q1 earnings beat expectations, sending the stock up more than 5%!
The strong results highlight continued demand for Oracle’s cloud and AI-related services. Investors are watching closely as the company expands its position in the rapidly growing AI infrastructure market.
📈 Strong earnings + AI momentum = renewed investor confidence.
#Oracle #ORCL #Earnings #AI
ORCL-1.87%
Market prediction
live-cover
LIVE1,542
Everyone is calling $CL /USDT a range, but the 1h data says otherwise.

$CL /USDT - SHORT

Trade Plan:
Entry: 96.23 – 96.39
SL: 97.11
TP1: 95.71
TP2: 95.30
TP3: 94.70

Why this setup?
Why now? The 1h price is sitting at 96.31 right at the entry zone of 96.23 to 96.39, which means the market is pausing exactly where a short setup wants to begin. The 15m RSI is reading 64.01, showing momentum is still leaning bullish enough to trap longs before the daily range resumes its grind lower. The 1h ATR of 0.33504 tells us the current volatility is compact, so a break from 96.31 can move fast toward
CL+0.67%
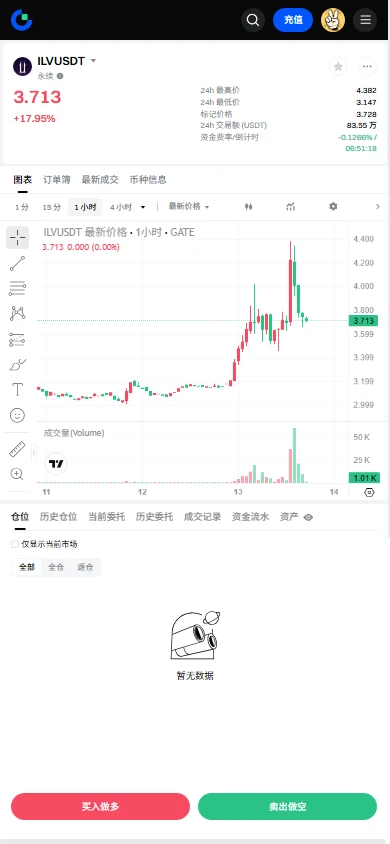
$ILV Signal】Long + 1H pullback confirmation/negative funding short squeeze
$ILV 1H-level pullback confirmed, 4H RSI 74.48, 1H RSI 55.70, momentum shifting down, price holding above the 1H EMA20 at 3.6537, negative funding at -0.0216%, OI stable. 4H MACD bullish histogram contracting, 1H MACD bullish histogram contracting, 1H Bollinger upper band at 4.1182, order book depth neutral, buy/sell ratio 1.00. The risk-reward ratio in this range is 1.50; chasing the price would have slippage eat into profits, so placing orders on a pullback is more reasonable.
🎯 Direction: Long
⚡ Entry/Limit order
post-image
ILV+15.68%
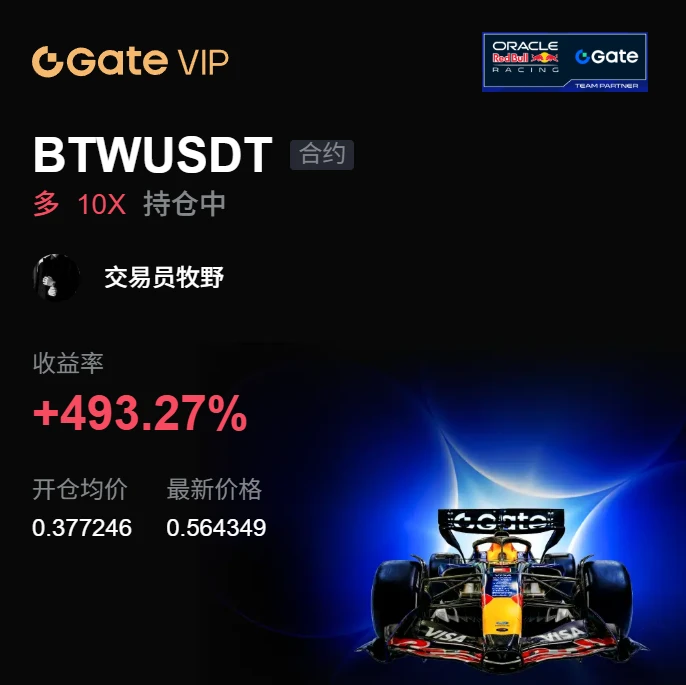
This trend doesn’t even require me to think—the account is partying on its own. While the market was bottoming out intraday, $BTW repeatedly held above 0.377246. I watched it for a few minutes: the key level held, buying pressure was still strengthening, and it was obvious someone was using the volatility to accumulate. My only judgment at the time was: a pullback is an entry opportunity, not a signal to run.

The market is waited out, and profits are held onto.

Later, the candlesticks slowly started climbing, and just now they touched 0.564054 directly, bringing the position return to +49
post-image
BTW+6.35%
SNDK-2.96%
BNB-2.64%
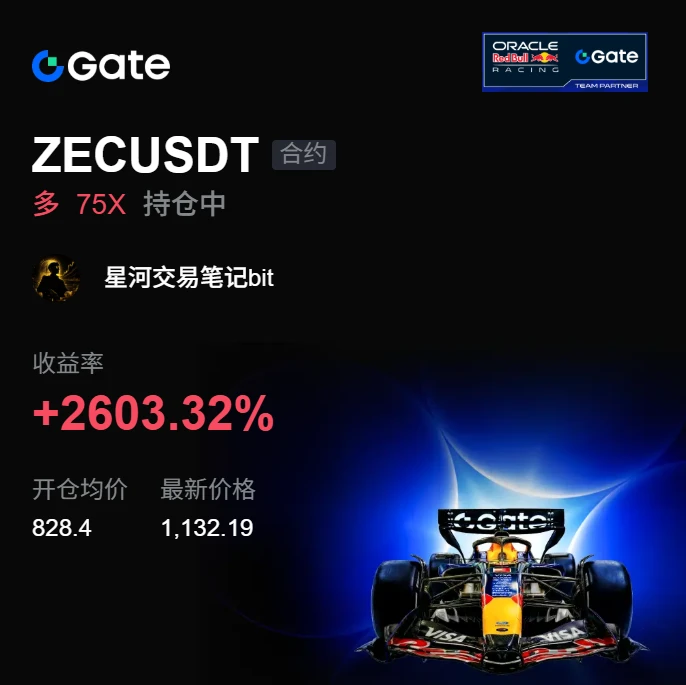
For this $ZEC long position, I took profit on 70% around 1132.64 first. It’s not that I’m no longer bullish, but profit-taking has started near the previous high, and trading volume has not continued to expand, so holding the full position no longer offers a particularly good risk-reward ratio.

At entry, I was looking for a pullback confirmation after the breakout. The key level around 828.40 held repeatedly, and the pullback came with declining volume, so I was willing to go long with the structure. With floating gains of +2607.26% so far, I’m locking in most of the profit first, while the
post-image
ZEC-5.86%
SOL-2.17%
ETH-1.91%
Load More

Join 40 M users in our growing community

⚡️ Join 40 M users in the crypto craze discussion

💬 Engage with your favorite top creators

👍 See what interests you