Square
Following
Hot
News
Profile

Syeda

vip
Peak Tier 5
Market Analyst
Analyze the market with precision turning moments into profit and always one step ahead
9
Following
1.7k
Followers
8.1k
Liked
🚀 National Day New Stars Set Sail | Watch livestreams to earn points, interact to win great rewards!
Join Gate's social campaign and complete interactive tasks such as watching livestreams, liking, commenting, and sharing to accumulate points.
🎁 Reach the points threshold to unlock USDT cash rewards
🍀 Reach 100 points for a chance to become a lucky winner and win a Gate limited-edition merchandise gift box
🏆 New and existing creators can participate in the creator leaderboard—post and livestream to climb the rankings and win GT rewards!
⏰ Campaign period: September 28, 14:00—October 19, 23
GateLiveChinese
🚀 National Day New Stars Set Sail | Watch livestreams to earn points, interact to win great rewards!
Join Gate's social campaign and complete interactive tasks such as watching livestreams, liking, commenting, and sharing to accumulate points.
🎁 Reach the points threshold to unlock USDT cash rewards
🍀 Reach 100 points for a chance to become a lucky winner and win a Gate limited-edition merchandise gift box
🏆 New and existing creators can participate in the creator leaderboard—post and livestream to climb the rankings and win GT rewards!
⏰ Campaign period: September 28, 14:00—October 19, 23:59
Join now 👉 https://www.gate.com/campaigns/6434
‍#Gate #GT #GateLive
repost-content-media
GT+0.18%
#GTBurnsNearly2MTokensInQ3
GateToken's Q3 was a statement. Not a headline that flashes and disappears, but a structural milestone that quietly reshapes the asset's long-term story. Over the course of July, August, and September, Gate permanently removed more than 2 million GT tokens from circulation. These tokens did not move to another wallet, they were not locked, and they were not reserved for some future program. They were destroyed forever — burned on-chain, taken out of the supply equation permanently, and removed from the market in a way that can never be reversed.
To understand why th
HighAmbition
#GTBurnsNearly2MTokensInQ3
GateToken's Q3 was a statement. Not a headline that flashes and disappears, but a structural milestone that quietly reshapes the asset's long-term story. Over the course of July, August, and September, Gate permanently removed more than 2 million GT tokens from circulation. These tokens did not move to another wallet, they were not locked, and they were not reserved for some future program. They were destroyed forever — burned on-chain, taken out of the supply equation permanently, and removed from the market in a way that can never be reversed.
To understand why this matters, you have to understand what a burn actually does. A token's price is ultimately a conversation between supply and demand. When the circulating supply shrinks, and demand either stays the same or grows, the same amount of buying pressure is now spread across fewer tokens. That is the textbook definition of scarcity, and scarcity is one of the most powerful forces in any market. It is not a promise of a price move, but it is a fundamental tightening of the asset's economics — and that tightening is exactly what long-term holders pay attention to.
And here is the part that makes GT different: this was never a one-off gimmick. Gate runs a programmatic, quarterly buyback-and-burn engine that is funded directly by a meaningful share of the platform's quarterly trading profits. That means the burn is not an arbitrary marketing event. It is tied to real business performance, real trading activity, and real revenue. As the exchange grows, the buyback pressure grows with it. This is a self-reinforcing loop that most tokens simply do not have. It is the difference between a token that says it is deflationary and a token that actually is.
The cumulative picture is even more striking. Through this disciplined, quarter-after-quarter execution, Gate has now burned more than 63 percent of GT's original supply. Let that sink in for a moment. More than six out of every ten tokens that were originally in the supply plan are now gone forever, sitting in a burn address that can never spend them. GT's maximum supply is capped at 300 million, and the circulating supply has been driven down through consistent, verifiable destruction. Very few major exchange tokens can point to a deflationary record this aggressive and this consistent.
Now let us zoom into the present. GT is trading right around the 11.13 dollar level, holding a constructive position after a positive week that saw it move roughly 2.5 percent higher. The 24-hour action is calm and slightly green, which in the context of a deflationary asset is often more meaningful than a violent pump — because it signals steady accumulation rather than a speculative spike. The Relative Strength Index is sitting near 52, right in a healthy neutral zone. That means GT is neither overheated nor oversold; it has room to work without the kind of froth that tends to invite sharp corrections.
The derivatives market tells a similar story of quiet strength. Open interest is sitting around 1.5 million dollars, and the taker buy-to-sell ratio is tilted toward the buy side. In plain English, that means the people actively trading GT right now are slightly more eager to buy than to sell. Combined with shrinking supply, that kind of buying bias is exactly the setup that draws attention from traders who watch order flow and positioning. Volume is not exploding in a chaotic way — it is building in a deliberate, sustainable way, and that is the kind of attention an asset wants.
This is where the narrative gets genuinely compelling. GT is not just a token that gets burned. It is a token that earns its place through real utility across the entire Gate ecosystem, and that utility is expanding faster than ever. Holders receive trading fee discounts that reduce their cost of active trading. Higher-tier holders unlock VIP benefits that make the platform more rewarding to use. GT can be staked to earn rewards, turning a simple holding into a productive asset. For the patient, HODLing GT is not a passive gamble — it is participation in a platform that is actively growing its own token's scarcity.
The technical foundations run even deeper. GT serves as the gas token on GateChain and within the Gate Layer ecosystem, which means it is not merely a loyalty point — it is the fuel that powers transactions and infrastructure. And as Gate pushes aggressively into AI and Web3 infrastructure, GT's role is expanding into new territory. AI agents and decentralized applications on Gate Layer are increasingly designed to use GT as their native gas, which adds an entirely new demand vector that most exchange tokens can only dream of.
Gate's flagship products are reinforcing this momentum. Gate Perp DEX brings decentralized perpetual trading into the fold with GT utility baked into the experience. New product launches continue to deepen the ways GT is used, earned, and held. Every one of these integrations increases the surface area of GT's utility, and every increase in utility makes the shrinking supply even more meaningful. Supply down, utility up — that is the entire thesis in two short phrases.
The result is a token with an unusually clean narrative. Most assets force you to choose between a compelling story and hard fundamentals. GT gives you both. On the fundamentals side, you have a hard supply cap, a proven quarterly burn mechanism, more than 63 percent of supply already destroyed, and a buyback engine funded by real trading profits. On the story side, you have an ecosystem that is expanding into AI, Web3 infrastructure, decentralized derivatives, and a gas-token role that goes far beyond a simple loyalty scheme.
None of this is a guarantee of future price performance, and anyone who tells you otherwise is not being honest with you. Markets are unpredictable, and even the strongest fundamentals can be overwhelmed by short-term sentiment. But what you can look at — clearly and verifiably — is the direction of the mechanics. Supply is moving in one direction: down. Utility is moving in the other direction: up. When those two curves cross in an asset with real liquidity and real users, the market tends to pay attention, and that is precisely what we are watching unfold with GT.
For anyone already inside the Gate ecosystem, this is a moment to recognize what you are holding. GT is not just a speculative ticker. It is the backbone token of a platform that is methodically, quarter after quarter, making its own asset scarcer and more useful. The Q3 burn is not the end of a story — it is the latest chapter in a multi-year deflationary program that shows no signs of slowing down. If anything, the cadence is accelerating as the platform's revenue grows and its product surface expands.
So when people ask what Gate is doing for GT, the honest answer is: a lot more than most people realize. It is buying back tokens from its own profits. It is burning them permanently. It is expanding staking, fee benefits, and VIP rewards for holders. It is building the gas-token infrastructure that makes GT essential to a growing blockchain and AI ecosystem. It is launching products that deepen real demand. And it is doing all of this consistently, transparently, and on-chain where anyone can verify it.
That combination — real scarcity, real utility, and real execution — is rare in this market. It is why GT deserves more than a passing glance. It is why the Q3 burn is worth talking about, worth understanding, and worth remembering. Because in a market full of tokens that promise everything and deliver nothing, GT is quietly doing the opposite: delivering quarter after quarter, and letting the fundamentals speak for themselves.
This is not financial advice. Always do your own research, understand your own risk tolerance, and never invest more than you can afford to lose. But if you are looking for a token where the supply story, the utility story, and the execution story all point in the same direction, GateToken is one of the clearest examples you will find — and the Q3 burn is just the latest proof.
#NvidiaHitsRecordHigh
NVIDIA JUST MADE HISTORY — AND THE AI BULL CASE IS GETTING STRONGER
Nvidia has once again reminded the market why it remains the undisputed leader of the artificial-intelligence revolution. On Friday, October 2, 2026, Nvidia broke through its previous ceiling and printed a fresh all-time intraday high of $237.87, marking its first new record since mid-May. The stock then experienced some afternoon profit-taking but still finished the session at $233.95, gaining $3.09 or 1.34% on the day. More importantly, around 109 million shares changed hands, representing roughly $25.
HighAmbition
#NvidiaHitsRecordHigh
NVIDIA JUST MADE HISTORY — AND THE AI BULL CASE IS GETTING STRONGER
Nvidia has once again reminded the market why it remains the undisputed leader of the artificial-intelligence revolution. On Friday, October 2, 2026, Nvidia broke through its previous ceiling and printed a fresh all-time intraday high of $237.87, marking its first new record since mid-May. The stock then experienced some afternoon profit-taking but still finished the session at $233.95, gaining $3.09 or 1.34% on the day. More importantly, around 109 million shares changed hands, representing roughly $25.7 billion in trading turnover. For me, this is not simply another record print; it is a major confirmation that institutional demand remains powerful enough to absorb profit-taking near historic levels.
The scale of this move becomes even more impressive when we look at Nvidia's broader price structure. The stock's 52-week range now stretches from approximately $164.27 at the March 30, 2026 low to $237.87 at the latest record high, meaning the stock has gained roughly 44.8% from that low to the peak. On a closing-price basis, the advance is still around 42.4%.
$NVDA ‌Compared with the $186.49 closing level at the beginning of the year, Nvidia has gained approximately 27.6% at the record peak. With a market capitalization around $5.7 trillion, Nvidia is operating at a scale rarely seen in the history of public markets, yet the stock continues to attract fresh capital because investors are pricing in the extraordinary earnings power created by AI infrastructure demand.
The strongest part of the Nvidia story is that this rally is not being driven by hype alone. The underlying business numbers remain exceptionally strong. In its latest reported quarter, fiscal Q2 2027, Nvidia generated approximately $96.22 billion in revenue, representing an extraordinary 106% year-over-year increase and an 18% sequential improvement. Data Center revenue reached roughly $89 billion, up 117% from the same period a year earlier, showing that AI infrastructure remains the primary engine behind the company's expansion. Gross margin remained around 75%, net income surged 126% to approximately $59.7 billion, and diluted EPS reached $2.46.
Management's current-quarter revenue guidance of roughly $108 billion, plus or minus 2%, gives the market another reason to believe that the earnings engine still has considerable momentum.
This is where Nvidia becomes particularly interesting for me: the company is not simply benefiting from current AI demand; it is positioning itself at the center of the next several years of AI infrastructure spending.
Management has repeatedly indicated that demand remains extremely strong and that supply, rather than customer appetite, remains an important constraint. Hyperscalers and technology companies are continuing to build massive AI data-center capacity, while demand for accelerated computing, networking and next-generation GPUs continues to expand. If this spending cycle remains intact through fiscal 2027 and fiscal 2028, Nvidia's earnings trajectory could remain significantly stronger than what traditional semiconductor cycles have historically produced.
Another major catalyst arrived on September 28, when Nvidia announced a $150 billion increase to its existing share-repurchase authorization, taking remaining buyback capacity to approximately $235 billion through fiscal 2028. At today's valuation, that represents a meaningful capital-return commitment and potentially provides an additional source of long-term demand for the shares. The company also raised its quarterly dividend to $0.25 per share from $0.01, although the dividend yield remains relatively modest compared with traditional income stocks. For me, however, the bigger message is capital strength: Nvidia is generating enough cash from its operations to simultaneously fund enormous AI expansion, maintain strong profitability and return substantial capital to shareholders.
Wall Street sentiment is reinforcing the bullish setup. Morgan Stanley named Nvidia its semiconductor Top Pick while maintaining an Overweight rating and a $300 price target. Across the broader analyst community, targets have moved substantially higher, with consensus estimates sitting around the $325-$328 area. Several major targets cluster around $300-$335, including Morgan Stanley and TheStreet at $300, Wells Fargo and Citigroup at $315, J.P. Morgan at $320, RBC at $330 and Benchmark at $335. There are also much more aggressive scenarios, with some estimates extending considerably above $400. These targets should not be treated as guarantees, but the direction of analyst revisions matters because it shows that expectations for Nvidia's future earnings power continue to rise.
The volume confirmation is another part of this breakout that deserves attention. Nvidia traded approximately 109 million shares during the record-setting session versus a recent average closer to 80 million shares, putting volume around 1.4 times normal activity.
That is important because a new all-time high accompanied by stronger-than-average turnover is generally more meaningful than a thin-volume breakout. It suggests that the move has genuine participation behind it rather than being caused by a temporary liquidity vacuum. At the same time, the stock did not finish at the absolute intraday high, which tells us that profit-taking is already appearing around the $237-$240 region. That does not invalidate the bullish structure; instead, it gives traders a clear area to monitor.
From a technical perspective, $237.87 is now the immediate resistance because it represents the latest all-time high. A sustained move through $240 would strengthen the breakout psychologically, while $250 becomes the next major round-number target. On the downside, the first important support zone is around $228-$230. If that area holds during normal profit-taking, the bullish structure remains healthy. Below that, $218-$220 becomes the next important demand zone, followed by approximately $210. For me, the most important confirmation is not simply an intraday move above the record; it is the ability to establish sustained daily closes above the previous record-close area around $235.74.
That distinction matters because markets frequently produce false breakouts around all-time highs. If Nvidia continues closing above $235-$238 with strong volume, the market can begin treating the previous record as support rather than resistance. In that scenario, $240 becomes the first psychological checkpoint, followed by $250, and a sustained breakout could eventually open the path toward the $275-$300 region. A move toward $300 would require continued earnings growth, strong AI spending and supportive market conditions, but the current fundamental setup makes that target increasingly relevant rather than purely speculative.
The bull case becomes even stronger if Nvidia delivers another major earnings beat around its expected fiscal Q3 2027 report in November. If revenue again exceeds expectations, Data Center growth remains above 100% or close to it, gross margins remain resilient and management maintains strong forward guidance, the market could begin pricing the $300-$335 analyst-target cluster more aggressively. In that scenario, the current $237-$240 area could eventually become a launch zone rather than a ceiling.
But traders should also understand the invalidation signals. If Nvidia repeatedly fails around $237-$240, loses $228 with expanding selling volume and then breaks below $218-$220, the breakout momentum would be weakening. A deeper move toward $210 would suggest that the market is demanding a stronger fundamental catalyst before assigning the stock a higher valuation. The biggest risks remain elevated expectations, semiconductor-cycle volatility, potential supply constraints, geopolitical and China-related export restrictions, and the possibility that hyperscaler AI capital spending eventually slows. These risks do not destroy the long-term thesis, but they can create sharp short-term corrections.
The valuation question is also important. Nvidia's forward P/E around the mid-20s is not necessarily extreme when compared with the company's extraordinary earnings growth, but valuation becomes much more sensitive if growth expectations begin falling. A company growing revenue at triple-digit rates can justify a premium multiple much more easily than a company whose growth is slowing toward traditional semiconductor levels. Therefore, the market is effectively asking Nvidia to continue delivering exceptional numbers. As long as earnings growth keeps outrunning valuation expansion, the bullish structure can remain intact.
My trading view is therefore straightforward: Nvidia remains structurally bullish while the stock holds above the $228-$230 area and continues defending the breakout near $235. A clean daily close above $240 would strengthen momentum and put $250 into focus. Above $250, the next major psychological zone becomes $275, followed by the $300 region. Traders should avoid chasing a vertical candle simply because Nvidia has reached an all-time high; instead, pullbacks toward confirmed support can provide a more disciplined risk-reward setup. The key is to watch price, volume and the reaction around $237-$240 together rather than relying on price alone.
The bigger picture is even more compelling. Nvidia is sitting at the intersection of AI computing demand, hyperscaler capital expenditure, accelerated computing, data-center expansion and increasingly sophisticated AI infrastructure. Revenue of approximately $96.22 billion, Data Center revenue near $89 billion, triple-digit growth, around 75% gross margins, approximately $59.7 billion in quarterly net income and a remaining buyback authorization near $235 billion show why investors continue to assign Nvidia a premium position within the technology sector.
For me, the new all-time high is therefore more than a headline. It is a market signal. Nvidia has returned to price discovery while the fundamental engine continues expanding, trading volume is confirming participation, analysts are raising targets and AI infrastructure spending remains enormous. The critical question is no longer whether Nvidia can reclaim its previous high — it already has. The next question is whether the company can convert this breakout into a sustained move toward $250, $275 and eventually the $300 region.
Right now, the structure says the bulls have control, but the confirmation must come from follow-through. Above $237.87-$240, momentum can accelerate. Around $228-$230, buyers need to defend the breakout. Below $218-$220, the short-term structure becomes considerably weaker. Until those levels change, Nvidia remains one of the most important momentum stories in the U.S. equity market and one of the clearest beneficiaries of the ongoing AI investment cycle.
#GT三季度销毁近200万枚
My take: While GT’s long-term outlook is positive (constructive), the token burn process alone is not enough to justify a bullish valuation.
Gate confirmed that 1,987,321 GT were burned in Q3, bringing the total burned amount to 191.93 million GT (approximately 63.98% of the initial 300 million supply).
The interesting aspect lies in the supply-demand dynamic:
* Supply: Nearly two-thirds of the initial supply has already been removed from circulation. Ongoing burn operations are creating genuine scarcity.
* Demand: For GT to sustain higher valuations, Gate needs to continue gr
HighAmbition
#GT三季度销毁近200万枚
My take: While GT’s long-term outlook is positive (constructive), the token burn process alone is not enough to justify a bullish valuation.
Gate confirmed that 1,987,321 GT were burned in Q3, bringing the total burned amount to 191.93 million GT (approximately 63.98% of the initial 300 million supply).
The interesting aspect lies in the supply-demand dynamic:
* Supply: Nearly two-thirds of the initial supply has already been removed from circulation. Ongoing burn operations are creating genuine scarcity.
* Demand: For GT to sustain higher valuations, Gate needs to continue growing in terms of trading volume, user base, on-chain products, and GT utility. Gate has stated that it plans to expand GT's use cases alongside the burn program.
* Diminishing impact: As the remaining supply shrinks, each quarterly burn represents a smaller percentage of the total circulating supply. If demand does not rise in tandem, the impact of scarcity could weaken.
* Exchange token risk: GT’s value remains heavily dependent on the health, competitiveness, and regulatory status of the Gate ecosystem. This is likely the biggest long-term risk.
* Key indicator: Rather than focusing solely on the number of tokens burned, I would track GT’s utility and activity within the Gate ecosystem relative to the burn rate.
Therefore, I would evaluate GT not merely based on the "burn = price increase" thesis, but rather through the lens of "ecosystem growth + deflation." If Gate continues to grow while burn operations persist at significant levels, the shrinking supply could reinforce demand-driven price appreciation in the long run. However, should ecosystem growth stall, even a 64% reduction in supply might fail to generate lasting value.
In summary: Structurally, it has a bullish bias; however, the development of use cases is the primary driving force (catalyst), while the burn process serves as a factor that amplifies this effect.
$GT ‌
GT+0.18%
#GateMemeCarnival #DOGE
The $0.095 threshold is being watched for a potential breakout in Dogecoin.
The $0.095 level has emerged as a key point for a potential breakout in Dogecoin.
Price compression has intensified on the four-hour chart, narrowing the range of movement for $DOGE .
A close above $0.095 is being monitored as a scenario that could drive the price to $0.106.
Previous attempts in August and September failed to sustain levels above $0.10.
The compressed price structure on Dogecoin’s four-hour chart may signal an imminent move.
As the price fluctuates within a descending triangle p
HighAmbition
#GateMemeCarnival #DOGE
The $0.095 threshold is being watched for a potential breakout in Dogecoin.
The $0.095 level has emerged as a key point for a potential breakout in Dogecoin.
Price compression has intensified on the four-hour chart, narrowing the range of movement for $DOGE .
A close above $0.095 is being monitored as a scenario that could drive the price to $0.106.
Previous attempts in August and September failed to sustain levels above $0.10.
The compressed price structure on Dogecoin’s four-hour chart may signal an imminent move.
As the price fluctuates within a descending triangle pattern, the $0.095 level stands out as a critical short-term threshold.
A descending triangle is a technical pattern characterized by a horizontal base and lower highs. While this setup can indicate growing selling pressure over time, the resulting breakout is not necessarily downward. As the Dogecoin price approaches the triangle's apex, its range of movement narrows, increasing the likelihood of a sharp shift in direction.
I am keeping a close eye on the $0.095 level. I anticipate that a four-hour close above this mark could confirm an upward breakout, potentially generating the momentum needed to push the price to $0.106.
Levels above $0.10 have not yet held.
The $0.10 zone has recently emerged as a significant barrier for Dogecoin. A rally in mid-August stalled at this level, followed by a price pullback. Similarly, although the $0.106 level was tested on September 21, this move could not be sustained, and renewed selling pressure followed.
The fact that the price first pulled back from the August 22 peak of $0.10 to form a lower high at $0.095, and subsequently established another lower high at $0.098 after dropping from $0.106, points to a gradual resistance zone in the market. Therefore, the $0.095 and $0.098 levels are crucial for the price to reclaim the $0.10 mark.
I assess that a four-hour close above $0.095 could confirm an upward breakout for Dogecoin and trigger a move toward $0.106.
All eyes on signs of recovery in the short term
Dogecoin is attempting a recovery following a week of selling pressure. The price rose 0.93% over the last 24 hours to reach $0.094. This trend points to a cautious recovery unfolding just below critical thresholds.
Although technical indicators do not yet signal a clear direction, the fact that the price is moving within a narrowing band suggests that volatility could increase in the short term.
‍$DOGE
DOGE-2.25%
#OneGate见证计划 Weekly Token Unlock Overview: ENA, HYPE, AERO, OP; Who Is Creating Pressure, and Who Is Just Going Through the Motions?
Token unlocks are nothing new, but when the amount is large enough and the proportion high enough, they can directly become a short-term pricing anchor for the market. This week features four relatively notable unlocks: Ethena (ENA), Hyperliquid (HYPE), Aerodrome (AERO), and Optimism (OP).
Ethena (ENA)
Unlocking on October 5, it belongs to the DeFi sector. Its circulating market cap is approximately $2.4 billion, with this unlock worth $40.58 million, correspondi
HighAmbition
#OneGate见证计划 Weekly Token Unlock Overview: ENA, HYPE, AERO, OP; Who Is Creating Pressure, and Who Is Just Going Through the Motions?
Token unlocks are nothing new, but when the amount is large enough and the proportion high enough, they can directly become a short-term pricing anchor for the market. This week features four relatively notable unlocks: Ethena (ENA), Hyperliquid (HYPE), Aerodrome (AERO), and Optimism (OP).
Ethena (ENA)
Unlocking on October 5, it belongs to the DeFi sector. Its circulating market cap is approximately $2.4 billion, with this unlock worth $40.58 million, corresponding to 170 million tokens and accounting for 1.7% of the current circulating supply. This is the highest-proportion unlock of the week. 1.7% is not extreme, but in the current environment of cautious market sentiment, it is enough to trigger expectations of short-term selling pressure.
In particular, as the core token of a synthetic dollar protocol, ENA has a relatively high proportion of institutional and early investors in its holder structure. If they choose to cash out after the unlock, its price sensitivity will be significantly higher than that of a purely retail-driven project.
Hyperliquid (HYPE)
Also on October 5. Its circulating market cap is as high as $20.1 billion, with this unlock worth approximately $340 million, involving 3.75 million tokens and accounting for only 0.4% of the circulating supply. The amount looks large, but the proportion is extremely low. For a leading DEX with a market cap already above the $20 billion level, a 0.4% unlock looks more like a normal supply release than a disruptive event.
The market's current pricing logic for HYPE is based more on trading volume, fee revenue, and buyback expectations. A single small-percentage unlock is unlikely to change the medium-term trend.
Aerodrome (AERO)
Unlocking on October 7. Its circulating market cap is $850 million, with an unlock worth $3.53 million, involving 4.1 million tokens and accounting for 0.4%. In terms of both amount and proportion, this falls into the low-impact category.
Its leading position among Base ecosystem DEXs remains intact, with liquidity and trading volume data supporting its fundamentals. This unlock will most likely be quickly absorbed by the market. Optimism (OP)
Unlocking on October 11. Its circulating market cap is $3 billion, with the unlock worth only $590k, involving 4.45 million tokens and accounting for 0.2%. It can almost be ignored. The Layer 2 sector as a whole remains in a phase where narrative and implementation are progressing in parallel, so OP's unlock is expected to have a very limited impact on its price.
The only one that truly warrants caution is ENA
Looking at the four unlocks together, the divergence is very clear: HYPE has the largest amount but the lowest proportion, so its impact is limited. ENA has the highest proportion, and its amount is also substantial, making its short-term pressure the most worth watching. AERO and OP are essentially just going through the motions.
The impact of token unlocks on prices has never been as simple as “unlocking means a drop.”
The key is to look at three variables: whether the unlock proportion is high enough (usually, it only becomes materially worth discussing once it exceeds 1%); who receives the tokens (the team, investors, or the community); and the market's risk appetite at the time. The overall market is currently in a digestion phase following Bitcoin's surge and retreat, and risk assets have become more sensitive to supply shocks.
ENA's 1.7% unlock falls right within this window. If concentrated selling pressure emerges after the unlock, short-term volatility could be amplified; conversely, if buyers absorb the supply strongly, the market may interpret it as “the bearish news has been fully priced in.”
HYPE is completely different. A 0.4% unlock is more like routine operations for it. What truly determines its direction remains trading data, revenue generation, and the pace of buybacks. As long as these fundamentals do not deteriorate significantly, a single small-percentage unlock is unlikely to become a trend reversal point.
How to approach this week's trading pace
For short-term traders, ENA is the only unlock event this week that requires close attention. Watch changes in trading volume before and after the unlock, large transfers, and whether there is any obvious buildup of sell orders. If the price drops rapidly after the unlock but trading volume does not increase, it often means the selling pressure was priced in ahead of time; if the drop is accompanied by increased volume, greater caution is warranted.
For medium- and long-term holders, the impact of the HYPE, AERO, and OP unlocks can all be treated as secondary. What truly determines their direction remains the competitive landscape and protocol revenue in their respective sectors, rather than a one-off release of tokens worth several million to tens of millions of dollars.
A token unlock itself is merely a disturbance on the supply side. It does not create value, nor does it eliminate value out of thin air; it simply puts previously locked tokens onto the market ahead of time. The market will ultimately tell you with real money whether these tokens were absorbed or dumped. The most important thing to watch this week is not “whether there is an unlock,” but “who is buying after the unlock.”
ENA+0.99%
HYPE+0.92%
AERO+5.04%
OP+0.42%
#OneGate见证计划 #SOL现货ETF单日净流出924万美元 Institutional “slow money” is cooling, while on-chain “hot money” remains active—$120 is the dividing line
On 10/5, SOL spot ETFs saw net outflows of $9.245 million (BSOL outflow of $7.1 million, FSOL outflow of $2.1 million, with none recording inflows), but this is only the “tip of the iceberg”—the real signal is in the weekly data: net inflows were just $2.43 million last week, plunging approximately 99% from $188.2 million the previous week. At the same time, XRP ETFs are also cooling in tandem (weekly inflows down 94%+), while BTC ETFs are still attractin
HighAmbition
#OneGate见证计划 #SOL现货ETF单日净流出924万美元 Institutional “slow money” is cooling, while on-chain “hot money” remains active—$120 is the dividing line
On 10/5, SOL spot ETFs saw net outflows of $9.245 million (BSOL outflow of $7.1 million, FSOL outflow of $2.1 million, with none recording inflows), but this is only the “tip of the iceberg”—the real signal is in the weekly data: net inflows were just $2.43 million last week, plunging approximately 99% from $188.2 million the previous week. At the same time, XRP ETFs are also cooling in tandem (weekly inflows down 94%+), while BTC ETFs are still attracting funds—this is not SOL’s problem alone, but a structural shift in which “altcoin ETFs are retreating across the board and funds are returning to the mainstream.”
But on the other hand: SOL’s price is holding above $120, while DEX trading volume and tokenized stock trading remain strong.
ETF outflows show that “new institutional money” has stopped, while on-chain activity shows that “old ecosystem money” is still there—SOL’s pricing power is shifting from the “ETF narrative” to “on-chain usage,” with $120 marking the dividing line.
A single-day outflow of $9.24 million is really nothing
Cumulative net inflows stand at $1.599 billion, and a single-day outflow of $9.24 million accounts for just 0.6%—this is not “institutional flight,” but “slowing incremental inflows.” What is truly worth watching are two structural signals:
Signal one: weekly inflows collapsed 99% ($188 million→$2.43 million). The record of 14 consecutive weeks of net inflows remains intact, but “new money” has virtually stopped—institutions have shifted from “actively allocating” to “holding back.”
Signal two: altcoin ETFs are cooling across the board, while BTC is attracting funds alone. SOL and XRP ETFs have simultaneously stalled, while BTC ETFs still took in $241 million last week—funds are “returning to the mainstream” (risk-off rotation), and the “institutional side” of altcoin season has temporarily gone quiet. This follows the same logic as after the nonfarm payrolls report: the negative news has been priced in, but funds only dare to buy BTC.
But on-chain activity is showing “another side”
ETF funds and on-chain activity come from two different groups:
ETF institutions (slow money): watching macro conditions, compliance, and liquidity—they are waiting on the sidelines
​On-chain players (hot money): trading memes, using DEXs, and trading tokenized stocks—they are still present
SOL’s price has held $120 despite ETF inflows collapsing 99%, thanks to the resilience of DEX trading volume and tokenized stock trading.
This is actually a good thing: SOL’s pricing is shifting from “institutional sentiment” toward “real usage,” making its foundation more solid—but the cost is that without the “incremental capital” from ETFs, the slope of its rise will slow.
Impact on the price outlook: three judgments
Short term: $120 is the center of the tug-of-war. ETF outflows (bearish) vs. on-chain activity (bullish)—holding $120 means a range-bound bias with strength, targeting $132 (the previous-high zone after four consecutive gains); breaking below $120 means a pullback to $110-115. The direction will most likely depend on external variables (BTC choosing a direction/macro conditions), as SOL currently lacks the ability to break out independently.
Medium term: SOL’s “valuation anchor” has changed. Over the past six months, SOL’s gains relied on “ETF expectations + the institutional narrative.” Now that the narrative is cooling, SOL must rely on real substance (DEX volume, tokenized stocks, and ecosystem activity) to support its valuation—this is a “disenchantment phase”: the bubble portion will be squeezed out, while the usage-driven portion will remain.
Structural judgment: altcoin season has been delayed, not canceled. Altcoin ETFs cooling across the board + BTC attracting funds means capital is “narrowing its circle”—only when BTC stabilizes at $87-90K and risk appetite genuinely returns will altcoin ETFs see inflows again.
The $9.24 million outflow from SOL ETFs is the “result,” not the “cause”—the cause is the broad retreat from altcoin ETFs and institutional funds returning to BTC; but SOL’s on-chain activity proves that the ecosystem is still operating. In the short term, $120 will determine the winner; in the medium term, it remains to be seen whether SOL can successfully shift from “institutional narrative” to “usage-based pricing.” $SOL ‌
SOL-1.67%
BTC-2.02%
XRP+0.40%
#Bitmine再增持持仓突破601万ETH The 5% target is within touching distance, but buying is quietly slowing down!
Bitmine (BMNRUS) now holds 6,016,414 ETH (approximately $16.4 billion), accounting for 4.9% of the total ETH supply—99% of the way toward its self-imposed target of holding 5%ETH.
Even more aggressive is its operating model: since launching in June 2025, it has bought ETH every week for 66 consecutive weeks without interruption, while 84% of its holdings (approximately 5.07 million ETH, worth $13.8 billion) has already been staked, with annualized staking returns expected to reach $363 million
HighAmbition
#Bitmine再增持持仓突破601万ETH The 5% target is within touching distance, but buying is quietly slowing down!
Bitmine (BMNRUS) now holds 6,016,414 ETH (approximately $16.4 billion), accounting for 4.9% of the total ETH supply—99% of the way toward its self-imposed target of holding 5%ETH.
Even more aggressive is its operating model: since launching in June 2025, it has bought ETH every week for 66 consecutive weeks without interruption, while 84% of its holdings (approximately 5.07 million ETH, worth $13.8 billion) has already been staked, with annualized staking returns expected to reach $363 million.
This is the "Strategy of ETH"—hoarding coins while earning yield, pushing the "institutional ETH accumulation" narrative to the extreme; but two turning points must be watched: ① The buying pace has slowed for three consecutive weeks (27,562→17,362→15,112 ETH). Will it continue buying after reaching the 5% target? ② ETH accounts for 94% of the company's $17.4 billion in total assets—a highly concentrated single-point exposure. ETH is both its strength and its weakness.

I. What makes this model so "aggressive": it is not just "hoarding," but "hoarding + earning yield"
Strategy: Hoard BTC, which generates no yield—purely "conviction + unrealized gains"
Bitmine: Hoard ETH, with 84% staked to earn a 2.63% annualized yield (expected at $363 million per year)—it is "printing money" while hoarding coins

Three layers of impact:
Demand side: Fixed weekly buying of $40 million+—more disciplined than dollar-cost averaging by retail investors
Supply side: 84% staked means approximately $13.8 billion worth of ETH is "locked away" from the circulating market—effective liquidity is tighter, creating genuine supply contraction
Signal side: Chairman Tom Lee's exact words—"Institutions remain underexposed to crypto and are expected to increase their exposure in the final months of 2026"—he is roadshowing the "institutional entry" story

II. But the two "turning points" matter more than the accumulation itself
Turning point one: The buying pace is slowing: 27,562→17,362→15,112 ETH over the past three weeks, with the latest purchase being the smallest weekly buy since mid-August—the sprint toward the 5% target is slowing.
The core question: What happens after the 5% target is reached?
Look at Strategy's playbook—the marginal effect of the "coin-hoarding narrative" diminishes: buying is bullish, but once the buying is finished, the "good news is priced in"
Turning point two: 94% single-point concentration: Of Bitmine's $17.4 billion in total assets, ETH accounts for $16.4 billion (94%)—this is not "allocation"; it is "all in." If ETH rises, the balance sheet looks better and buying continues; if ETH falls, assets shrink and the company may be forced to stop buying—the "coin-hoarding leader" itself becomes an amplifier of ETH volatility

III. Impact on ETH and the market
Bullish in the short term: Fixed weekly buying + staking lockups = ETH's "effective circulating supply" continues to shrink; the "public companies hoarding ETH" narrative is taking shape, with imitators likely to follow; the final step from 4.9% to 5% is itself newsworthy.
What to watch in the medium term:
Does reaching the 5% target mark the end of the narrative or a new beginning?—This is the litmus test for ETH's "institutional accumulation rally"
Staking concentration: A single entity locking up 5.07 million ETH is both a "lockup bullish factor" and a "network risk"
Compared with the BTC accumulation wave: Public companies collectively hold only 1.27 million BTC (6.4% of circulating supply); Bitmine alone holds 4.9% of ETH—the single-point concentration is far higher than on the BTC side

Bitmine has taken "coin hoarding" to a new level—combining hoarding, staking, and yield generation; 66 uninterrupted weeks demonstrate genuine conviction, while $16.4 billion locked in staking represents genuine supply contraction. But the "5% target" is both an endpoint and a test: the slowing buying pace and 94% concentration are a double-edged sword—it is currently ETH's "bullish engine," but could also become a future "selling overhang."

For ETH: The medium-term thesis gets a boost (institutional accumulation + staking lockups), but do not treat "Bitmine will continue buying" as a perpetual-motion machine—how it proceeds after reaching 5% matters more than how much it has bought
For BMNR stock: It is currently "ETH with 2.63x leverage" (94% allocation)—you can buy it to bet on ETH, but understand that its volatility is far greater than ETH's
For the market narrative: "Corporate coin hoarding" is spreading from BTC to ETH—this is a typical late-bull-market feature (asset scarcity + institutions seeking an anchor); the hotter the narrative gets, the more important it is to remember valuation

Bitmine's 66 weeks have proven that "conviction" can be quantified—but Strategy hoards BTC, Bitmine hoards ETH, and Lion Group hoards HYPE—when "hoarding" becomes a collective behavior, "hoarding" itself is no longer a source of excess returns, but the final baton in the relay. Institutions understand better than retail investors "when it is time to tell the story to someone else." #OneGate见证计划 $ETH ‌
BMNR-2.45%
ETH-1.08%
BTC+1.18%
HYPE+0.92%
#SolanaSpotETFsSee$9.24MNetOutflow
Solana spot ETFs just logged a net outflow of roughly $9.24 million, and on the surface that reads like the first crack in one of the strongest institutional stories in crypto this year. A net outflow means investors pulled more capital out of these funds than they put in during a single session, so more SOL exposure was redeemed than created. But before anyone panic sells, let me put that number exactly where it belongs, because context is everything here.
First, the composition of that $9.24 million tells you this was not broad based fear. The largest sing
HighAmbition
#SolanaSpotETFsSee$9.24MNetOutflow
Solana spot ETFs just logged a net outflow of roughly $9.24 million, and on the surface that reads like the first crack in one of the strongest institutional stories in crypto this year. A net outflow means investors pulled more capital out of these funds than they put in during a single session, so more SOL exposure was redeemed than created. But before anyone panic sells, let me put that number exactly where it belongs, because context is everything here.
First, the composition of that $9.24 million tells you this was not broad based fear. The largest single redemption came from the Bitwise Solana Staking ETF, which shed close to nine million dollars on its own, while the Fidelity Solana Fund ETF actually took in about $2.77 million on the same day. When one fund is selling and another is buying at the same time, that is rotation and rebalancing, not capitulation. The outflow is concentrated in one product rather than spread across the entire complex, and that distinction changes the whole read.
Second, and this is the part most people miss, that red day came immediately after the strongest week since these funds launched. In the prior week, all seven U.S. spot Solana funds combined to pull in a record $188 million in net inflows, including a single session of $86.7 million. So the complex went from its best week ever straight into its first daily outflow in weeks. A $9.24 million redemption against roughly $1.61 billion of cumulative inflows is a rounding error, about zero point six percent of assets under management, which still sits near $1.9 billion. Net assets did dip from a record $1.96 billion to around $1.9 billion, but almost all of that $55 million decline was price depreciation, not money actually leaving the fund. That is the crucial detail, because cumulative inflows only move when capital genuinely flows in or out, and they remain firmly positive.
So why did the outflow happen, and how much selling pressure can it actually put on Solana? There are three reasons, and none of them is that Solana is broken. The first is quarter end. That session was the final trading day of the third quarter, and quarter end rebalancing is a repeatable, almost mechanical pattern across the entire crypto ETF space. On that exact same day, Bitcoin funds shed $148.7 million and Ethereum funds lost $59.6 million. Solana was not singled out; it was swept up in the same rotation. The second reason is plain profit taking. Solana is still up roughly fifteen percent over the past thirty days, and after a record inflow week, some of the hot money takes chips off the table. The third is product level reallocation, with one fund trimming while another adds.
As for the actual selling pressure, structurally it is minimal. Spot ETF flows are a small slice of Solana's roughly $75 billion market cap, and one day of $9.24 million in redemptions is a drop in the ocean. The real pressure, if it comes, will live on the derivatives side, and that is where I am watching the tape most closely. Solana's open interest sits around $7.3 billion with a long short ratio near two, meaning there are roughly twice as many longs as shorts positioned. That is a caution flag rather than a green light, because crowded longs are fuel for a squeeze in either direction. Funding is positive but mild, so longs are paying only a small premium, which tells you sentiment is constructive but nowhere near euphoric. The taker buy sell ratio is marginally below one, so selling aggression is only slightly higher than buying right now. Nothing here screams distribution.
Where does Solana's price actually stand today? It is trading right around $120, after ranging between a twenty four hour high near $122 and a low near $118.95. That is roughly a one percent down move on the day, and over seven days it is essentially flat, up less than half a percent. In other words, this headline outflow has not translated into any meaningful price damage. The token remains up about fifteen percent over thirty days, and that is the trend that actually matters, not a single red day in the fund flows.
Technically, this is a healthy consolidation, not a breakdown. On the daily chart the trend strength reading is above forty five, which signals a strong established trend, and the daily parabolic stop sits well below price near $113, keeping the larger structure bullish. The four hour chart still shows bullish moving average alignment. The shorter term hourly indicators are simply cooling off after a local pullback, with the RSI near forty one and the Williams percent range deep in oversold territory. That is exactly what you want to see after a dip, because it means the local selling is getting washed out rather than accelerating.
The levels I am watching are clean. On the downside, the first support is $118.50, right around the one hundred period moving average, and below that $106 is a former resistance that should now act as support. On the upside, the first real test is $127. Those are the two lines that decide the next move.
Where can Solana go from here? I will give you an honest answer with percentages, not hopium. If $118 holds and ETF flows return to inflows this week, the path of least resistance is a retest of $127, which is about five and a half percent higher, and a clean break there opens $132 to $135, another five to seven percent beyond that. That base case puts Solana roughly ten to twelve percent above current levels. A more aggressive scenario, if the broad market resumes its risk on tone and those record inflow weeks come back, is a move toward $145 to $150, which is twenty to twenty five percent higher, but that requires the macro backdrop to cooperate and is not my base case. The bear case is a clean break below $118, which opens $106, roughly a twelve percent drop from here. I would not short a fifteen percent uptrend off the back of a $9.24 million outflow; the risk reward on the short side is poor.
My trading plan is disciplined and simple. I treat this ETF outflow as noise until the weekly total actually flips negative. The week ending October second still printed a positive $2.4 million in net inflows, razor thin but still positive, so the streak technically survived. The signal that actually matters is the next few days of flows. If we get back to back inflow days, the outflow was a one off and I look to buy the dip toward $118. If outflows persist for a full week and price loses $118, I step aside and let $106 come to me. The crowded long position in derivatives is the single most important thing I am watching, because a break of $118 could trigger a long squeeze that pushes price down faster than the fund flows alone would suggest.
The bigger picture is what gives me conviction that this is a headline, not a reversal. While the ETF complex took a one day breather, the institutional accumulation underneath is still running hot. Solana treasury companies like DeFi Development just added more than 26,000 SOL, taking their holdings above 2.56 million SOL worth over $302 million, up about eleven percent since their August update. The Solana Foundation just launched a delivery versus payment settlement standard built for institutions, with JPMorgan involved in the design, and that kind of infrastructure matters more to long term price than a single ETF red day. The network is also rolling out the Alpenglow consensus upgrade aimed at cutting transaction finality from roughly 12.8 seconds down to about 150 milliseconds, a step change for institutional and payments adoption.
My read is this. The $9.24 million outflow is a data point, not a trend reversal. One red day after a record $188 million week is textbook quarter end behavior, and it does not justify the bearish panic some headlines are trying to sell. The real battle is at $118, and as long as that level holds, Solana's path of least resistance remains higher. I am watching $127 as the first upside target and $106 as the line in the sand below.
#BitmineAddsMoreETH,HoldingsTop6.01M
BITMINE NOW HOLDS 6 MILLION ETH — IS ETH READY FOR THE NEXT BIG MOVE?
Bitmine Immersion Technologies has crossed one of the most important Ethereum treasury milestones ever recorded: more than 6 million ETH.
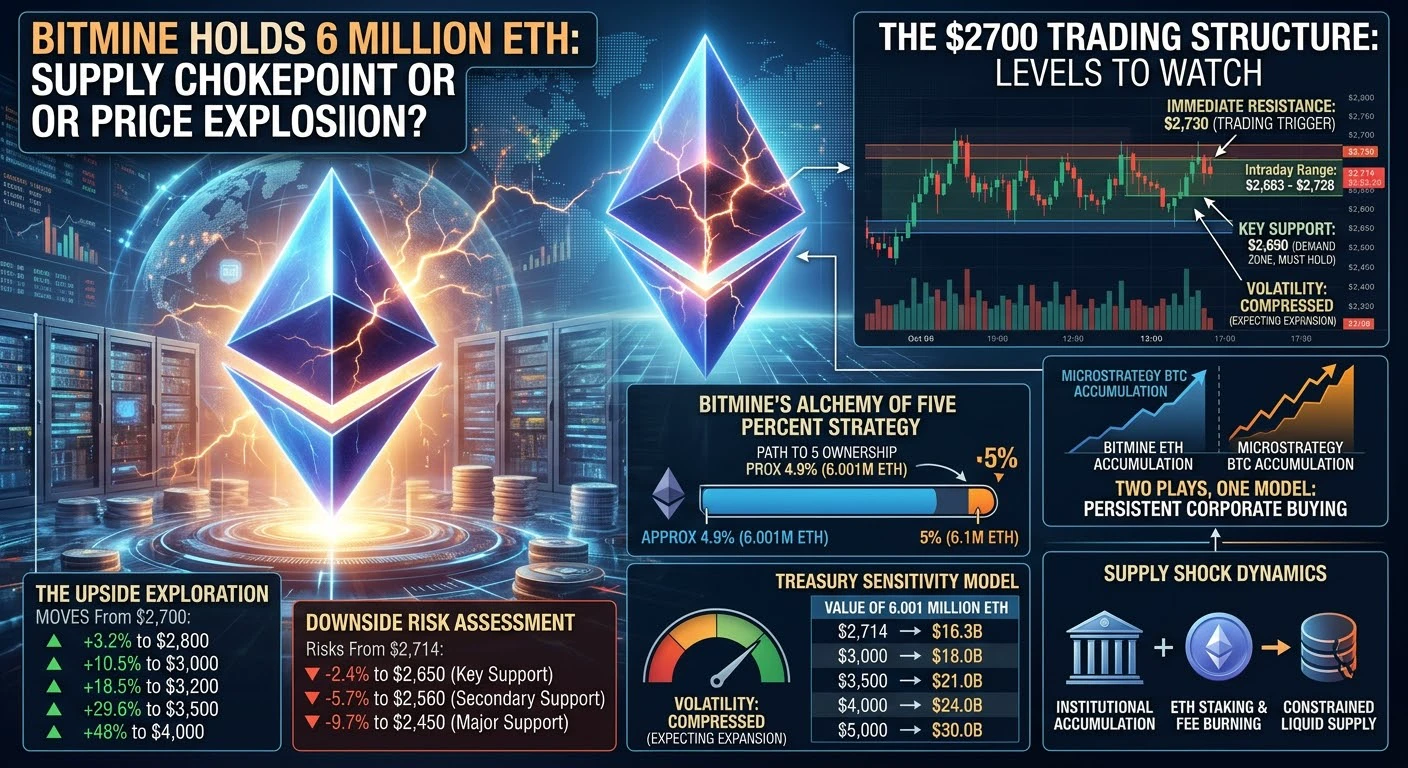
The company now holds approximately 6.001 million ETH, turning Bitmine into one of the most aggressive institutional Ethereum accumulators in the world. At an ETH price around $2,700, that treasury represents roughly $16.2 billion in market value.
But the real story is not simply the $16 billion number.
The real story is what happens when one public co
HighAmbition
#BitmineAddsMoreETH,HoldingsTop6.01M
BITMINE NOW HOLDS 6 MILLION ETH — IS ETH READY FOR THE NEXT BIG MOVE?
Bitmine Immersion Technologies has crossed one of the most important Ethereum treasury milestones ever recorded: more than 6 million ETH.
The company now holds approximately 6.001 million ETH, turning Bitmine into one of the most aggressive institutional Ethereum accumulators in the world. At an ETH price around $2,700, that treasury represents roughly $16.2 billion in market value.
But the real story is not simply the $16 billion number.
The real story is what happens when one public company continues removing millions of ETH from the liquid market while Ethereum itself remains one of the most important settlement networks in crypto.
Bitmine is now holding close to 4.9% of Ethereum’s total supply. Its long-term objective is even more aggressive: the Alchemy of Five Percent strategy, targeting ownership of approximately 5% of all ETH.
That means Bitmine is now extremely close to a target that once looked almost impossible.
And this is where the numbers become interesting.
If ETH is worth $2,700, every additional 100,000 ETH represents approximately $270 million of exposure.
If ETH reaches $3,000, the same 100,000 ETH becomes $300 million.
At $3,500, it becomes $350 million.
At $4,000, it becomes $400 million.
So when Bitmine adds another 100,000 ETH, it is not simply adding tokens to a wallet. It is increasing its exposure to ETH by hundreds of millions of dollars at different market valuations.
That is the scale of this strategy.
And there is another important factor.
Bitmine is not simply buying ETH and waiting.
Its strategy also involves staking through its institutional validator infrastructure. This creates the possibility of earning staking yield while maintaining exposure to Ethereum’s long-term price appreciation.
That gives the treasury model two potential engines:
ETH price appreciation + staking income.
This is one reason the Bitmine strategy is increasingly being compared with Strategy’s Bitcoin accumulation model.
Strategy showed the market what persistent corporate accumulation can do for Bitcoin.
Now Bitmine is attempting something similar with Ethereum.
But Ethereum has a different investment story.
Bitcoin is primarily a scarce digital monetary asset.
Ethereum is both an asset and a blockchain infrastructure layer.
ETH is used throughout decentralized finance, stablecoins, tokenized real-world assets, smart contracts and a growing institutional settlement ecosystem.
That means Bitmine is not simply betting on the price of a cryptocurrency.
It is effectively betting that Ethereum’s economic network will become significantly more valuable over time.
NOW LET’S LOOK AT THE PRICE.
ETH is currently trading around $2,714.
The recent intraday high is around $2,728, while the intraday low is around $2,683.
That puts Ethereum directly below an important resistance zone.
The first battle is $2,730.
A strong daily close above $2,730 would be an important bullish signal because it would confirm that buyers are finally absorbing the supply around the $2,700–$2,730 region.
From $2,730, the next target is $2,800.
A move from $2,714 to $2,800 would represent approximately +3.2%.
If ETH breaks $2,800 and momentum accelerates toward $3,000, that would represent approximately +10.5% from the current price.
That is where the chart could become much more interesting.
A breakout from $2,730 to $3,000 would be roughly +10.5%.
A move from $2,700 to $3,200 would be approximately +18.5%.
A move from $2,700 to $3,500 would be approximately +29.6%.
And if Ethereum eventually reaches $4,000, the upside from approximately $2,700 would be close to +48%.
These are not guaranteed targets. They are scenario levels that become increasingly realistic only if momentum, liquidity, Bitcoin and institutional demand all move in the same direction.
THE $2,650 LEVEL IS JUST AS IMPORTANT.
Ethereum has been defending the $2,650 area, making it one of the most important short-term demand zones.
From $2,714 down to $2,650 is approximately -2.4%.
If ETH holds $2,650 and buyers step in, that would keep the current bullish structure alive.
But if $2,650 breaks decisively with heavy selling volume, the next zone I would watch is approximately $2,560.
That represents roughly -5.7% from $2,714.
Below $2,560, the $2,450 area becomes important.
A decline from $2,714 to $2,450 would be approximately -9.7%.
This is why I am not simply saying “Bitmine is buying, therefore ETH must go up.”
Markets do not work that way.
Bitmine can create long-term demand, but short-term price still depends on liquidity, Bitcoin, derivatives positioning, macroeconomic conditions and overall risk appetite.
THE TECHNICAL SETUP IS GETTING INTERESTING.
Ethereum has recently traded inside a relatively tight range between approximately $2,650 and $2,775.
The October 2 session produced a high around $2,765–$2,775 and a low near $2,652, showing just how important this region has become.
Recent daily moves have also remained relatively controlled, with ETH posting approximately +0.7%, +1.5%, then -0.6% and another modest decline across recent sessions.
That tells me volatility has compressed.
And compressed volatility does not remain compressed forever.
Eventually, the market normally chooses a direction.
The question is whether the next expansion happens above $2,730 or below $2,650.
For me, $2,730 is the trigger.
Above $2,730: bullish momentum strengthens.
Above $2,800: $3,000 becomes the major psychological target.
Above $3,000: $3,200 becomes the next major expansion zone.
Above $3,200: $3,500 becomes possible if Bitcoin and liquidity remain supportive.
Above $3,500: $4,000 becomes the bigger psychological objective.
On the downside:
Below $2,650: caution.
Below $2,560: bearish pressure increases.
Below $2,450: the short-term bullish structure would require a serious reassessment.
THIS IS WHERE BITMINE BECOMES IMPORTANT.
Imagine Ethereum reaches $3,000.
Bitmine’s 6.001 million ETH treasury would then be worth approximately $18.0 billion.
At $3,500, that same treasury would be worth approximately $21.0 billion.
At $4,000, approximately $24.0 billion.
At $5,000, approximately $30.0 billion.
Every $100 move in ETH changes the theoretical market value of 6.001 million ETH by approximately $600 million.
Think about that.
A $500 move in ETH would change the value of Bitmine’s current holdings by roughly $3 billion.
A $1,000 move would change it by roughly $6 billion.
That is why this treasury is becoming such an important market story.
Bitmine has effectively created enormous sensitivity to Ethereum’s price.
And if the company continues buying every week, its sensitivity becomes even larger.
THE SUPPLY STORY IS ALSO IMPORTANT.
Ethereum has roughly 122 million ETH in total supply.
If Bitmine controls approximately 6 million ETH, that is close to 4.9% of total supply.
If it reaches the 5% target, it would control roughly one out of every twenty ETH.
That is an extraordinary concentration.
But there is another side to the equation.
Ethereum also has ETH locked in staking, while its fee-burning mechanism can remove ETH from circulation during periods of strong network activity.
Therefore, the amount of ETH actually available as liquid supply can be much more important than simply looking at total supply.
If institutional buyers continue accumulating while liquid supply remains constrained, the market can become increasingly sensitive to relatively small changes in demand.
This is the part of the Bitmine story that deserves the most attention.
The market is watching a real-time supply experiment.
One large public company is systematically acquiring ETH.
Meanwhile, other institutions are gaining exposure through regulated investment products and traditional financial channels.
If these two trends continue together, Ethereum’s market structure could become increasingly institutionally driven.
MY TRADING VIEW
I remain bullish on ETH while price holds above $2,650.
I would become significantly more bullish after a confirmed daily close above $2,730.
The first upside objective would be $2,800, followed by $3,000.
A sustained break above $3,000 could shift the market into a stronger momentum phase, with $3,200 and $3,500 becoming realistic extension zones.
The $4,000 level is the bigger long-term psychological target, but I would only consider that scenario if institutional demand, liquidity and the broader crypto trend remain strongly supportive.
On the other hand, I would not ignore a breakdown.
A loss of $2,650 would weaken the immediate setup.
A break below $2,560 would increase downside risk toward $2,450.
And if Bitcoin enters a major correction, ETH could fall even if Bitmine continues buying.
That is why I prefer structure over hype.
BITMINE’S 6 MILLION ETH IS NOT A GUARANTEE.
It is a signal.
It is a signal that institutional conviction in Ethereum is becoming much larger.
The company is essentially saying that it wants to own approximately 5% of the entire Ethereum supply.
And now it is already around 98% of the way toward that objective.
The next milestone could therefore be even more important than the 6 million ETH milestone itself.
5%.
One company.
Approximately one-twentieth of the entire ETH supply.
If Bitmine reaches that target while Ethereum is trading above $3,000, the value of the treasury would be around $18 billion.
At $4,000, it would be around $24 billion.
At $5,000, around $30 billion.
Those numbers show why this story deserves attention.
For Ethereum traders, I am watching $2,730.
For ETH bulls, $2,800 is the next confirmation zone.
For momentum traders, $3,000 is the major psychological breakout level.
For longer-term investors, $3,500 and $4,000 are the bigger upside zones.
For risk management, $2,650, $2,560 and $2,450 are the levels I would not ignore.
The setup is simple:
Above $2,730, momentum can expand.
Above $2,800, $3,000 comes into focus.
Above $3,000, the market can start targeting $3,200–$3,500.
Below $2,650, caution increases.
Below $2,560, the bullish structure weakens.
And below $2,450, I would completely reassess the trend.
Bitmine has already made its move.
6 million ETH.
Nearly 4.9% of Ethereum’s total supply.
A target of 5%.
Approximately $16 billion in ETH exposure at current prices.
Potentially $18 billion at $3,000.
Approximately $21 billion at $3,500.
Approximately $24 billion at $4,000.
Approximately $30 billion at $5,000.
This is no longer just a corporate treasury story.
It is becoming part of Ethereum’s market structure.
Now the only question is whether ETH can turn this institutional demand into the next major price expansion.
For me, the first answer comes at $2,730.
Break that level with volume, and the next battle begins at $2,800.
Break $2,800, and $3,000 becomes the number everyone will be watching.
The Ethereum story is getting bigger.
And Bitmine is making sure the market cannot ignore it.
Data note: ETH market data used above is based on October 6, 2026 market readings; Bitmine’s 6M+ ETH milestone was reported after its latest purchase. #OneGateWitnessProgram #ShareWeekly
repost-content-media
#CFTCProposesNew���CryptoAssetMarket”Category
CFTC JUST OPENED A NEW CHAPTER FOR US CRYPTO MARKETS
The biggest crypto story right now may not be a new token, ETF or price breakout.
It may be regulation.
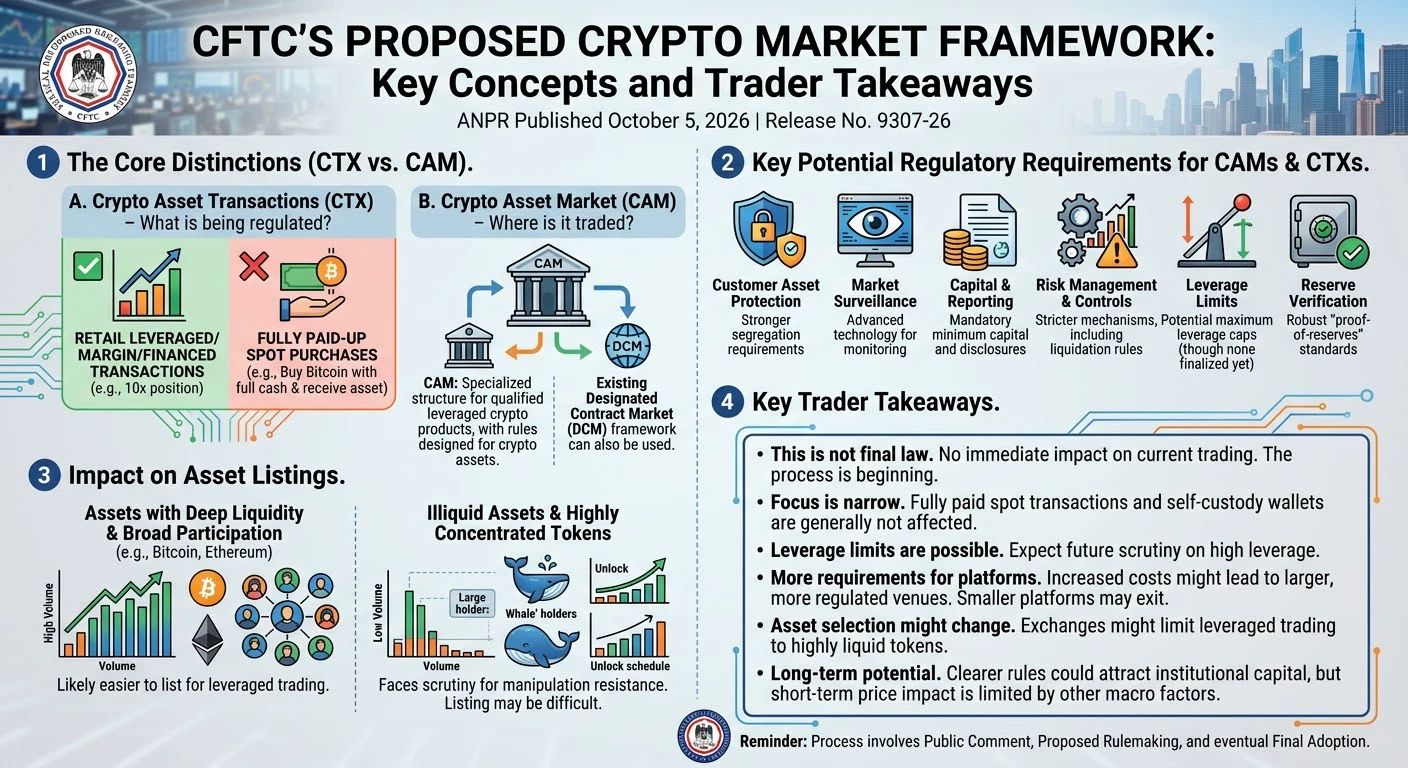
On October 5, 2026, the US Commodity Futures Trading Commission introduced a proposed framework built specifically around crypto markets, including two important concepts: Regulation CTX and Regulation CAM, alongside a proposed “Crypto Asset Market” category.
In my view, this is important because the CFTC is not simply talking about crypto regulation in general. It is trying to define how a sp
HighAmbition
#CFTCProposesNew���CryptoAssetMarket”Category
CFTC JUST OPENED A NEW CHAPTER FOR US CRYPTO MARKETS
The biggest crypto story right now may not be a new token, ETF or price breakout.
It may be regulation.
On October 5, 2026, the US Commodity Futures Trading Commission introduced a proposed framework built specifically around crypto markets, including two important concepts: Regulation CTX and Regulation CAM, alongside a proposed “Crypto Asset Market” category.
In my view, this is important because the CFTC is not simply talking about crypto regulation in general. It is trying to define how a specific part of the crypto trading market could operate under a clearer federal framework.
THE CORE IDEA: CRYPTO ASSET MARKET
The proposed Crypto Asset Market category is aimed at certain crypto trading activities involving retail customers and leveraged, margined or financed exposure.
The objective is to create a clearer federal pathway for eligible platforms rather than leaving market participants to navigate uncertainty across different regulatory requirements.
One important point is that this pathway would be optional.
The proposal does not automatically force every crypto exchange into the framework. Eligible platforms could choose whether to pursue the proposed federal registration route.
That makes adoption one of the biggest questions.
If major platforms participate, the framework could become much more significant for the US crypto industry.
REGULATION CTX: THE TRANSACTION SIDE
Regulation CTX, or Crypto Asset Transactions, focuses on retail commodity transactions involving crypto assets that are financed, margined or leveraged.
This matters because leveraged trading creates risks that are very different from ordinary spot buying.
A trader purchasing $1,000 of spot Bitcoin has direct exposure to the asset.
A trader using leverage can control a much larger position, creating additional liquidation, counterparty and market-risk concerns.
The CFTC is therefore attempting to establish clearer rules around these transactions.
One particularly important element is the proposed treatment of delivery.
The framework considers delivery of a crypto asset to a customer's own non-custodial wallet within 28 days as actual delivery.
For crypto users, this is significant because it recognises the unique ability of digital assets to be transferred directly into a wallet controlled by the customer.
For regulators, it creates a clearer definition of delivery within a digital-asset environment.
REGULATION CAM: THE MARKET STRUCTURE SIDE
Regulation CAM, or Regulation Crypto Asset Markets, addresses the trading platform itself.
Under the proposal, qualifying crypto markets could have an optional federal registration pathway within the CFTC's Designated Contract Market framework.
But that pathway would come with responsibilities.
The proposed framework includes areas such as proof of reserves, anti-money-laundering controls, market surveillance, anti-manipulation measures and customer-trade intermediation through registered Futures Commission Merchants.
This makes CAM much more than a simple licensing proposal.
It is an attempt to establish what a regulated crypto trading venue should actually look like.
PROOF OF RESERVES COULD BE A MAJOR CHANGE
For me, proof of reserves is one of the most important parts of the proposal.
Crypto markets have already shown what can happen when users cannot properly understand the financial condition of a platform.
A stronger reserve-verification framework could improve transparency and give users, institutions and regulators better visibility into customer assets.
It does not eliminate every risk.
But it could reduce uncertainty around whether platforms have sufficient assets to support their obligations.
That could become particularly important for institutional participation.
WHY FCM INTERMEDIATION MATTERS
The proposed role of registered Futures Commission Merchants could add another layer of regulated infrastructure between customers and the trading market.
This could increase compliance and operational costs, but it may also make crypto markets easier for traditional financial institutions to understand and access.
For institutional capital, predictable infrastructure matters.
Regulation alone does not bring capital into a market.
Clear rules, custody, reporting, surveillance and risk controls create the infrastructure that allows capital to participate with greater confidence.
THE LEVERAGE QUESTION IS STILL OPEN
Another major issue is leverage.
The CFTC has not simply imposed one fixed leverage limit through this proposal.
Instead, it is seeking feedback on what restrictions should apply.
This creates a difficult balance.
Excessive leverage can increase retail losses, liquidations and systemic risk.
But extremely restrictive leverage could push sophisticated traders toward offshore platforms.
The final approach could therefore affect liquidity, competition, trading volume and where US customers choose to trade.
This is one of the most important areas I will be watching as the proposal develops.
WHAT THE PROPOSAL DOES NOT SOLVE
This is just as important as what it does.
The proposal does not create a universal federal framework for every crypto transaction.
Its main focus is certain retail transactions involving financing, margin or leverage.
Ordinary spot crypto trading without those features is not automatically brought under this new category.
The broader US crypto market-structure debate therefore remains unfinished.
Congress also remains important because the CFTC cannot simply require every crypto asset to trade on a CFTC-regulated platform without the necessary congressional authority.
So this is a major step, but it is not the final rulebook.
THE BIGGEST POTENTIAL BENEFIT
The biggest potential benefit is regulatory clarity.
For years, uncertainty has been one of the biggest challenges for the US crypto industry.
Exchanges need to understand the rules before building infrastructure.
Institutions need predictable compliance requirements before deploying capital.
Traders need confidence that platforms operate under meaningful standards.
A clearer federal framework could reduce some of that uncertainty.
It could also make the US market more attractive to companies and institutions that currently view regulatory complexity as a major barrier.
BUT REGULATION ALSO HAS A COST
There is another side to this story.
Proof-of-reserves systems cost money.
Market surveillance requires technology.
AML compliance requires people and monitoring.
FCM involvement can add additional operational complexity.
Large platforms may be able to absorb these costs more easily than smaller companies.
That means stronger regulation could improve market quality while also increasing consolidation and making competition harder for smaller platforms.
MY MARKET VIEW
I see this announcement as a long-term structural catalyst rather than an immediate price catalyst.
The market has not exploded higher because this is still a proposal.
The framework can change.
Public comments can influence the final direction.
Platforms still have to decide whether they want to participate.
Congress still has a role.
Implementation is still ahead.
That means I would not trade the headline alone.
I would watch whether the proposal begins turning into actual market adoption.
If major exchanges move toward the framework, institutional interest increases and the final rules remain workable, the longer-term impact could be much larger than today's market reaction suggests.
BTC is currently around $85,334, with $86,000–$86,716 acting as the key breakout zone.
ETH is around $2,697, with $2,734 as an important resistance.
SOL is around $119.79, with $122 as the near-term breakout level.
These levels matter for short-term trading, but they are secondary to the regulatory development itself.
MY FINAL TAKE
The most important thing about the CFTC announcement is that it moves the conversation from “How should crypto be regulated?” toward a much more practical question:
“What should a regulated crypto market actually look like?”
CTX focuses on the transaction side.
CAM focuses on the market-structure and platform side.
Proof of reserves focuses on transparency.
Market surveillance focuses on market integrity.
AML controls focus on compliance.
FCM involvement adds another layer of regulated infrastructure.
And the optional federal pathway could give eligible platforms a clearer route into the US regulatory system.
There are still major questions around leverage, implementation, spot markets, compliance costs and congressional authority.
But the direction is important.
If this framework eventually becomes workable and widely adopted, it could help build a more transparent, institution-friendly and clearly structured US crypto market.
For me, that is the real story.
This is not simply about today's Bitcoin candle.
It is about who will build the next generation of US crypto market infrastructure, under what rules, and with what level of transparency.
The CFTC has not finished the rulebook.
But it has started writing a new chapter.
#OneGateWitnessProgram #ShareWeekly
repost-content-media
Market updates
live-replay-cover
701 views10-06 11:41
01:05:13
Market updates
live-replay-cover
105 views10-05 12:08
00:10:34
#CorePCEandGDPFinalReading
Core PCE and the Final GDP Reading: What the Hard Numbers Actually Changed
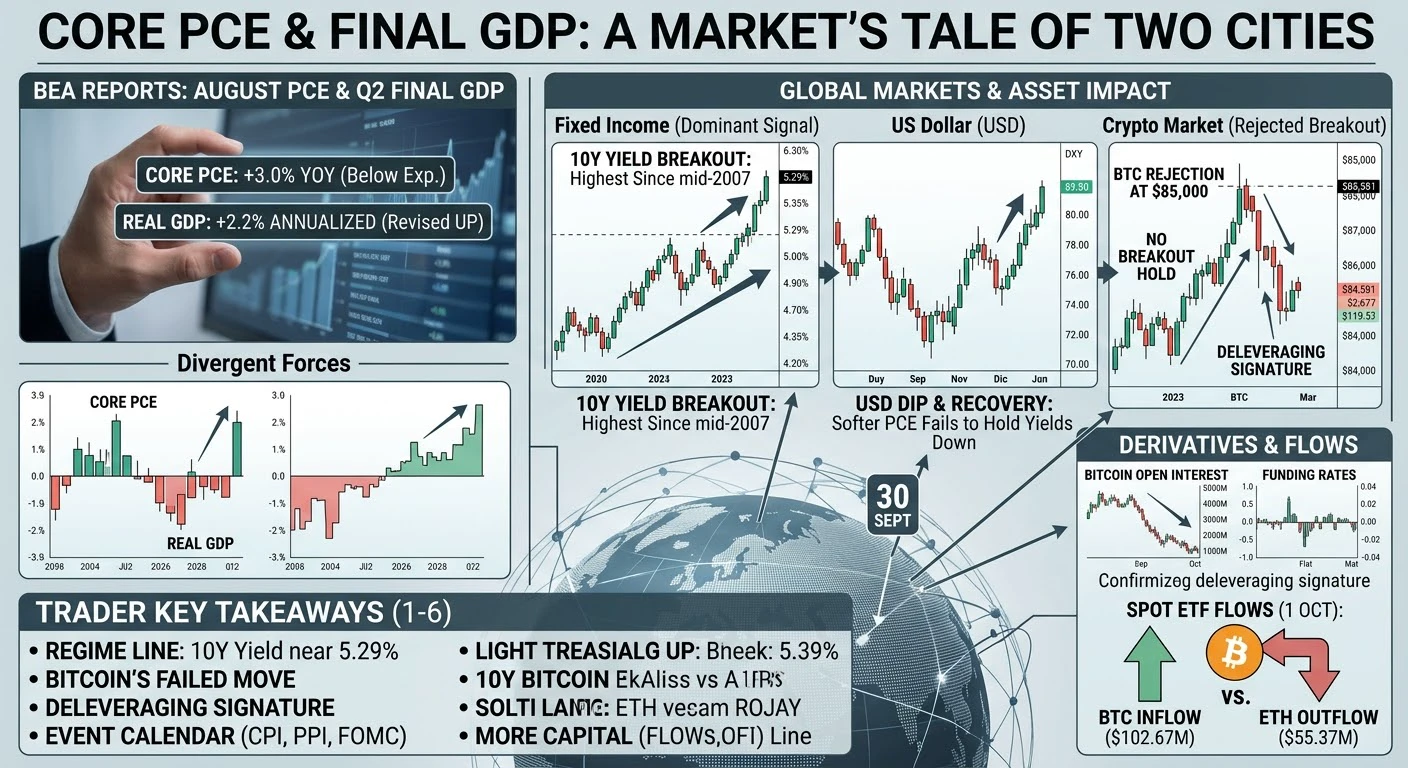
On 30 September, two of the most important US releases landed in the same hour, and they pulled in opposite directions. The Bureau of Economic Analysis published the third and final estimate of second quarter GDP, alongside the August personal income and outlays report that carries the PCE price index. One number said the economy is running hotter than anyone thought. The other said inflation pressure is quietly cooling. For crypto traders, the interesting part is the gap between them and wha
HighAmbition
#CorePCEandGDPFinalReading
Core PCE and the Final GDP Reading: What the Hard Numbers Actually Changed
On 30 September, two of the most important US releases landed in the same hour, and they pulled in opposite directions. The Bureau of Economic Analysis published the third and final estimate of second quarter GDP, alongside the August personal income and outlays report that carries the PCE price index. One number said the economy is running hotter than anyone thought. The other said inflation pressure is quietly cooling. For crypto traders, the interesting part is the gap between them and what the market did with it.
The inflation side came in soft. The headline PCE price index rose 3.4 percent year over year in August against expectations near 3.7 percent, and 0.4 percent month over month. The core measure, which strips out food and energy and is the Federal Reserve's preferred inflation gauge, rose 3.0 percent year over year and 0.2 percent month over month, again below expectations. That is a meaningful downside miss for a market that had priced sticky inflation. The revisions were even more striking. The second quarter PCE price index was revised down to 5.0 percent from 5.3 percent, and the core version was revised down by 0.3 percentage point to 3.3 percent, with the broader gross domestic purchases price index at 5.6 percent. Core PCE has printed above 3 percent in every single month of 2026, so this is disinflation from a high base, not a return to target.
The growth side came in hot. Second quarter real GDP was revised up to 2.2 percent annualised from the second estimate of 1.5 percent, against forecasts that expected no change. Current dollar GDP rose 8.5 percent. Real final sales to private domestic purchasers, the cleanest read on underlying domestic demand, came in at 4.6 percent. Consumer spending was revised up to 3.8 percent. Real gross domestic income rose 2.6 percent, and the average of GDP and GDI, the most reliable single growth measure, reached 2.4 percent. The GDP price index was 6.1 percent. Regionally, 44 states plus the District of Columbia grew, with New York at 4.0 percent and West Virginia weakest at minus 2.3 percent. So the scoreboard reads growth revised up by 0.7 percentage point and quarterly inflation revised down by 0.3 percentage point, which is nominally the soft landing combination.
The policy backdrop matters here: the Federal Reserve raised rates by 25 basis points at its September meeting, and a majority of officials projected at least one more hike before the end of 2026. A softer core PCE reading lowers the urgency of that second move, and one board member argued publicly that there is no need to hurry. That is why the inflation miss mattered more than the growth beat for holders of fixed supply assets.
The bond and currency markets did not read it the way the headline suggested. Yields initially dropped on the softer PCE, then reversed hard. By the close the 2 year was 4.8953 percent, the 5 year 5.0913 percent and the 10 year 5.2912 percent, roughly 3.6 basis points higher on the day, while the 30 year climbed about 8 basis points to 5.647 percent. The 10 year is sitting at its highest level since mid 2007, the single most important cross asset fact in this release. The dollar dipped to 101.02 on the inflation print, then recovered to around 101.30 and finished firmer. Gold could not hold its bid and closed at 4,158.47 dollars an ounce, down 0.56 percent, with silver at 60.41 dollars, down 1.70 percent. Equities opened in relief, then faded, and the Dow finished September at its June lows.
Crypto followed the same shape. Bitcoin pushed above 85,000 dollars after the release, failed to hold the breakout and slipped back below 84,000. BTC trades at 84,581 dollars, down 1.58 percent over 24 hours but still up 0.72 percent over seven days, inside a 24 hour range of 83,883 to 87,236 dollars. That rejection at 85,000 is the level the chart is built around. ETH is at 2,677 dollars, down 1.52 percent, and SOL is at 119.57 dollars, down 1.93 percent. Market wide, total crypto capitalisation is about 1.699 trillion dollars on 24 hour volume of roughly 326.6 billion dollars across 4,145 active coins. BTC dominance is 59.05 percent, ETH dominance 11.35 percent, the altcoin season index is 55 and the fear and greed reading is 67. In plain terms, liquidity is decent but capital is still parked in majors and is not rotating down the risk curve.
Derivatives tell the more interesting story. Bitcoin open interest is about 54.31 billion dollars, down 3.22 percent over 24 hours, with funding at 0.0016, a long short ratio of 1.32 and a taker buy sell ratio of 0.9904, meaning aggression sits marginally on the sell side. BTC options open interest is 2.66 billion dollars. Ethereum open interest is 33.89 billion dollars, down 1.72 percent, with funding at 0.0031, a taker ratio of 0.9873 and options open interest of 1.05 billion dollars. Falling open interest into a failed breakout is a deleveraging signature, not an accumulation one. Flows are split. Bitcoin spot ETFs took in 102.67 million dollars net on 1 October after a 148.69 million dollar outflow on 30 September, with total ETF assets near 109.34 billion dollars and 1.97 billion dollars of value traded. Ethereum ETFs saw a 55.37 million dollar net outflow, with assets around 17.71 billion dollars and 539.59 million dollars traded.
Two days later the September employment report cut the other way. Payrolls rose just 29,000 against expectations near 84,000, unemployment ticked up to 4.2 percent, wages rose only 0.1 percent month over month and 3.0 percent year over year, and the prior two months were revised down by a combined 60,000 jobs. Weak labour data reduces the case for further tightening. The macro mix now reads as strong demand, cooling prices and a softening labour market, which is a friendlier mix for risk assets.
Item by item, here is what was affected. The dollar briefly weakened on the inflation miss, then firmed on the yield move. Treasury yields rose across the curve, with long end pressure the dominant signal. Gold and silver fell despite softer inflation, because real yields rose. Equities saw initial relief, then faded. Rate expectations shifted toward a hold in October after the PCE print, and the weak jobs number softened the tightening case further. Crypto majors delivered a rejected breakout and a slow bleed. Altcoins saw no rotation, with dominance still sitting with Bitcoin. Derivatives showed lower open interest, modest positive funding and slightly more aggressive sellers. ETF flows were positive for BTC and negative for ETH. Stablecoin balances showed no surge, so no wave of fresh collateral entered the system. Higher long yields feed into mortgage rates, credit spreads and emerging market currencies, and those channels eventually reach crypto through the same liquidity pool.
For traders studying this setup, six things deserve attention. First, the 10 year yield near 5.29 percent with the 30 year above 5.6 percent is the regime line; when long yields rise despite soft inflation data, the bond market is pricing term premium and supply rather than the policy rate, and risk assets struggle in that environment. Second, Bitcoin's failed move above 85,000 and the 24 hour low near 83,900 define the immediate range, with 82,700 flagged earlier in the week underneath and 85,000 as the level that would repair momentum. Third, falling open interest with flat funding is a deleveraging signature, which usually means less forced selling if price holds but also less fuel for a fast squeeze. Fourth, divergent ETF flows matter more than the totals, because BTC absorbing net creations while ETH bleeds shows where institutional preference currently sits. Fifth, the event calendar is dense, with CPI on 13 October, PPI on 14 October, the FOMC decision on 27 to 28 October and the advance reading of third quarter GDP on 29 October, so position sizing around those dates is a risk decision rather than a directional one. Sixth, keep the two data sets separate in your head: soft inflation is supportive, but strong growth with rising long yields is not, and on 30 September the second force won, which is why crypto drifted even though the inflation number looked friendly.
#ShareWeekly
repost-content-media
  • 3
#AnthropicDiscloses$84.5BComputeDealWithSpaceX
🚀 ANTHROPIC × SPACEX: THE $84.5B AI COMPUTE DEAL AND WHY TRADERS SHOULD CARE
The AI infrastructure race is accelerating, and Anthropic’s newly disclosed agreements with SpaceX/xAI-linked NVIDIA-based computing capacity could represent up to $84.5B of spending through 2029.
But traders need to understand one critical point: $84.5B is a maximum potential multi-year commitment, not an upfront $84.5B cash payment or guaranteed immediate revenue. The agreements are reportedly mostly cancellable with 90 days’ notice.
That distinction matters when eval
HighAmbition
#AnthropicDiscloses$84.5BComputeDealWithSpaceX
🚀 ANTHROPIC × SPACEX: THE $84.5B AI COMPUTE DEAL AND WHY TRADERS SHOULD CARE
The AI infrastructure race is accelerating, and Anthropic’s newly disclosed agreements with SpaceX/xAI-linked NVIDIA-based computing capacity could represent up to $84.5B of spending through 2029.
But traders need to understand one critical point: $84.5B is a maximum potential multi-year commitment, not an upfront $84.5B cash payment or guaranteed immediate revenue. The agreements are reportedly mostly cancellable with 90 days’ notice.
That distinction matters when evaluating SPCX’s valuation, future revenue and cash-flow potential.
1. WHY THIS DEAL MATTERS
Anthropic has become one of the leading AI companies through Claude, Claude Code and enterprise AI products. Its rapid growth is creating an enormous need for computing capacity.
Anthropic reportedly generated nearly $4.6B revenue in 2025, around 12× the previous year, while computing and infrastructure spending reached approximately $7.33B.
This shows the next phase of AI is not only about software.
AI growth requires:
AI models → GPUs → data centers → networking → electricity → cooling → computing capacity
The companies controlling these infrastructure layers could become increasingly important to investors.
2. THE $84.5B SPACE
The newly disclosed maximum of up to $84.5B through 2029 is significantly larger than the roughly $45B arrangement previously disclosed.
Earlier reporting indicated payments could reach approximately $1.25B per month as capacity ramps toward full deployment.
However, the headline number should not be treated as guaranteed revenue.
The important variables are:
• How much capacity Anthropic actually uses
• How quickly infrastructure comes online
• Pricing and contract economics
• Cancellation rights
• Utilization rates
• Capital expenditure
• Operating margins
• Actual cash generation
For SPCX investors, contract quality matters more than headline size.
3. SPACE X IS EXPANDING THE AI STORY
SpaceX’s Colossus infrastructure gives the company an opportunity to monetize large-scale computing alongside aerospace and satellite operations.
The Anthropic arrangement has previously been described as providing access to more than 300 MW of new capacity and over 220,000 NVIDIA GPUs at Colossus 1.
That creates a major structural opportunity.
If SpaceX can continue expanding AI infrastructure and securing large customers, investors may increasingly value its computing operations alongside its traditional businesses.
But expansion also requires enormous capital.
More GPUs, power infrastructure, networking and facilities can increase potential revenue while simultaneously increasing investment requirements.
4. SPCX MARKET ACTION
The Oct. 2 close provides an important trading snapshot:
SPCX: $158.96
Daily change: +7.35%
Session high: ~$159.84
Session low: ~$149.34
Volume: ~119.42M shares
Market value: ~$2.10T
The market value is consistent with approximately 13.2B shares outstanding × $158.96 ≈ $2.10T.
SPCX had closed at approximately $148.07 on Oct. 1, down 1.85%, before rebounding strongly on Oct. 2.
From the Sept. 25 close near $148.67 to Oct. 2 at $158.96, the stock gained roughly 6.9%.
The key technical area is now around $159–$160.
A sustained move above the recent $159.84 high, supported by strong volume, would indicate that buyers are willing to defend higher prices.
A rejection around $160 could instead trigger profit-taking toward the $150–$148 area.
These are market levels to monitor, not guaranteed targets.
5. NVIDIA: THE HARDWARE CONNECTION
NVIDIA remains one of the most important companies in the AI-compute chain because the SpaceX infrastructure discussed in the agreements uses NVIDIA-based computing hardware.
NVDA Oct. 2 close: ~$233.95
Daily change: +1.34%
Session high: ~$237.88
Volume: ~134.2M shares
Market value: ~$5.59T
The broader implication is straightforward:
If AI companies continue securing massive computing capacity, demand can remain strong for GPUs, networking equipment and supporting data-center infrastructure.
The Anthropic–SpaceX relationship therefore connects directly to the wider semiconductor and data-center investment cycle.
6. THE $518B BIGGER PICTURE
The most important number may actually be larger than $84.5B.
Anthropic has disclosed expectations for at least $518B of infrastructure commitments across partners.
Reported figures include approximately:
• Google: $111.1B
• Amazon: $110B
• Microsoft: $31.4B
• SpaceX/xAI-linked capacity: up to $84.5B
Additional commitments involve companies such as Broadcom and AMD.
This demonstrates the scale of the AI infrastructure race.
The competition is no longer simply about who builds the best AI model.
It is increasingly about who can secure enough compute, power and infrastructure to scale those models economically.
7. WHAT TRADERS SHOULD WATCH
For SPCX, focus on:
• $159–$160 resistance zone
• ~$159.84 recent hig
• $150–$148 nearby support area
• Volume confirmation on breakouts
• Data-center capacity expansion
• Customer utilization
• Contract duration and cancellation terms
• Capital expenditure versus cash generation
• Revenue growth versus valuation
For NVDA, monitor whether expanding AI infrastructure continues translating into sustained GPU and networking demand.
For Anthropic, watch revenue growth, compute spending, customer concentration, infrastructure commitments and the path toward sustainable profitability.
8. LIQUIDITY MATTERS MORE THAN THE HEADLINE
The $84.5B headline can attract immediate attention, but professional traders should focus on how the market actually prices the information.
SPCX traded approximately 119.42M shares on Oct. 2, with a closing price of $158.96. That implies roughly $19B of share turnover using volume × closing price as a simple approximation.
High volume confirms strong participation, but it does not automatically mean bullish continuation.
The better question is:
Is price moving higher because buyers are accumulating, and is volume confirming the move?
That is more useful than simply assuming a large AI contract means the stock must rise.
9. THE BROADER MARKET IMPACT
The deal potentially strengthens several AI-related themes:
Semiconductors: Greater compute demand can support accelerator demand.
Data centers: More AI workloads require servers, cooling and networking.
Energy: Large-scale AI facilities require substantial electricity and power infrastructure.
Networking: Massive GPU clusters require high-speed interconnects.
Cloud infrastructure: AI companies are increasingly securing dedicated computing capacity.
Technology valuations: Strong AI demand can support infrastructure companies, although elevated valuations also increase downside risk if growth expectations weaken.
For Bitcoin and crypto, the impact is indirect. Strong technology risk appetite can support broader market sentiment, but the Anthropic–SpaceX agreement is not a direct BTC fundamental catalyst.
10. FINAL TRADING VIEW
The Anthropic × SpaceX relationship is important because it shows how rapidly AI infrastructure requirements are expanding.
Anthropic brings AI demand and rapidly growing model usage.
SpaceX brings large-scale infrastructure and computing capacity.
NVIDIA supplies a critical layer of the hardware powering that compute.
But traders should separate headline value from realized financial value.
The $84.5B figure is a maximum potential multi-year commitment, not immediate guaranteed revenue.
For SPCX, the immediate market question is whether the stock can sustain momentum around $159–$160 with healthy volume.
For NVDA, the key question is whether AI infrastructure spending continues producing durable hardware demand.
And for Anthropic, the long-term test is whether revenue can grow faster than the enormous cost of compute and infrastructure
Price + Volume + Contract Quality + Capacity + Revenue + Cash Flow + Valuation
That combination provides a much stronger framework than the $84.5B headline alone.$NVDA ‌
$SPCX ‌
repost-content-media
  • 1
#ETHEarningsUpTo5%BonusAPR
Ethereum at $2,683 — Earn up to 5% Bonus APR While ETH Holds a Pivotal Range
Ethereum is trading right around $2,683, down about 2.63% over the last 24 hours and nearly flat over the past seven days at roughly negative 0.35%, and that combination of a sideways price and a live yield offer is exactly why this window is worth attention. Gate is currently running an ETH earning campaign where users who net deposit at least 0.3 ETH and subscribe to the 7-day fixed-term Simple Earn product can earn an additional 5% bonus APR on top of the base yield, with the bonus paid
HighAmbition
#ETHEarningsUpTo5%BonusAPR
Ethereum at $2,683 — Earn up to 5% Bonus APR While ETH Holds a Pivotal Range
Ethereum is trading right around $2,683, down about 2.63% over the last 24 hours and nearly flat over the past seven days at roughly negative 0.35%, and that combination of a sideways price and a live yield offer is exactly why this window is worth attention. Gate is currently running an ETH earning campaign where users who net deposit at least 0.3 ETH and subscribe to the 7-day fixed-term Simple Earn product can earn an additional 5% bonus APR on top of the base yield, with the bonus paid out in USDT from a 100,000 USDT pool on a first-come, first-served basis. The campaign runs until October 7 at 19:00 UTC+8, so there are only a few days left. In plain terms, you can get paid a small extra yield just for holding ETH for one week while the market figures out its next move.
Let me put the numbers into context. ETH's 24-hour range has been between $2,650 and $2,769, a span of about 4.5%, with the market capitalization sitting near $325.76 billion. Over the past 24 hours ETH slipped roughly 2.63%, but on the weekly view the move is essentially flat at negative 0.35%, which tells you this is a choppy, range-bound market rather than a strong trend in either direction. That $2,650 low and $2,769 high are the two numbers the market is currently fighting over, and they give us a clean framework for the levels below.
The dominant catalyst this week was the September US jobs report released on October 2, and it landed soft. Nonfarm payrolls rose by only 29,000, far below the roughly 84,000 to 90,000 that economists expected, while the unemployment rate ticked up to 4.2% from 4.1%, and the prior two months were revised down by a combined 60,000 jobs. Wage growth also slowed to about 3.1%. This matters for Ethereum because it forced markets to sharply cut the odds of another Fed rate hike at the October 27-28 FOMC meeting. A cooling labor market argues for the Fed to pause, and pauses are generally supportive for risk assets like ETH. On the other side, the backdrop remains inflationary, with energy prices surging on geopolitical tension, and that is the exact reason the Fed raised rates in September to a 3.75% to 4.00% target range. So the market is now balancing a softer jobs picture against sticky inflation, and that tug-of-war is what is keeping ETH range-bound.
On the institutional side, ETH spot ETFs printed a net outflow of roughly $55.37 million on October 1, which suggests some traditional investors were trimming exposure into the jobs report, with total ETF assets around $17.71 billion. In the derivatives market, the long/short ratio is near 1.68, a mild bullish lean, while aggregate open interest sits around $33.98 billion and dipped about 1.2% over 24 hours. Funding is close to neutral at about 0.03%, meaning neither longs nor shorts are paying an extreme premium. The combined read is that leverage is not overheated, so there is room for a squeeze in either direction without a crowded, fragile setup.
Technically, ETH is in a neutral zone. The RSI is near 45, which is neither oversold nor overbought, and the short-term moving averages are flattening, which is the classic signature of a market waiting for a catalyst. The first support to defend is $2,650, and just below that sits the lower Bollinger band around $2,637, with a deeper structural level near $2,528. On the upside, the first resistance is the cluster between $2,690 and $2,702, where several key moving averages converge, followed by the upper Bollinger band around $2,734 and then the recent swing high near $2,769. In percentage terms, from the current $2,683 level, a move to $2,700 is about plus 0.62%, to $2,734 is plus 1.88%, and to $2,769 is plus 3.2%, while a break to $2,637 is minus 1.72% and a drop to $2,528 is minus 5.77%. Those are the distances the market is actually pricing, and they make the risk and reward very concrete.
Looking at the next seven days, the calendar is loaded. The CPI report lands on October 13 and the PPI report on October 14, and then the FOMC decision comes on October 27-28. Because the jobs number was so weak, the base case has shifted toward the Fed holding rates steady at the next meeting, and any confirmation that inflation is not re-accelerating would likely be a tailwind for ETH. My base scenario is range-bound action between roughly $2,637 and $2,769 until the CPI print, with a decisive daily close back above $2,700 as the earliest signal that buyers are stepping back in. If CPI comes in hot, expect a fast retest of $2,637 and potentially $2,528. If it cools, $2,769 becomes the first upside target, and a push back toward $2,800 territory opens up.
The way I think about this is to combine the yield with the setup instead of chasing price. The 5% bonus APR only applies to the 7-day fixed subscription, so the natural play is to net deposit at least 0.3 ETH, subscribe for the seven days, and let the USDT bonus accrue while the macro calendar resolves. To be honest about the math, on 0.3 ETH at roughly $2,683, a 5% annualized bonus over seven days is about 0.096% of the principal, or roughly $0.77, which is why I treat the bonus as a small enhancement and the base yield and price direction as the real drivers. On the trading side, I would rather accumulate near $2,650 to $2,637 with a stop below $2,528 than chase strength into $2,700, because the reward-to-risk is meaningfully better at support. Position sizing matters more than the entry in a week like this, so a smaller position with a clearly defined stop beats a large one without one, and I would not average down into a confirmed breakdown below $2,528.
I want to be direct about the risks because they are real. Nothing in this setup is guaranteed. The 5% bonus APR is an annualized estimate, the bonus pool is capped at 100,000 USDT and paid first-come, first-served, and the effective reward depends on how many participants join before you. Earning products are not principal-guaranteed, yields are estimates that can vary, and ETH itself can move down by more than any bonus pays in a single day. A 5% annualized bonus on a one-week lock is tiny relative to the price swings ETH can make on a single macro print, so treat the bonus as a modest extra, not the reason to hold.
repost-content-media
ETH-1.08%
  • 2
#MicronReportQ4Earnings
Micron Technology (NASDAQ: MU) closed out fiscal 2026 on September 30 with the biggest quarter in its history, and the two-day reaction says more about positioning than about the numbers. Revenue landed at $54.23 billion, up 379% year over year and roughly 31% quarter over quarter, a sixth consecutive record. Non-GAAP EPS was $33.42 against roughly $31.3 to $31.6 expected, a beat of about 6%, and non-GAAP gross margin hit 87.0%, up 210 basis points sequentially from 84.9%. GAAP net income was $37.7 billion, with non-GAAP operating income of $44.64 billion, or 82.3% of
HighAmbition
#MicronReportQ4Earnings
Micron Technology (NASDAQ: MU) closed out fiscal 2026 on September 30 with the biggest quarter in its history, and the two-day reaction says more about positioning than about the numbers. Revenue landed at $54.23 billion, up 379% year over year and roughly 31% quarter over quarter, a sixth consecutive record. Non-GAAP EPS was $33.42 against roughly $31.3 to $31.6 expected, a beat of about 6%, and non-GAAP gross margin hit 87.0%, up 210 basis points sequentially from 84.9%. GAAP net income was $37.7 billion, with non-GAAP operating income of $44.64 billion, or 82.3% of revenue. My read: this is not a cyclical top being priced in. It is the market slowly accepting that memory has become a strategic AI input rather than a commodity that gets re-rated every two years.
The print mattered less than the guide, and the guide was the loudest part of the release. For fiscal Q1 2027 Micron guided revenue of $61.5 billion, plus or minus $1.5 billion, against consensus nearer $56.3 to $56.8 billion, roughly 8% above the Street, with non-GAAP EPS of $38.15 versus about $36.02 expected and gross margin of approximately 86.25%. That implies about 13% sequential revenue growth into the next quarter, and management said it expects sequential growth in every quarter of fiscal 2027. When a company this large guides 13% quarter-over-quarter growth and still says supply and demand will be much tighter in 2027 and 2028 than in 2026, you are not looking at a normal cycle.
The segment detail shows where the money comes from. Cloud Memory revenue reached $16.28 billion at an 83% gross margin, Core Data Center hit $18.0 billion at 90%, and Mobile and Client contributed $13.11 billion at 90%. Data center SSDs alone approached $10 billion, more than ten times the year-ago level and more than two-thirds of total NAND revenue. Full-year fiscal 2026 revenue was $133.19 billion, up 256%, with DRAM revenue above $100 billion for the year, gross margin of 81.1% and EPS of $75.52, up 811% year over year. Cloud and data center together now account for close to two-thirds of the business. That mix shift is the whole story: the AI buildout does not need a consumer electronics recovery to keep Micron's fabs full.
Then there is HBM, which is where the AI chip and semiconductor theme actually lives for Micron. HBM revenue grew faster than total company revenue in the quarter, and management said the vast majority of calendar 2027 HBM bit supply is already contracted at significantly higher year-over-year prices. The company has signed 26 strategic customer agreements covering about 35% of revenue through 2030, with more than 75% of 2027 output committed and roughly $150 billion in remaining performance obligations. Micron is also working with Nvidia on an industry-first custom HBM4E implementation for next-generation GPUs and NVLink Fusion platforms. As the only major US-based HBM manufacturer, Micron sits directly in the path of every accelerator shipped by Nvidia (NASDAQ: NVDA) and AMD, and its 1-gamma DRAM and G9 NAND nodes are now its largest production nodes, with next-generation nodes moving to volume production in the second half of calendar 2027.
The catch, and the reason the stock wobbled right after the release, is capital spending. Micron plans to lift fiscal 2027 capex above its earlier plan to more than $50 billion, nearly double fiscal 2026's high-twenties level, with roughly $11.5 billion in fiscal Q1 and about $25 billion in the first half alone. Most of the increase is construction aimed at cleanroom space arriving in late calendar 2028 and beyond: ID1 output is targeted for mid-2027, ID2 for late 2028, a Japan DRAM expansion for late 2028, and the first New York fab for calendar 2030. A broad employee compensation increase is also expected to nudge margins below prior analyst forecasts. I treat this as the honest cost of locking in the supercycle rather than a red flag, but it is exactly the mechanism that historically ends memory cycles, so the number to respect is capacity arriving in 2028.
Now the trading picture, because that is where the next ten days get decided. Micron closed September 29 at $1,065.08, sold off 1.72% to $1,046.79 as the capex headline hit, then buyers stepped back in and pushed it toward $1,090. Recent sessions have traded a $1,022.90 to $1,098.90 range, with an intraday print as high as $1,107.86 and a previous close of $1,097.39. Liquidity is heavy: volume has run between roughly 26.5 million and 45.7 million shares against an average daily volume of about 28 million to 34 million, with the 50-day average nearer 46.5 million. Market cap sits around $1.21 trillion to $1.24 trillion, beta over the last twelve months is about 3.31, and the stock is up roughly 270% to 277% year to date, 485% to 550% over twelve months, 193% in six months and 12.4% in the past month, against a 52-week range of about $160 to $1,255. Valuation is doing a lot of arguing for the bulls: the trailing P/E is roughly 14.3 to 14.8 and the forward P/E is near 6.2, on trailing EPS of about $74 to $75.50.
Key levels I am watching, in order. On the downside, the first shelf is $1,046 to $1,055, the post-earnings pivot where buyers defended the print. Below that comes $1,022 to $1,025, the reaction low, then the psychological $1,000 line. A deeper flush would find a well-tested band at $974 to $990, the pre-earnings consolidation that also maps to the classic pivot zone, and then the heavy support at $943 to $955, roughly 11.8% below the recent high, which screens as the strongest technical floor in the current structure. If that fails, the next measured shelf sits near $873, about 19.3% lower, and a move there would be the market voting for the oversupply thesis instead of the supercycle one. On the upside, the first test is $1,098 to $1,110; clearing it with volume opens a measured target near $1,134, then $1,200 and a retest of the 52-week high at $1,255.
The analyst map is unusually wide, and that spread is itself the trade. Post-earnings, Goldman Sachs raised its target to $1,250, Wells Fargo went to $1,220, Mizuho lifted to $1,400 and Rosenblatt jumped to $1,900 from $1,500, while Morningstar cut its fair value to $700. The street average sits near $1,496 to $1,520 across roughly 49 analysts, with a high of $2,000 to $2,200 and a low in the $361 to $852 range, and about 95% of ratings land on buy. That gap from $700 to $2,200 is not analyst sloppiness, it is genuine disagreement about how long the shortage lasts. The bull math is simple: if EPS is heading toward $150 to $160 next year, even a 10x multiple is a $1,500-plus stock, and a forward multiple near 6x is the cheapest this has been during a shortage. The bear math is equally simple: capex above $50 billion seeds 2028 supply, and that is what Morningstar's $700 fair value and Michael Burry's reported put position, struck near half the current price, are betting on.
So here is how I frame the next ten days. Base case, and I give it the highest odds, is a $1,030 to $1,130 digestion range, because the market has to absorb a $54 billion quarter, a $61.5 billion guide and a capex shock, and it rarely trends cleanly while doing that. Bull case is a reclaim of $1,110 on expanding volume, which sets up $1,150 to $1,200 if Nvidia and the broader chip tape stay bid; note that Micron's print lifted the whole sector, with the VanEck Semiconductor ETF near $608 and up about 69% this year. Bear case is a loss of $1,022 that opens $974 and then $943, and I want that move to come on above-average volume before taking it seriously, because a drift lower on light volume is noise. Two dates sit inside the window: the $0.15 quarterly dividend goes ex on October 14, a mechanical markdown, and the pending jobs report has been flagged as a market-wide swing factor while ten-year and thirty-year Treasury yields sit at their highest since 2002.
The signals I rely on, in order of weight. First, whether $1,022 to $1,046 holds on any flush, because that tells you institutions are accumulating rather than distributing, and the historical pattern here has been a beat, a dip and then a grind higher. Second, whether volume expands above $1,110, since breakouts in high-beta memory names without volume tend to fail. Third, the forward multiple near 6x, the strongest valuation argument on the board, which only works if EPS keeps compounding, so HBM4 qualification updates and any 2027 pricing news are the fundamental triggers to track. Fourth, management's own capex commentary, because another raise without matching demand signals is the one thing that would flip me from constructive to cautious on a 2028 view.
My verdict: Micron is the cleanest, highest-beta expression of two things at once, AI infrastructure demand and the onshoring of critical semiconductor supply, and a record quarter with a guide 8% above consensus and more than 75% of next year's output already sold deserves more than a two-day reaction. Fiscal 2026 revenue of $133.19 billion, up 256%, and EPS of $75.52, up 811%, are not the numbers of a company at the end of a cycle. But with a 3.31 beta, a 485%-plus twelve-month run and a legitimate 2028 supply debate, position size and stop placement matter more than conviction. Let levels, not opinions, decide your entries: $1,046 to $1,055 and $1,022 to $1,025 on the way down, $1,110 and $1,134 on the way up, with the street's $1,496 to $1,520 average as the medium-term magnet and $943 to $955 as the line that would genuinely damage the bull case.$MU ‌
repost-content-media
  • 2
#US30-YearTreasuryYieldHits5.595%,HighestSince2002
US 30-YEAR TREASURY YIELD AT 5.595%+ — WHY THIS MATTERS FOR STOCKS, CRYPTO & GLOBAL LIQUIDITY
THE 30-YEAR US TREASURY YIELD HAS ENTERED A MAJOR LONG-TERM ZONE
The headline “US 30-Year Treasury Yield Hits 5.595%, Highest Since 2002” matters because this is not simply a small move in the bond market. The 30-year Treasury yield has moved into a multi-decade high zone. Recent market data showed the 30-year yield reaching about 5.63% after earlier levels around 5.595%, while official Federal Reserve data for October 2 showed a 30-year constant-mat
HighAmbition
#US30-YearTreasuryYieldHits5.595%,HighestSince2002
US 30-YEAR TREASURY YIELD AT 5.595%+ — WHY THIS MATTERS FOR STOCKS, CRYPTO & GLOBAL LIQUIDITY
THE 30-YEAR US TREASURY YIELD HAS ENTERED A MAJOR LONG-TERM ZONE
The headline “US 30-Year Treasury Yield Hits 5.595%, Highest Since 2002” matters because this is not simply a small move in the bond market. The 30-year Treasury yield has moved into a multi-decade high zone. Recent market data showed the 30-year yield reaching about 5.63% after earlier levels around 5.595%, while official Federal Reserve data for October 2 showed a 30-year constant-maturity yield of 5.61%. The 30-year Treasury is one of the most important long-duration benchmarks in global finance.
When this yield rises, the required return on long-term US government debt rises. That can influence mortgage rates, corporate borrowing costs, equity valuations, credit markets, currencies and financial conditions. The key message for traders is that 5.595% is not just a number: it represents a much higher long-term return benchmark than the ultra-low-yield era.
WHAT DOES A 5.595% YIELD ACTUALLY MEAN?
A 5.595% Treasury yield means the market is pricing long-term US government debt at an annualized yield around 5.6%. On a simple calculation, $100,000 at 5.595% corresponds to about $5,595 of annual yield; $1 million corresponds to about $55,950; and $10 million corresponds to about $559,500, before taxes, reinvestment, price changes and the exact security structure.
These examples explain why institutions watch Treasury yields. However, 5.595% is not a guaranteed trading profit: Treasury prices and yields move in opposite directions, and realized returns depend on the security and purchase price.
WHY CAN INVESTORS BECOME MORE INTERESTED IN YIELD?
When a major sovereign bond market offers a much higher yield, fixed-income assets can become more competitive with risk assets. This does not mean every investor automatically sells crypto or stocks for Treasuries. But the opportunity cost of holding volatile assets changes when long-term government yields are much higher.
If long-term yields move from 3% to about 5.6%, the increase is roughly 2.6 percentage points, or about 87% relative to a 3% starting yield. That is a major change in the return environment.
For crypto traders, the important question is whether higher Treasury yields make investors demand a larger risk premium before adding exposure to BTC, ETH and high-beta altcoins. If that happens while liquidity weakens, valuations can become more sensitive to negative macro news.
HOW CAN HIGH TREASURY YIELDS AFFECT BITCOIN?
Bitcoin is influenced by global liquidity, real yields, dollar conditions, institutional flows, leverage and risk appetite. For traders, the framework is simple: higher yields plus a stronger dollar can create a headwind for BTC, while falling yields plus a weaker dollar can be more supportive.
The relationship is not one-to-one. Bitcoin can rise while Treasury yields rise if spot demand, ETF flows, liquidity or crypto-specific catalysts are strong. Likewise, BTC can fall even when yields decline if other risks dominate.
WHAT HAPPENS TO CRYPTO LIQUIDITY WHEN YIELDS STAY HIGH?
Liquidity is central to the transmission mechanism. When financing costs rise, businesses, funds and investors face a higher cost of capital. Higher yields can also make fixed-income allocations more attractive, potentially reducing the urgency to chase highly volatile assets.
For crypto, the effects can appear through lower leverage appetite, higher financing costs, more conservative allocation, reduced appetite for speculative altcoins and stronger reactions to US economic data and Fed communication.
Derivatives can amplify these moves. If BTC loses support while open interest remains high, leverage can increase forced liquidations. Liquidity should therefore be studied through spot volume, ETF flows, open interest, funding and liquidations.
WHAT ABOUT ETHEREUM AND ALTCOINS?
Ethereum and higher-beta altcoins can be more sensitive to changes in risk appetite. ETH has recently traded around the $2,650–$2,700 area, so traders should watch whether price strength is supported by real spot demand and volume.
Altcoins can react even more sharply because many have lower liquidity than BTC and ETH. When capital rotates toward BTC, cash or traditional fixed income, smaller tokens can experience larger percentage moves.
WHY DOES THIS MATTER FOR STOCKS AND CORPORATE BORROWING?
Treasury yields influence the cost of capital across the financial system. If the 30-year yield remains around 5.6%, companies issuing long-duration debt may need to offer higher yields to attract buyers. Refinancing existing debt can therefore become more expensive.
Growth-company valuations can also be sensitive because higher discount rates reduce the present value assigned to future cash flows. Stocks do not automatically fall whenever yields rise because earnings, productivity and investor demand can offset valuation pressure.
The key distinction is whether yields are rising temporarily or establishing a persistent higher-rate regime.
MORTGAGES, REAL ESTATE AND THE REAL ECONOMY
The impact does not stop at Wall Street and crypto. Long-term Treasury yields influence borrowing costs throughout the economy, including mortgages and corporate credit.
Higher long-term rates can reduce housing affordability because buyers face larger monthly payments for the same amount of borrowed money. Companies may also reconsider debt-funded expansion, acquisitions and investment when financing becomes more expensive.
Consumers can feel the effect through housing, automobiles and other large purchases. Traders should therefore watch BTC and ETH alongside DXY, credit spreads, equities, commodities and oil.
WHY IS “HIGHEST SINCE 2002” IMPORTANT?
The historical reference matters because it puts today's yield in context. Recent reports showed the 30-year Treasury yield reaching approximately 5.63%, while the 10-year yield reached about 5.34%, levels associated with multi-decade highs. The Federal Reserve's October 2 data showed the 30-year nominal constant-maturity yield at 5.61% and the 30-year inflation-indexed yield at 3.31%.
That real yield is especially important. A high nominal yield combined with a real yield above 3% means investors are demanding substantial compensation even after accounting for expected inflation.
For traders, 5.6% is an important monitoring zone. A sustained move toward 6% would be another major psychological threshold, while a sustained retreat toward the low-5% area would signal easing long-duration pressure.
WHAT SHOULD CRYPTO TRADERS WATCH NEXT?
WATCH THE 30Y TREASURY: The 5.6% area is the major long-term macro zone. A sustained move above roughly 5.63% would keep attention on tighter financial conditions. A sustained decline would reduce some long-duration pressure.
WATCH THE 10Y: The 10-year recently reached about 5.34%, its highest level since 2002 according to Reuters. This benchmark is critical for global valuatio
ns and borrowing conditions.
WATCH DXY: A stronger dollar combined with rising Treasury yields can create a tougher environment for risk assets. A weaker dollar with falling yields can improve financial conditions.
WATCH BTC: BTC has recently traded in the $83K–$87K region. The $87K area is an important psychological zone, while the low-$80K region remains important for monitoring downside pressure.
WATCH ETH: ETH around $2.65K–$2.70K should be evaluated together with volume and liquidity. A breakout without strong participation can be less convincing than a move supported by expanding spot demand.
WATCH VOLUME AND OPEN INTEREST: Price movement without strong spot volume deserves caution. If open interest rises rapidly while price stalls, leverage risk can increase. If open interest falls during a decline, some leverage may simply be leaving the market.
WATCH ETF FLOWS: Institutional BTC demand can offset part of the pressure created by high yields. Strong inflows can improve liquidity conditions, while weak or negative flows can make macro pressure more important.
WATCH LIQUIDATIONS: Large liquidation events can accelerate volatility. High yields combined with excessive leverage can produce sharper intraday moves in both directions.
FINAL MARKET VIEW:
The 5.595% headline should not be treated as an isolated Treasury statistic. It represents a major shift in the long-term return environment.
A 30-year Treasury yield around 5.6% means investors can demand substantially more compensation for holding long-duration US government debt than during the low-yield years. For crypto, the key transmission mechanisms are liquidity, opportunity cost, real yields and the dollar.
If yields remain elevated around 5.6%–5.7%, the dollar strengthens and financial conditions tighten, BTC and high-beta altcoins can face greater volatility. If yields retreat, the dollar weakens, ETF flows remain positive and spot buying expands, crypto can absorb macro pressure more effectively.
The latest market data also show why traders should not use one indicator alone. US employment data initially pushed yields lower, but long-term yields later rebounded toward multi-decade highs. The 30-year yield reached about 5.63%, while the 10-year approached 5.34%. This divergence between softer labor data and persistent long-term yield pressure is important.
The dashboard to monitor is therefore:
30Y Treasury: ~5.6% Recent 30Y high: ~5.63% 10Y Treasury: ~5.34% 30Y real yield: ~3.31% BTC: roughly $83K–$87K zone ETH: roughly $2.65K–$2.70K Key macro inputs: DXY, oil, inflation expectations, Fed expectations Crypto inputs: ETF flows, spot volume, open interest, funding and liquidations
The central lesson is simple: Treasury yields are part of the liquidity map. A multi-decade-high 30-year yield can raise the return available from government debt, increase borrowing costs and change the risk-reward calculation across markets. But it does not automatically determine the next move in BTC, ETH or stocks.
Traders should compare yield direction with price action, percentage changes, liquidity, volume, open interest and institutional flows. When these indicators point in the same direction, the macro signal becomes more meaningful; when they conflict, volatility and two-way price action can increase.
repost-content-media
  • 2
#OpenAIAnnualRecurringRevenueNears$70B
🚀 OPENAI NEARS $70 BILLION ANNUAL REVENUE RUN-RATE — A MAJOR AI MARKET MILESTONE
OpenAI is approaching a remarkable $70 billion annualized revenue run-rate, showing how quickly artificial intelligence is moving from a technology trend into a massive commercial industry.
The latest reports say OpenAI’s annualized revenue run-rate has grown more than 70% since the beginning of Q3, reaching almost $70 billion, while business-to-business revenue has grown more than 100% over the same period. Enterprise sales have also more than doubled since July.
For trade
HighAmbition
#OpenAIAnnualRecurringRevenueNears$70B
🚀 OPENAI NEARS $70 BILLION ANNUAL REVENUE RUN-RATE — A MAJOR AI MARKET MILESTONE
OpenAI is approaching a remarkable $70 billion annualized revenue run-rate, showing how quickly artificial intelligence is moving from a technology trend into a massive commercial industry.
The latest reports say OpenAI’s annualized revenue run-rate has grown more than 70% since the beginning of Q3, reaching almost $70 billion, while business-to-business revenue has grown more than 100% over the same period. Enterprise sales have also more than doubled since July.
For traders and investors, this is not simply a $70B headline. It provides a wider picture of AI demand, enterprise adoption, cloud infrastructure, semiconductors, software and the capital flowing into the AI ecosystem.
Here are 10 important points to understand the development.
🔥 1. $70 BILLION IS A HUGE COMMERCIAL SCALE
OpenAI approaching a $70B annualized revenue pace demonstrates the extraordinary speed at which AI products are being monetized.
The key number is not simply $70B. The more important part is the growth rate.
OpenAI’s annualized revenue run-rate reportedly increased by 70%+ since the beginning of Q3. If we use a simple illustration, a $40B annualized pace growing by 70% would become approximately $68B.
That helps explain why the market is paying attention to the near-$70B figure.
However, traders should remember that an annualized run-rate is not the same thing as $70B of already-recognized full-year revenue. It represents the current revenue pace expressed on an annual basis.
That distinction is extremely important when analysing the company.
📈 2. 70%+ REVENUE GROWTH CHANGES THE AI MARKET DISCUSSION
A reported 70%+ increase in annualized revenue since the beginning of Q3 is a major growth signal.
Even more interesting is the combination of:
• Nearly $70B annualized revenue
• 70%+ growth since the beginning of Q3
• 100%+ business-to-business revenue growth
• 2x+ enterprise sales growth since July
These figures indicate that OpenAI is expanding across multiple revenue channels rather than depending on only one type of customer.
For investors, this makes revenue quality extremely important.
If enterprise adoption continues expanding, AI spending can become part of recurring corporate budgets rather than remaining a short-term experiment.
If growth slows substantially, however, investors may begin focusing more heavily on margins, infrastructure expenses and cash requirements.
🏢 3. ENTERPRISE AI IS BECOMING A MAJOR REVENUE ENGINE
One of the strongest parts of this story is enterprise adoption.
Reports indicate OpenAI’s business-to-business revenue increased by more than 100% over the relevant period, while enterprise sales more than doubled since July.
That is important because companies can integrate AI into:
• Software development
• Customer service
• Data analysis
• Research
• Office productivity
• Automation
• Coding
• Internal knowledge systems
• AI agents
• Business decision workflows
Once AI becomes embedded into daily business operations, recurring usage can create a much larger commercial opportunity.
This is one reason OpenAI’s growth deserves serious attention.
💰 4. WHAT DOES THIS MEAN FOR OPENAI?
Higher recurring revenue gives OpenAI a much larger commercial base from which it can expand its products, infrastructure and research.
AI models require enormous computing resources, and revenue growth can support continued investment in:
• GPUs
• Data centers
• Cloud infrastructure
• AI research
• Model training
• Developer APIs
• Enterprise products
• AI agents
• Consumer services
OpenAI’s recent product expansion also shows that the company is moving beyond a simple chatbot model.
On September 29, OpenAI announced new autonomous AI agents called dots, designed to work across applications and support enterprise workflows. Reuters reported that OpenAI said more than 35 million weekly users were using Codex and ChatGPT Work, while ChatGPT consumer users had reached 1.2 billion.
That combination of consumer scale + enterprise adoption + AI agents could become an important part of the company’s future revenue model.
🌐 5. AI DEMAND IS ALSO CONNECTED TO THE STOCK MARKET
OpenAI itself is privately held, so traders cannot simply buy an OpenAI stock ticker on a public exchange.
But the company’s enormous computing requirements connect it with publicly traded AI infrastructure companies.
Latest October 2 closing data provide useful market context:
NVIDIA (NVDA): $233.95, up 1.34%
Oracle (ORCL): $142.30, up 3.06%
Microsoft (MSFT): $517.53, up 0.92%
Broadcom (AVGO): $355.14, up 3.35%
Alphabet Class C (GOOG): $340.35, up 1.62%
For comparison, the S&P 500 gained approximately 0.73% on October 2.
These companies are separate from OpenAI, but their price action helps traders monitor broader AI and technology-sector sentiment.
📊 6. NVIDIA AND ORACLE DESERVE SPECIAL ATTENTION
NVIDIA remains one of the most important public-market indicators for AI infrastructure demand.
On October 2, NVDA closed at $233.95, gaining 1.34%, and was reported near its May all-time high of approximately $235.74.
That means the stock was only around 0.76% below that reported high.
This is important from a technical perspective because traders can monitor whether price can establish a new high with strong volume and continued semiconductor-sector participation.
Oracle is another important name because of its relationship with OpenAI’s computing infrastructure.
On October 2, ORCL closed at $142.30, up 3.06%. Reuters had previously reported that Oracle shares jumped following the OpenAI revenue report, highlighting the market’s sensitivity to OpenAI-related infrastructure demand.
Therefore, AI traders should watch both AI software demand and infrastructure spending.
⚡ 7. OPENAI'S GROWTH CAN BENEFIT THE WHOLE AI ECOSYSTEM
A growing AI revenue base can create demand across multiple layers of the technology ecosystem.
Think of the AI chain like this:
AI models → cloud computing → GPUs → networking → data centers → electricity → storage → software → enterprise applications.
If AI usage increases by 70%+, infrastructure requirements can expand dramatically.
That is why investors should not focus exclusively on the AI model company.
They should also monitor:
GPU demand
Cloud revenue
Data-center investment
Networking equipment
Energy consumption
Enterprise software
AI application adoption
Capital expenditure
Cloud backlog
Operating margins
This broader approach can provide a more complete picture of the AI cycle.
💡 8. WHAT SHOULD INVESTORS WATCH NEXT?
The $70B figure is impressive, but the next phase is about sustainability.
Investors should track:
Revenue growth %
Enterprise revenue growth %
Consumer subscription growth %
API usage growth %
Revenue per customer
Customer retention
Gross margin
Compute costs
Capital expenditure
Cash generation
Infrastructure commitments
AI-agent adoption
The most important question is not simply:
“Can OpenAI reach $70B?”
The market question is:
“Can OpenAI continue growing rapidly while improving the economics of that revenue?”
That difference can have a major impact on how investors value an AI company.
📈 9. TRADING STRATEGY — HOW TO USE THIS NEWS
For traders, I would treat the OpenAI $70B headline as a sector-level fundamental catalyst, not an automatic buy signal.
A practical framework:
Bullish confirmation setup
Watch for:
Price ↑
Volume ↑
AI-sector participation ↑
Breakout above resistance
Strong closing price
Semiconductor strength
Cloud/software strength
If several of these signals appear together, the market is showing stronger confirmation.
Pullback setup
If an AI stock rallies strongly on the OpenAI news and then pulls back, traders can watch the previous breakout level.
If old resistance becomes support and volume returns during the rebound, that can provide a more structured technical setup.
Risk-control setup
Do not deploy 100% of trading capital on a single headline.
A simple example:
Initial position: 20–30%
Confirmation allocation: 10–20%
Remaining capital: reserve
The exact position size should depend on account size, volatility and personal risk tolerance.
Most importantly:
News → Price Action → Volume → Confirmation → Risk Management
not:
News → Immediate Full Position
The objective is to use the news as information and allow the market to confirm the direction.
🔥 10. FINAL AI MARKET OUTLOOK
OpenAI approaching a $70 billion annualized revenue run-rate is one of the clearest recent signals of how rapidly AI commercialization is expanding.
The reported numbers are powerful:
💰 Nearly $70B annualized revenue
📈 70%+ growth since the beginning of Q3
🏢 100%+ business-to-business revenue growth
🚀 2x+ enterprise sales growth since July
📊 NVDA: $233.95, +1.34%
☁️ ORCL: $142.30, +3.06%
💻 MSFT: $517.53, +0.92%
⚡ AVGO: $355.14, +3.35%
🔎 GOOG: $340.35, +1.62%
📊 S&P 500: +0.73% on October 2
The most impressive part is not simply the size of the $70B figure.
It is the combination of rapid revenue expansion, enterprise adoption, consumer demand, AI-agent development and massive infrastructure requirements.
OpenAI is demonstrating how AI can evolve from a software product into a large recurring commercial ecosystem.
For users, this can mean more investment in better models, faster services, AI agents, enterprise tools and developer products.
For investors, it creates a much bigger AI data set to monitor.
For traders, the key is confirmation.
Watch:
Revenue growth + enterprise demand + AI infrastructure + volume + price action + margins + cash flow.
If revenue continues expanding rapidly while the economics of AI services improve, the commercial significance of AI could continue increasing.
But remember one critical point:
$70B annualized revenue is a run-rate, not $70B of already-realized annual revenue.
Therefore, the smartest market analysis is not based on one headline.
It is based on tracking the complete picture:
REVENUE → GROWTH → USERS → ENTERPRISE → COMPUTE → INFRASTRUCTURE → MARGINS → CASH FLOW → MARKET PRICE → VOLUME.
OpenAI’s near-$70B milestone shows just how far the AI economy has progressed — and the next stage will be about proving that this extraordinary growth can remain sustainable at massive scale.
repost-content-media
  • 2
#BrentTops$106USTalksStall
#XBR
Brent Crude (XBR) Market Analysis — US–Iran Standoff, Price Levels & Trading Plan
Brent crude is trading in one of the most headline-sensitive environments of 2026. The global benchmark recently surged above $106 and briefly reached around $107 per barrel before reversing toward the $100 psychological level.
The key issue is no longer only traditional supply and demand. The market is carrying a significant geopolitical premium because of the US–Iran confrontation, Strait of Hormuz risks, military deployments and uncertainty around diplomatic negotiations.
1.
HighAmbition
#BrentTops$106USTalksStall
#XBR
Brent Crude (XBR) Market Analysis — US–Iran Standoff, Price Levels & Trading Plan
Brent crude is trading in one of the most headline-sensitive environments of 2026. The global benchmark recently surged above $106 and briefly reached around $107 per barrel before reversing toward the $100 psychological level.
The key issue is no longer only traditional supply and demand. The market is carrying a significant geopolitical premium because of the US–Iran confrontation, Strait of Hormuz risks, military deployments and uncertainty around diplomatic negotiations.
1. US–Iran Talks Remain the Main Catalyst
The biggest variable for Brent is still the direction of US–Iran negotiations. Recent reports indicate that talks remain stalled, while Washington and Tehran continue to maintain very different positions.
Trump rejected Iran's proposed seven-day plan related to reopening the Strait of Hormuz while leaving the door open for further discussions. Iran's foreign minister has indicated that Tehran is prepared for diplomacy but also for confrontation if necessary.
For oil traders, this creates a difficult environment because every diplomatic headline can remove geopolitical premium, while every escalation headline can add it back immediately.
2. Strait of Hormuz Is the Critical Risk
The Strait of Hormuz remains the most important supply chokepoint in this situation. A sustained disruption could affect a major portion of global seaborne energy flows and create a much larger supply shock.
However, traders should distinguish between a potential supply disruption and an actual physical shortage. Some Gulf crude is still moving, and recovering flows have recently helped push Brent lower from its highs.
That is why Brent has been extremely volatile rather than moving continuously higher.
3. US Military Deployment Adds Another Risk Premium
Reports indicate that the United States is reinforcing its military presence in the Middle East, including the deployment of a third aircraft-carrier strike group and potentially up to 10,000 additional troops.
This does not automatically mean that oil supply will fall. The market is instead pricing the possibility that military escalation, an accident or a broader regional confrontation could disrupt energy infrastructure or shipping.
This distinction is extremely important. Traders should not treat military deployment itself as proof of an immediate physical oil shortage.
4. Brent Price Performance Shows Extreme Volatility
The recent numbers explain the market better than headlines.
On September 28, Brent climbed approximately 2.6% to around $107.04.
By September 30, Brent was around $102.56, up approximately 2.37% on the day. At that level, Brent was about 11.55% higher than one month earlier, when it was around $91.94, and more than 53% above its level of roughly $66.69 one year earlier.
On October 1, Brent closed around $102.31, gaining approximately $4.28 in one session. WTI also advanced around $2.45 to approximately $92.87.
Then October 2 brought a sharp reversal. Brent fell approximately 2.63% to around $99.62, while WTI dropped about 3.87% to roughly $89.28.
That created a Brent–WTI spread of approximately $10.34.
This price behavior shows exactly what traders are dealing with: strong upside geopolitical spikes followed by equally aggressive reversals when supply-flow concerns ease.
5. The $100 Level Is the Central Pivot
Brent is currently trading around the psychological $100 area, making this level extremely important.
Above $100, geopolitical risk remains heavily reflected in the price. Below $100, the market can begin focusing more aggressively on recovering flows, demand conditions and the possibility of diplomatic progress.
The broader recent range is approximately $94–$107.
Until Brent breaks this range decisively, traders should expect continued two-way volatility rather than assuming that every rally will become a new trend.
6. Key Resistance Levels
The first resistance area is approximately $98.59–$98.98, where short-term moving averages have been clustering.
Above that, $99.26 is another important level.
The major resistance zone is approximately $101–$102, with $101.67 and $102.05 acting as important breakout thresholds.
A decisive daily close above $102.05 could open the way toward:
$104
$105
$106
$107+
The recent $106–$107 region remains the major upside reference because that is where the latest geopolitical spike accelerated.
7. Key Support Levels
Immediate support is around $98.40.
The next support area is approximately:
$97.24
$97.67
The more important medium-term battleground is the $94–$96 region, including approximately $94.22 and $95.98.
A deeper correction could bring Brent toward the $90.70–$91.00 region, around the 200-day moving-average area.
That zone is particularly important because a sustained move below it would indicate that the market is losing a significant portion of its geopolitical premium.
8. Bullish Scenario
The bullish scenario becomes stronger if:
• Strait of Hormuz disruption increases
• US–Iran tensions escalate
• Energy infrastructure or shipping faces disruption
• Negotiations completely collapse
• Physical crude flows deteriorate
• Brent breaks and closes above $102.05
A confirmed breakout above $102.05 could put $104–$107 back into focus.
If the Strait of Hormuz experiences a genuinely sustained disruption, the market could price a substantially larger risk premium. Some longer-range forecasts have discussed $120–$130+ scenarios, but these should be treated as high-risk tail scenarios rather than normal base-case targets.
9. Bearish Scenario
The downside scenario becomes stronger if:
• US–Iran negotiations restart meaningfully
• A ceasefire or diplomatic agreement emerges
• Hormuz flows continue recovering
• Emergency fuel measures reduce immediate supply concerns
• Physical supply remains stable
• Geopolitical risk premium begins disappearing
In that environment, Brent could move back below $100, putting $98, then $95–$94 into focus.
A deeper deterioration in geopolitical premium could eventually expose the $91 area.
The important point is that Brent does not need a huge increase in physical supply to fall sharply. A reduction in geopolitical risk alone can trigger aggressive profit-taking after a move of more than 50% year over year.
10. Trading Framework
This is a high-volatility market, so traders should focus on levels rather than emotions.
One possible range framework is watching the $94–$96 support zone for signs of stabilization and the $101–$104 region for signs of resistance.
A breakout strategy becomes more relevant if Brent establishes a decisive daily close above $102.05, while a breakdown below the major $94–$95 support area would weaken the bullish structure.
The key principle is confirmation. Do not assume that touching a level automatically means the market will reverse.
11. Risk Management Is More Important Than Prediction
Brent has already demonstrated how quickly conditions can change.
A move of approximately +4% in one session followed by a decline of more than 2.5% the next day is enough to seriously damage oversized leveraged positions.
For that reason, traders should consider:
• Smaller position sizes
• Clearly defined invalidation levels
• Lower leverage during major headlines
• Avoiding oversized overnight exposure
• Monitoring geopolitical announcements continuously
• Confirming breakouts instead of chasing spikes
A single Washington or Tehran headline can move crude several dollars within minutes.
12. What Traders Should Watch Next
The most important indicators are not complicated.
Watch the $100 pivot.
Watch $102.05 for a potential upside breakout.
Watch $94–$95 for major support.
Watch the $90.70–$91 area for deeper structural support.
At the same time, monitor Strait of Hormuz traffic, US–Iran negotiations, military deployments, emergency fuel measures, physical crude flows and the Brent–WTI spread.
The combination of price action and fundamental headlines is more useful here than relying on technical indicators alone.
Final Market View
Brent crude remains trapped inside a high-volatility geopolitical environment, with approximately $94–$107 defining the broader recent range and $100 acting as the central pivot.
The bullish side is being supported by stalled US–Iran diplomacy, military escalation risk and the possibility of disruption around the Strait of Hormuz.
The bearish side is being supported by recovering flows, emergency fuel measures and the possibility that diplomatic progress could rapidly remove part of the geopolitical premium.
The most important technical level is $102.05 on the upside. A confirmed break could bring $104–$107 back into focus. On the downside, $94–$95 is the major support region, while $91 represents a deeper structural level.
$XBRUSD ‌
repost-content-media
  • 2