





Square
Following
Hot
News
Notifications
Profile
Share your thoughts
placeholder
Article
Fill this room with everything you know about me, go over the top @grok
post-image
BTC Market Analysis
Looking at BTC’s 1-hour order book, the overall structure is bearish, and the price has fallen to around $68,700. Spot CVD and futures CVD are both accelerating downward, dropping to -11.7K and -28.8K, respectively, indicating active selling pressure in both spot and futures markets. The good news is that the Funding Rate has fallen significantly compared with yesterday and the day before, but OI (open interest) continues to rise, indicating that new contract positions are outpacing closing positions as the price falls. With Futures CVD continuing to decline and the Funding
BTC-0.65%
Trenches
mihao
m
bade
b
mihao
4Cxj...pump
Market Cap
$.
Change
.
24h Vol
$.
Holders
.
AGT
A
bade
b
AGT
0x5d...e274
Market Cap
$.
Change
.
24h Vol
$.
Holders
.
FOOD
F
bade
b
FOOD
FTu5...pump
Market Cap
$.
Change
.
24h Vol
$.
Holders
.
IDOL
I
bade
b
IDOL
0x3b...ab07
Market Cap
$.
Change
.
24h Vol
$.
Holders
.
AI
A
bade
b
AI
2T56...pump
Market Cap
$.
Change
.
24h Vol
$.
Holders
.
Goiz Future is once again flooding the gainers list, and the buzz continues to heat up🔥 These assets are worth keeping a close eye on to see who can take over and push higher...
$BARD 0.17$MAGMA 0.40$CBRS 120PLAY 0.0090DODOX 0.030
BARD is already up +55.08%, MAGMA has followed with +25.21%, and CBRS has also gained +16.56%. Check the rankings for more assets.
Markets move quickly, so be cautious about chasing highs and manage your positions. This is not investment advice.
post-image
BARD-1.24%
MAGMA-0.57%
CBRS-1.52%
BTC falls below 71K hitting its lowest level since September
live-cover
LIVE1,676
Every time the S&P 500 hits a new high, it gets whacked: down 36% in 2020, 27% in 2022, and a 20% correction in 2024. This pattern is steadier than my receding hairline. If we get another round in 2026, anyone chasing highs should think hard about whether they can handle it. Are you seeing history repeat itself, or is this time different?
post-image
SPYX+0.01%
  • 2
Does a larger net inflow to exchanges make prices more likely to fall?

In crypto market analysis, exchange fund flows are often used to gauge market sentiment. When large amounts of tokens move onto exchanges, some believe selling pressure is building; when tokens continuously flow off exchanges, others believe investors are accumulating.

But judging price movements solely by fund flows can easily overlook a key point: fund movements reflect asset transfers, not necessarily actual buying or selling.

First, distinguish net inflows from actual selling.

Exchange net inflow usually refers to t
post-image
Complete the Progress Bar in Half a Month Challenge
Day 1 🤗
post-image
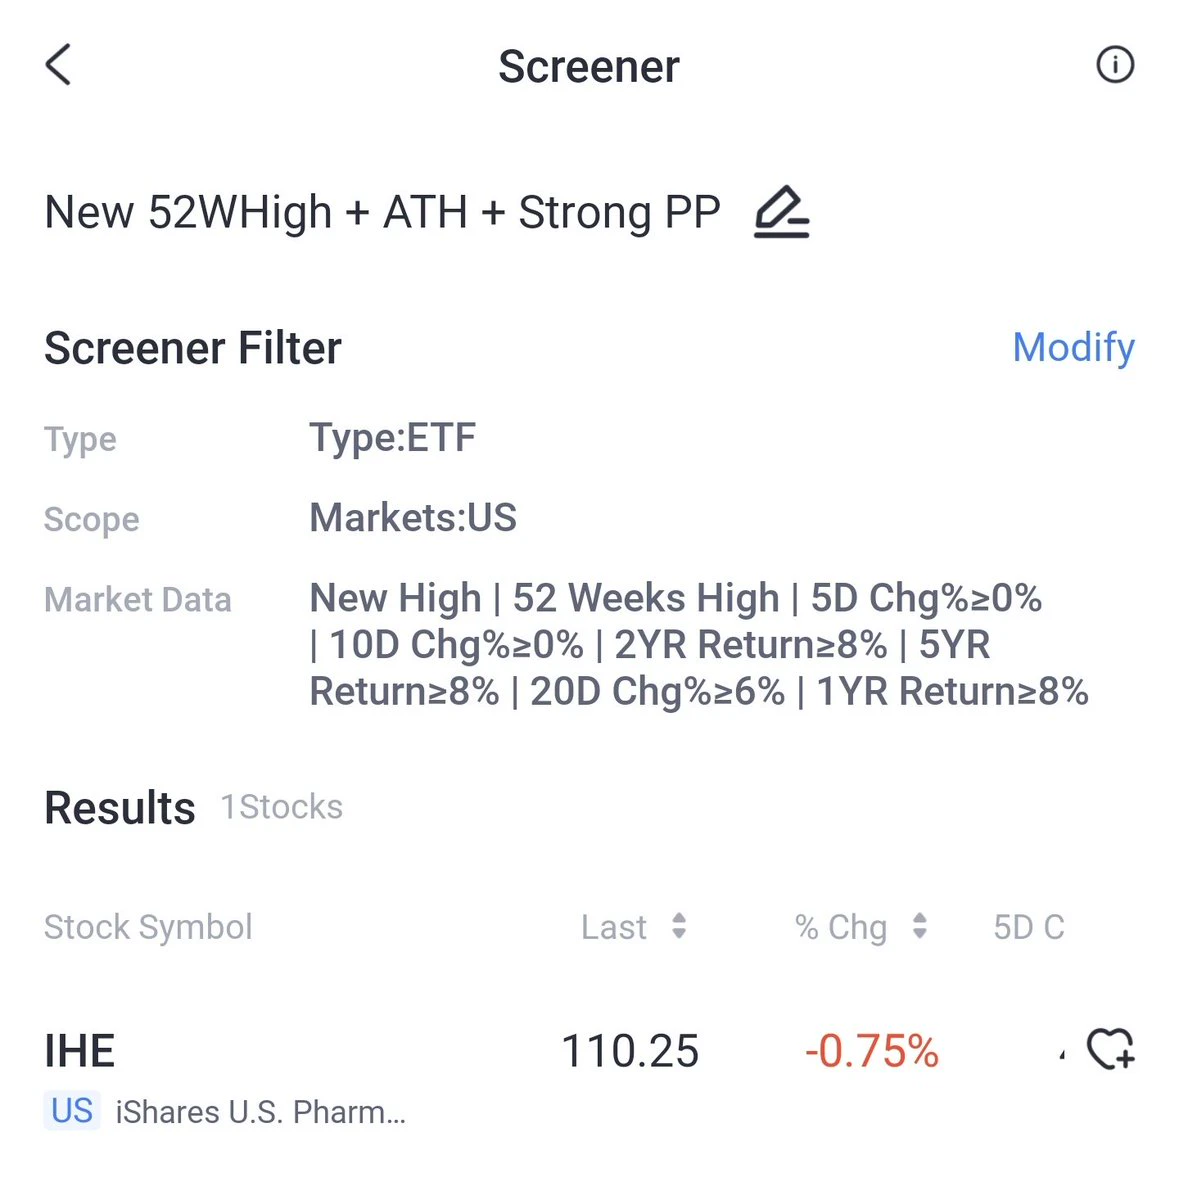
🎯A simple customised screener you can execute in @TigerBrokersSG app.📈
The strongest funds are still healthcare related. $IHE @iShares US Pharma ETF
post-image
The trading market never clocks out, but my weekend can!

It was only after I started investing that I realized the hardest part isn’t judging the market, but learning when not to watch it.
Whenever the weekend came around, I used to feel like I had to catch every single move. While others went out, I watched charts; while others went to dinner, I followed the news; while others slept, I was still studying the market.
By the end of the day, I hadn’t learned anything new about the market, but my dark circles had become more and more noticeable.
There’s been plenty of volatility this week, and t
MU-1.61%
  • 12
🚨 It looks like Satoshi Nakamoto was caught having an affair with his secretary.
Bitcoin plunges after the news breaks. 😂
BTC-0.67%
TP2 was completed $AGT ; it fell too quickly, but later retested 0.057.
post-image
AGT-26.77%
I think they found satoshi's mistress
post-image
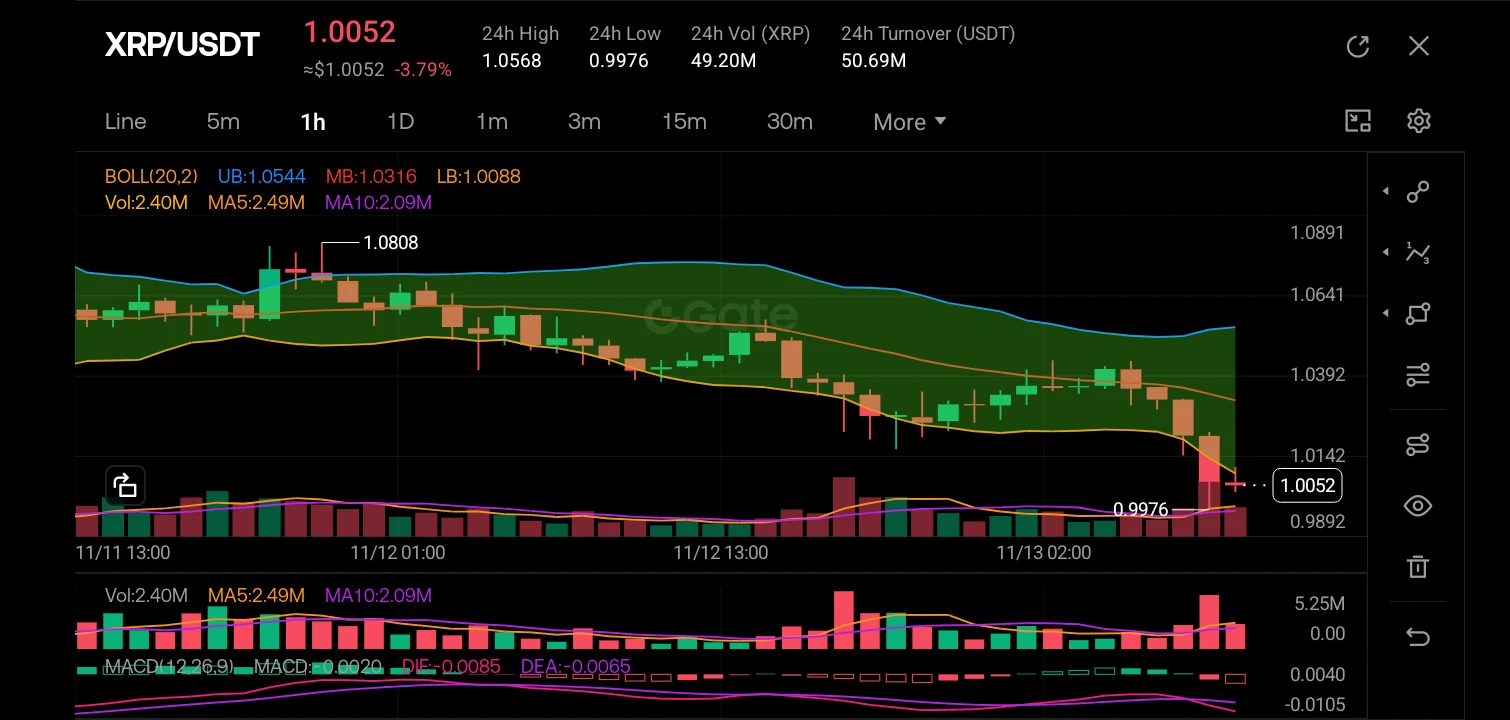
$XRP ‌
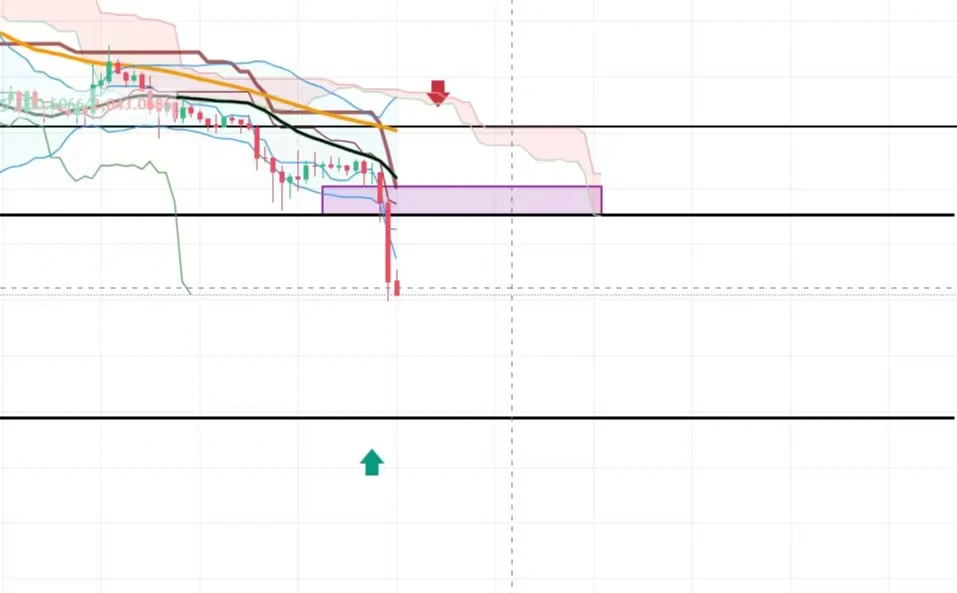
The market structure has clearly shifted bearish, transitioning from a consolidation phase near the 1.0641 level into a sharp breakdown. The K-line analysis shows a series of lower highs and lower lows, with the price currently piercing the lower Bollinger Band (LB: 1.0088) and trading significantly below the middle band (MB: 1.0316). The recent price action is dominated by strong red candles, indicating heavy selling pressure, while the MACD histogram is expanding downward and the signal lines (DIF and DEA) have crossed below the zero line, confirming strong bearish momentum.

The mos
post-image
XRP-1.15%
  • 2
  • 2
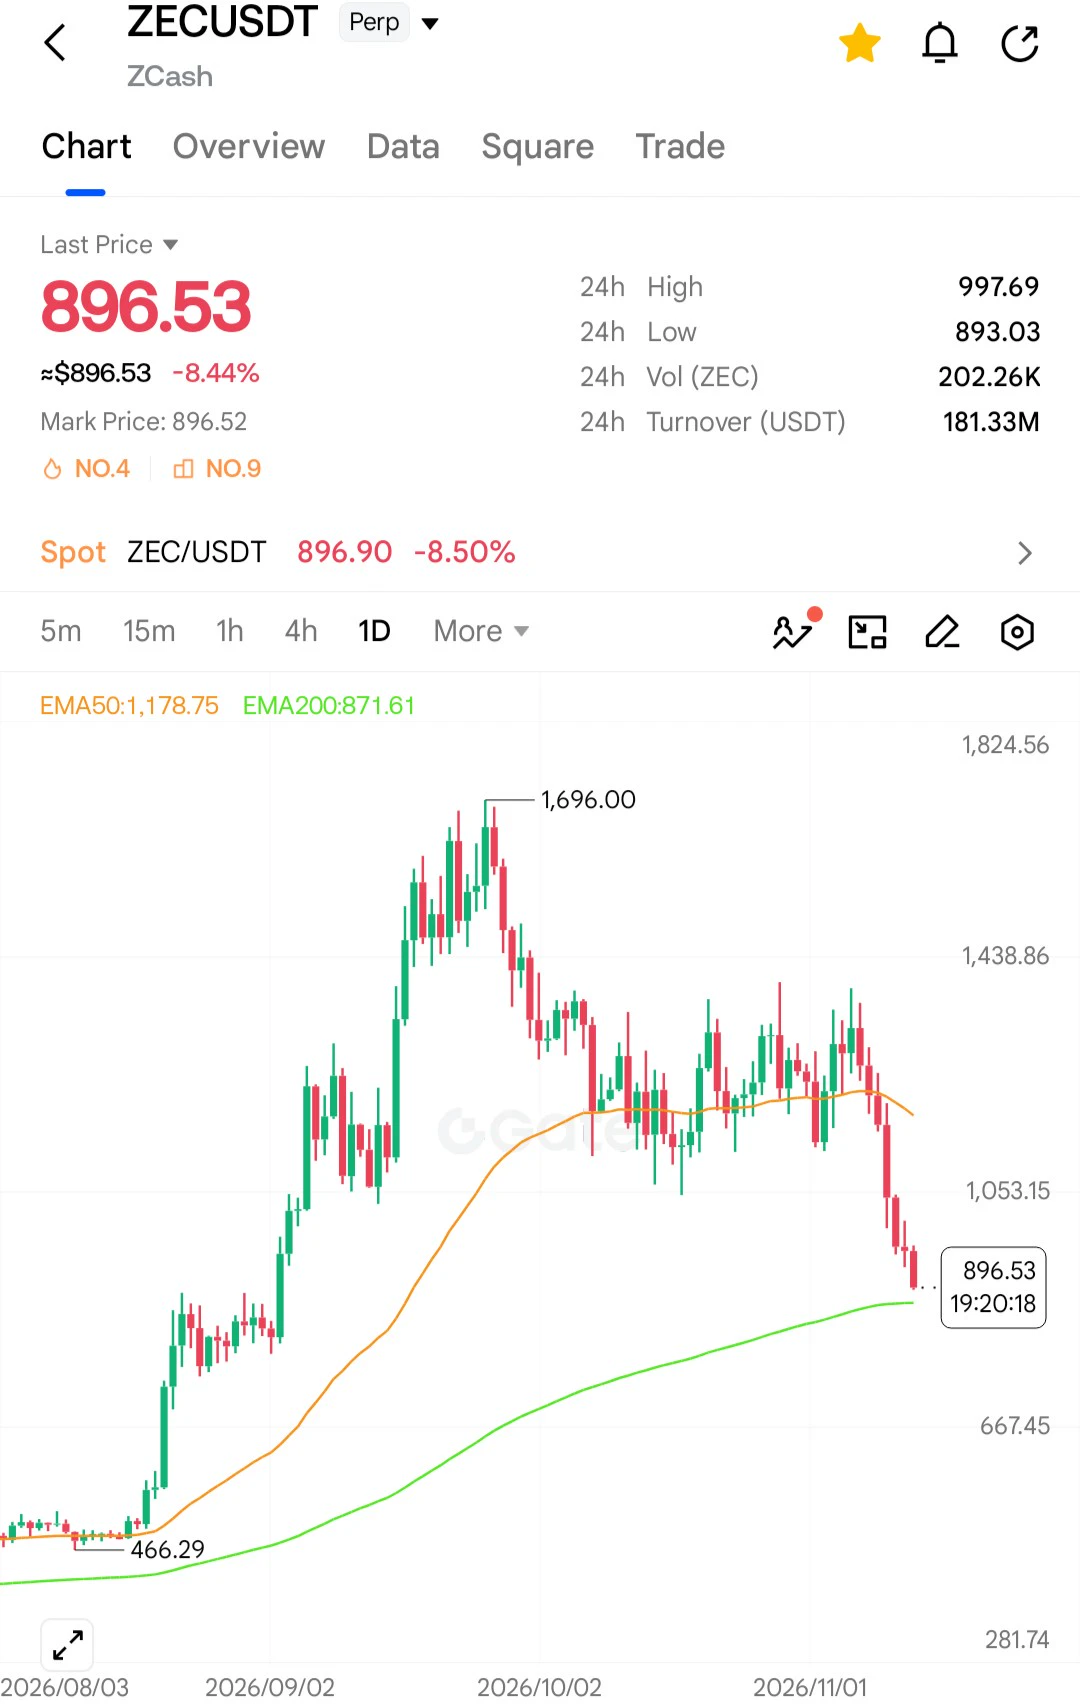
ZEC price is already below $900 and touched $890, as I said in my previous post when the price was at $1310.
#GateIPOAccessAnthropic
$ZEC ‌
post-image
Fun_Trader
ZEC the next LUNA? Short TP 850. SL 1400
Don't FOMO into buying coins, so you don't become fuel for the holders who got in early 😂.
#SquareTradingExpert
#WCTCS9
$ZEC

repost-content-media
ZEC+1.29%
  • 1
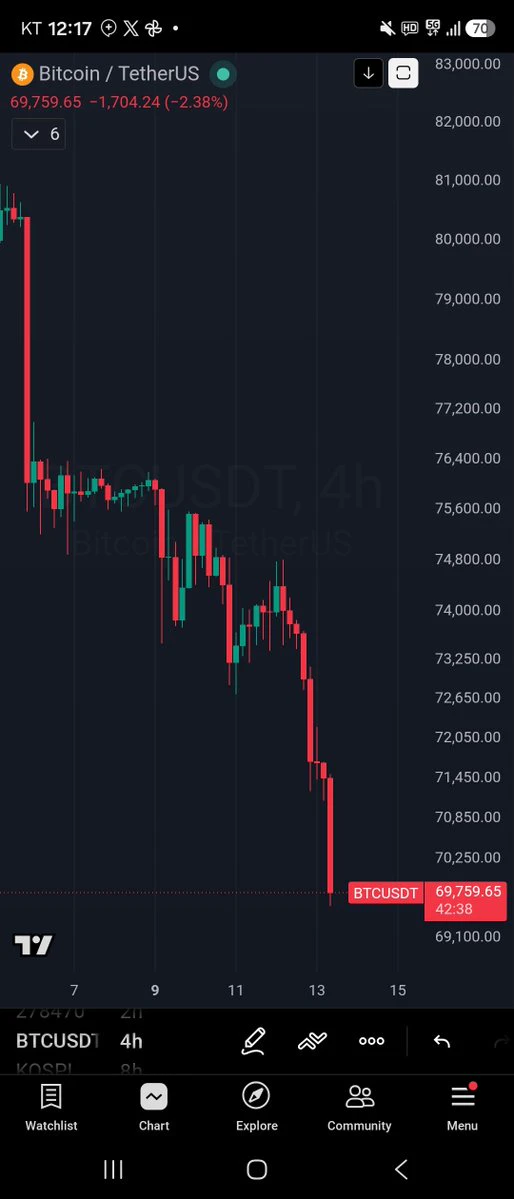
BTC crashed below $70,000,

Currently around $69,000. The next support is around $67,000, where the 200-day moving average is,

I only look at the general levels,

Hope it holds.
BTC-0.67%
Market liquidity is fleeing, and now another giant is sucking it dry!
The bottoming process is accelerating; the golden bottom is about to appear!
post-image
GLDX-0.40%
PAXG+0.37%
The only market I still have confidence in is crude oil. Bitcoin’s price action is terrible, and crude has also reached 87.5, a level where the risk premium is being unwound

Once crude oil’s risk premium has been cleared, prices will return to the supply-demand equilibrium

That is, once the Strait of Hormuz is operating normally and the US and Iran have ended their conflict, prices will return to the cost levels of OPEC+’s major oil producers, around $70–75

With Qatar’s mediation, the US and Iran are now close to peace talks. Iran has agreed to limit uranium enrichment to 3.67%, fully resto
BTC-0.67%
CL-1.83%
  • 1
  • 1
ETH's broader cycle remains in a bearish primary downtrend. The current rallies are merely weak corrective rebounds within the downtrend. There are no signs yet of a bottom forming or a trend reversal, and bears remain in control. For intraday trading, prioritize following the trend; countertrend trades should be limited to small positions and short-term plays.

The key overhead resistance zone for the day is 1980–2000, the dividing line between a strong and weak rebound in this move. If the price stalls here, this is the main area to set up short positions. If the rebound exceeds expectations
post-image
ETH-1.26%
  • 1
Load More

Join 40 M users in our growing community

⚡️ Join 40 M users in the crypto craze discussion

💬 Engage with your favorite top creators

👍 See what interests you

Trending Topics

JensenHuangResigns

505.5K Views7.5K Discussing

Jensen Huang has resigned as NVIDIA CEO and stepped down from the board. CFO Colette Kress will serve as interim CEO while NVIDIA considers internal and external successors. $NVDA fell more than 10% in premarket trading following the announcement. With one of AI’s most influential leaders stepping aside, markets are now reassessing NVIDIA’s leadership stability, AI strategy, and long-term valuation.

GateIPOAccessAnthropic

273.9K Views2.6K Discussing

DrHanOxfordUnionSpeech

143.2K Views387 Discussing

View More