Square
Following
Hot
News
Profile

HypeVaccinated

vip
Peak Tier 0
Active for: 0.6y
Immune to hype but not opposed to it; I look at the data first, then the story. Skilled at breaking down project metrics, and I like to settle debates with a single chart.
122
Following
15
Followers
8
Liked
The chain is congested as hell again, Gas is fluctuating wildly, and I’m just staring at the pending transactions in my wallet.
The mempool is basically a black-box auction house: you toss your transaction in, and miners sort them by “whoever pays more goes first.” When it’s congested, if your bid is too low, your transaction might sit there for half an hour with nobody paying attention, while higher bids cut in line. Worse, MEV bots can sandwich you—they front-run with a trade that pushes the price up, your transaction executes, then they sell and pocket the difference.
A lot of people are no
When I was doing on-chain analysis, RPC rate limits used to drive me crazy, Subgraph syncing would get stuck for half a day, and the indexer would just keep spinning. Eventually I learned my lesson: make the data slices smaller and lower the query frequency, and it can run all night.
Same with social mining. At first I tried to capture attention across the board, and the server went down first. Now I only track the behavior patterns of two or three addresses, and the output is much more stable.
Put simply, scaling back your ambitions isn’t giving up—it means knowing how much RPC quota you have
$VVV Intraday volatility has narrowed. Let’s watch how well support levels hold for now; no rush to buy the dip.
HECTOR
𝗩𝗩𝗩 ($VVV ) 📊 | 𝗠𝗔𝗥𝗞𝗘𝗧 𝗢𝗩𝗘𝗥𝗩𝗜𝗘𝗪
💰 Trading Price: $24.65
📉 24H Change: -6.04%
🏦 Market Cap: Approximately $1.20B
🔥 24H Volume: $28.12M
🎯 24H Range: $24.27–$26.37
📌 Market Outlook: VVV is facing short-term selling pressure. A recovery above the daily range could improve momentum, while a break below support may signal further weakness.
#Gate60MUsers
VVV+6.44%
The technical picture looks okay, but if macro conditions don’t cooperate, this trade is still up in the air. Let’s set an alert and keep an eye on it for now.
Rock95
$DASH is trading near $50.84 after a 6.37% decline.
My speculative rebound setup:
Entry watch: $51.50 after reclaim
TP1: $54.00
TP2: $57.00
SL: $49.50
The $50 area is the key reference point for this idea.
I would only consider the setup if buyers regain momentum and the broader market cooperates.
DYOR. NFA.
Wait for a pullback confirmation before making a move; game tokens like AXS can’t be rushed
Rock95
I’m watching $AXS for a meaningful improvement in its trend. Gaming tokens can move sharply when sentiment changes, but reversals need confirmation. My preference is to wait for strength that survives a retest.
DYOR. Not financial advice.
AXS-0.34%
Layer2s are still arguing over whose TPS is higher and whose subsidies are more aggressive, while I just finished going through the reserve reports for several stablecoins...
Honestly, every time I see phrases like “fully collateralized” and “verifiable on-chain,” I instinctively check how frequently the Proof of Reserve is updated. USDe’s June data isn’t out yet, so I’ll stay on the sidelines for now. As for depegging, reserve transparency can only prevent half the problem; the other half is people’s confidence during a bank run—no matter how transparent the chain is, it can’t stop everyone f
USDE+0.00%
EMA bullish alignment; volume is a bit lacking, so I’ll start by testing the waters with a small position.
CryptoJourney1
$LAB ‌/USDT – 4H Chart Analysis
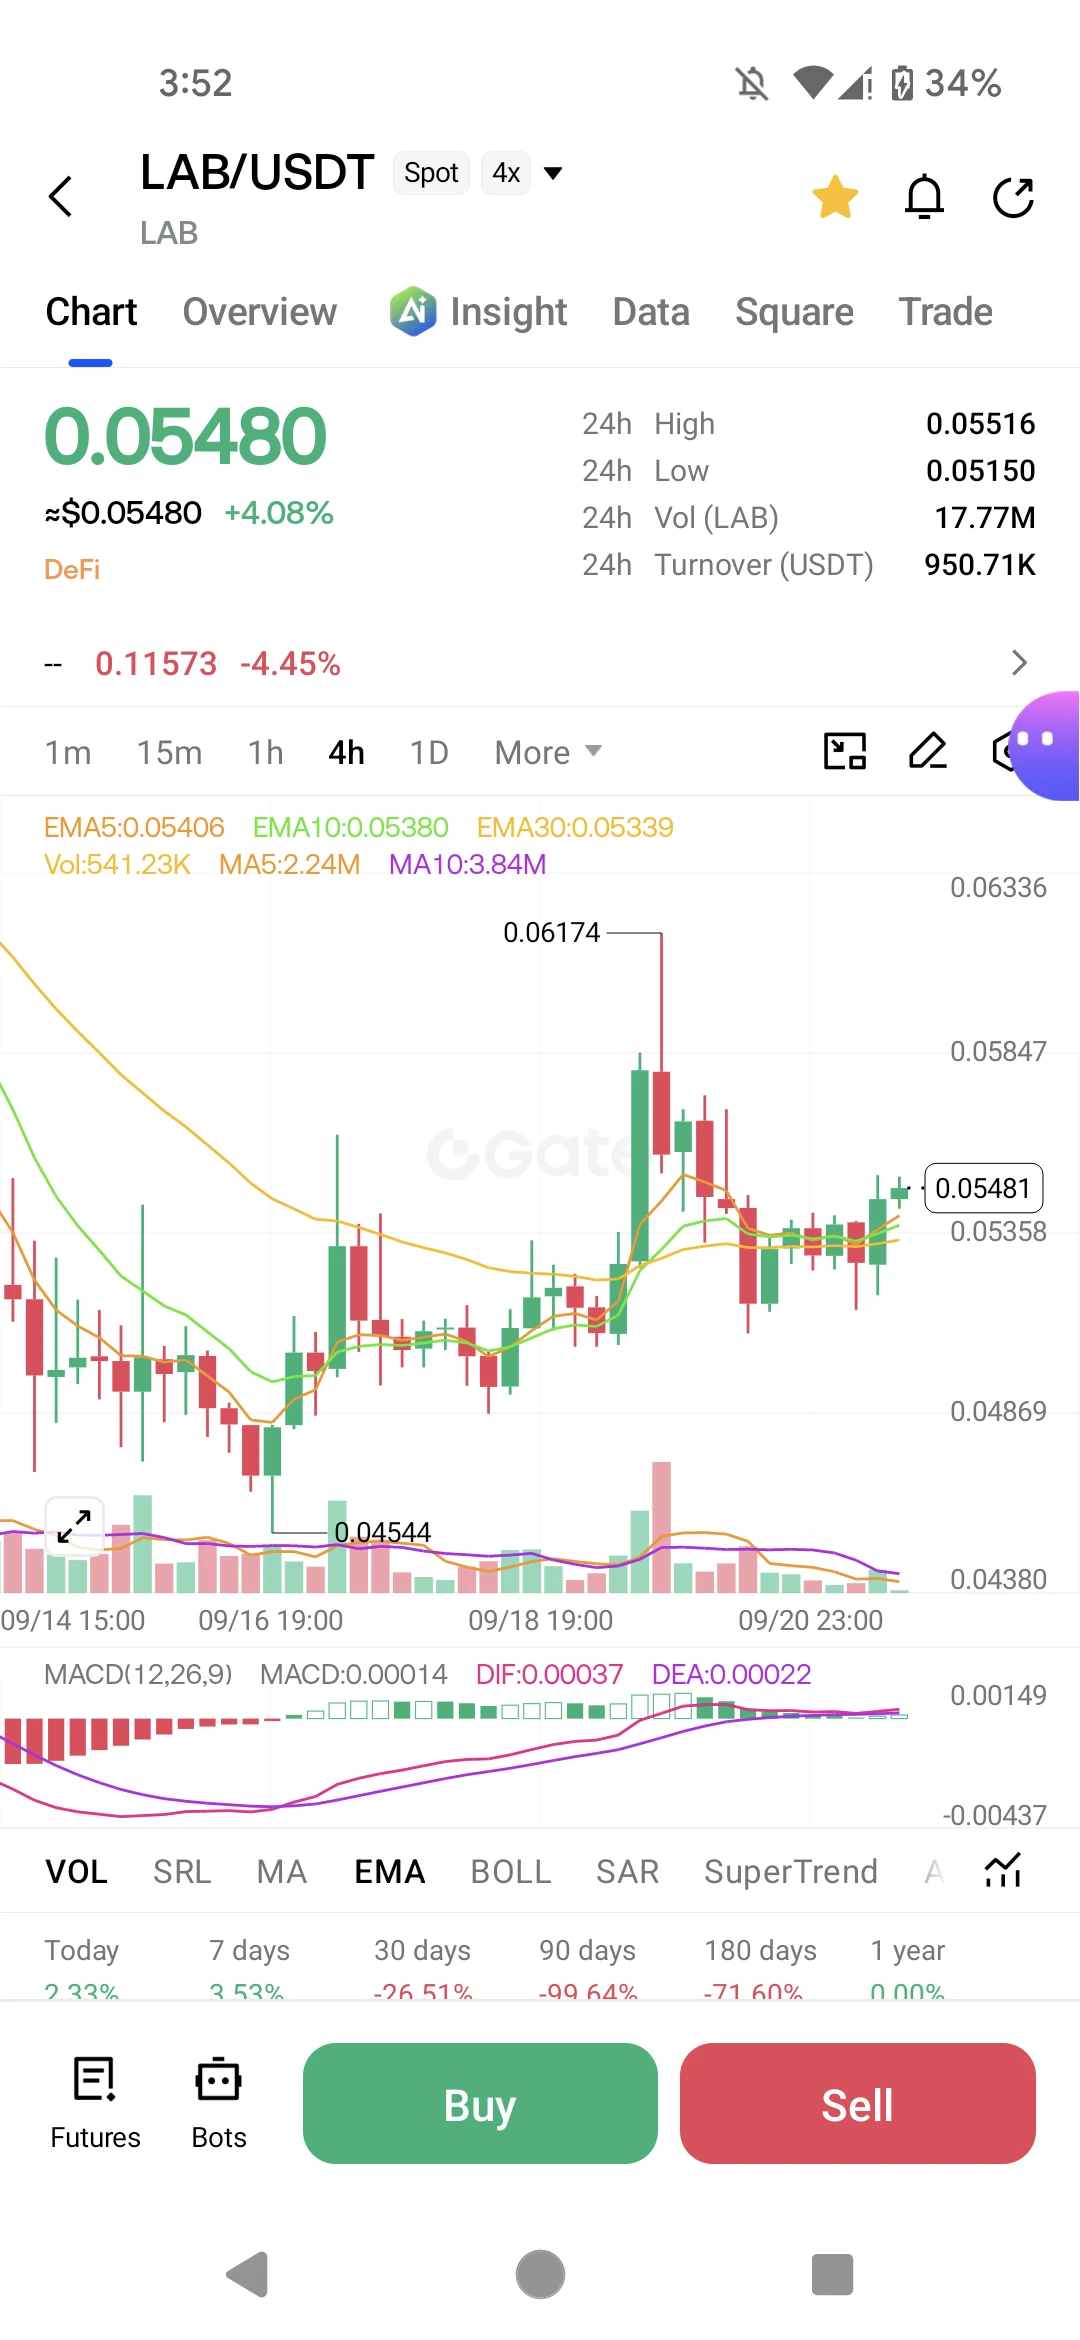
Price is currently at $0.05480, up 4.08% on the day. The 24h high is $0.05516 and the low is $0.05150. The token had a strong run from $0.04544 up to $0.06174 before pulling back, and it's now consolidating above all three EMAs: EMA5 at $0.05406, EMA10 at $0.05380, and EMA30 at $0.05339. That confirms the short-term trend is still bullish.
The MACD is positive but momentum is weak: MACD line at $0.00014, DIF at $0.00037, and DEA at $0.00022. The histogram is barely positive, which tells me the buyers are in control but not aggressively pushing. Volume is also lower than average (541.23K vs MA10 of 3.84M), so the move lacks strong conviction.
Given that price is holding above the EMAs and the overall structure is higher lows, I'm leaning long. A break above $0.05516 could open the door to a retest of $0.06174. If it loses the EMA30 at $0.05339, the setup is invalid.
Trading Plan: Long LAB
· Entry: $0.05450 – $0.05490
· Stop Loss: $0.05280
· TP1: $0.05650
· TP2: $0.05900
· TP3: $0.06150
---
Ready-to-Post Gate Square Update
I'm Long on LAB – Here's My Plan
LAB is quietly building a bullish structure on the 4-hour chart. Price is holding above all three EMAs, and the trend of higher lows remains intact. The MACD is positive, and while momentum isn't explosive, the setup favors the upside.
I've entered a long position at $0.05480 with a stop loss at $0.05280. My first target is $0.05650, then $0.05900. If it breaks the recent high at $0.06174, I'll look for $0.06500.
Key levels I'm watching:
· Resistance: $0.05516 and $0.06174
· Support: $0.05406 (EMA5) and $0.05339 (EMA30)
Do you think LAB will break higher, or is a pullback coming? Share your thoughts below.
repost-content-media
Seriously, people who check on-chain data every day are the most likely to overlook one thing—the “real-time” data you’re seeing may actually be someone else’s snapshot from half an hour ago. Nodes can take time to sync, RPC providers occasionally act up, and you won’t be able to query contracts that the indexer doesn’t cover. Sometimes I’ll stare at a wallet’s transfer history, wondering what the whale is up to, only to switch to another RPC and find that they moved from Chain A to Chain B ages ago.
Lately, things like “exchange hot and cold wallet movements” and “large on-chain transfers” ha
To be honest, airdrop farming has now been turned into mutual gaslighting between project teams and the market. To sum up my attitude in one sentence: don’t talk about feelings—first see whether it dares to put the data on the table.
A lot of people immediately become anxious, afraid of missing this round of farming incentives, getting farmed themselves, or not even making back their gas costs. My habit is to first break down a project’s core metrics—for example, whether it actually has real users or is merely a pile of scripts entertaining themselves. Put bluntly, most losses from farming are
Every time privacy-coin compliance comes up, the comments turn into a noisy market. One side says financial privacy is the bottom line; the other says coin mixing is complicit. Frankly, no one convinces anyone, and it ends with people attacking each other over their positions.
Lately, though, I’ve been more focused on the “liquidity narrative” around putting RWA on-chain. Plenty of projects tout billions of dollars in assets brought on-chain, with TVL soaring and the scene looking even hotter than DeFi at its peak. But break down the data: how much actual trading volume is there, and how much
RWA-0.39%
Just took a look at my wallet. I don't even want to talk. Back in the day, airdrop farming meant picking up freebies; now it's a job. Task platforms set KPIs for you: check-ins, interactions, cross-chain transactions—every single day, more punctual than DingTalk clock-ins. You think you're farming freebies, but you're actually doing piecework for a bunch of volume-boosting tools. And don't even get me started on the scoring. After doing a ton of work, the Sybil model ultimately tells you, “Abnormal behavior pattern.” The more you do, the more you look like a bot. If that's not dark humor, what
Getting trapped right after entering is definitely painful, but Sui’s data is bearish in the short term, so don’t stubbornly hold on; set your stop-loss at 0.65, and if it breaks, admit the mistake. Preserving your principal is more important than anything else.
CryptoJourney1
Answered to mr @Echo of L2
First of all — I feel you. Getting trapped right after entry is one of the most frustrating feelings in trading. You're not alone in that experience.
Now, let's look at the data and get you a clear stop-loss level.
---
$SUI ‌ / Current Setup:
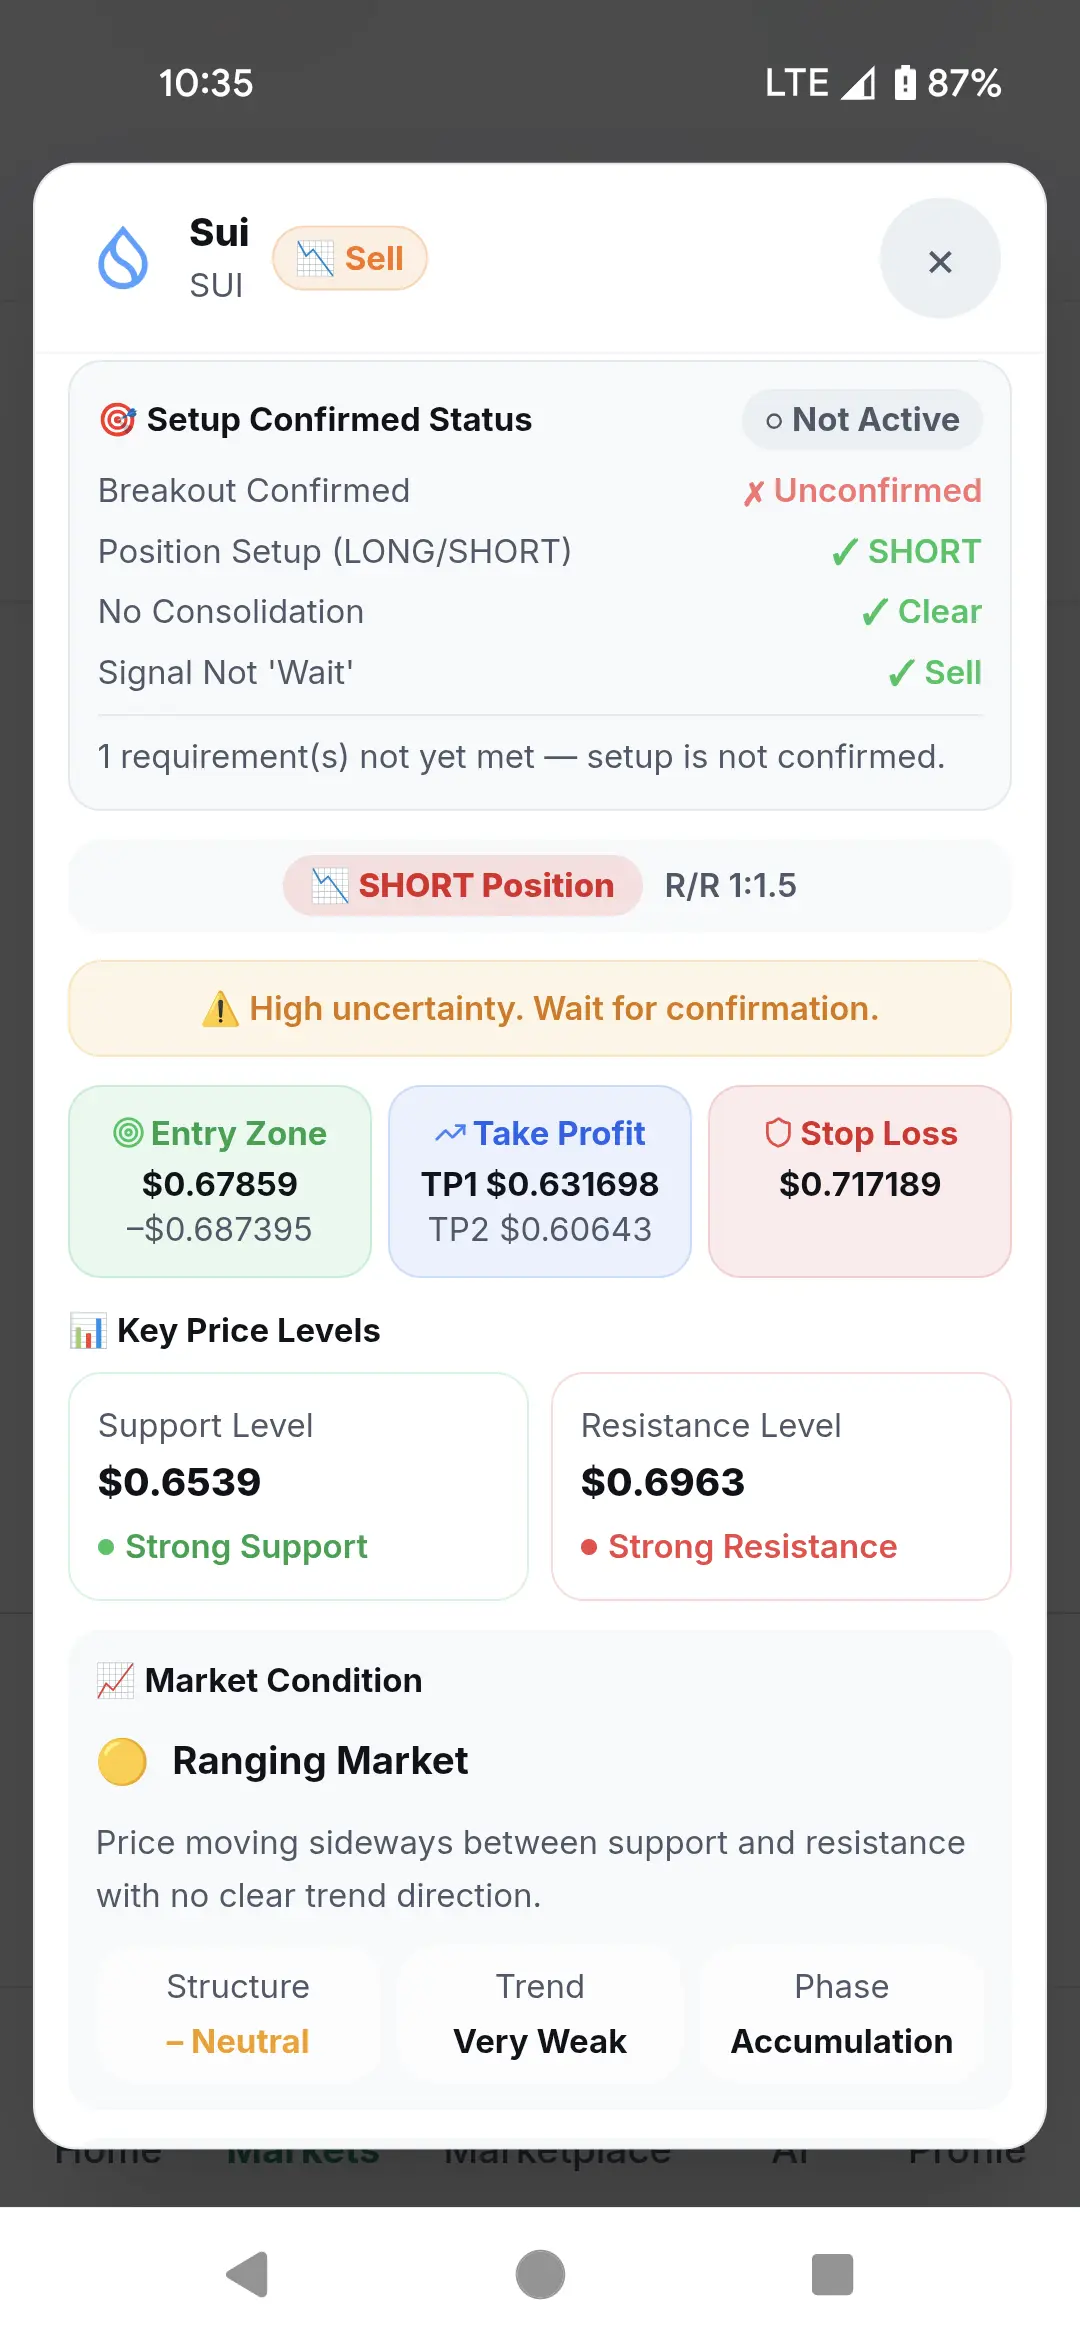
· Market structure: Ranging — neutral, very weak trend
· Support: $0.6539 (strong)
· Resistance: $0.6963 (strong)
· Entry zone for short: $0.67859 – $0.687395
· Take profit: TP1 $0.631698 | TP2 $0.60643
· Suggested stop-loss from the setup: $0.717189
· Momentum: 48/100 — weak
· Volume: Weak
· Risk: Low risk (according to the data)
---
What happened:
You bought SUI, but based on the chart, this is actually a SHORT setup — meaning the data is suggesting sellers are in control, not buyers. That's why you got trapped immediately. The market is ranging, and the bias is bearish.
---
What I'd recommend as your stop-loss:
· If you're holding long: Place your stop-loss at **$0.6500** based on the 4H close. Why? Because $0.6539 is strong support. If price closes below that on the 4H timeframe, the support is broken, and downside could accelerate.
· If you want to cut losses and switch to short: Consider closing your long and waiting for a 4H close below $0.6539 — then entering short with a stop-loss at $0.7000.
---
My honest take:
Right now, the market structure is neutral, but the short signal is more valid than a long. If you're still holding, I'd recommend moving your stop-loss to $0.6500 and accepting the loss if it hits.
Trading isn't about being right every time — it's about managing risk. If you get stopped out, you live to trade another day. If you hold without a stop and it drops, you could lose a lot more.
My advice: Set a stop-loss. Protect your capital. And next time, wait for confirmation before entering — not after.
You asked for help — I'm giving it to you straight. 🙏
#GateLaunchpool141MDOS
repost-content-media
SUI-1.05%
Hold above $1, and the bulls are still in the game.
CasAbbe
$EPIC
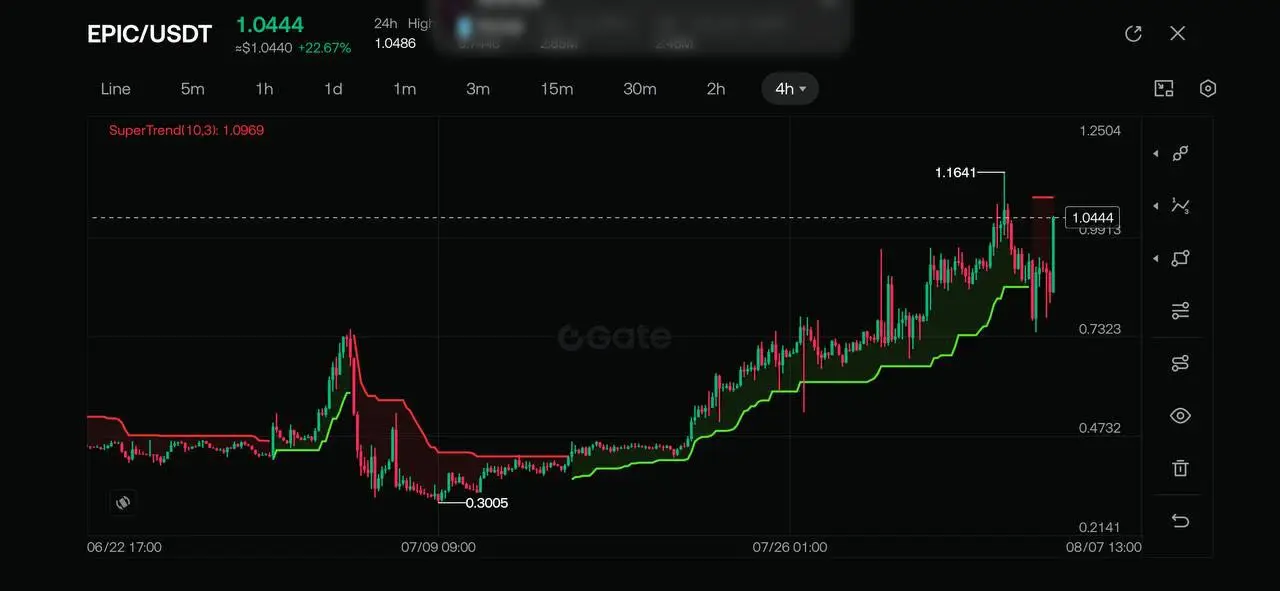
This one is strong, but the wick into $1.16 - buyers got aggressive right into liquidity.
As long as $0.99–1.00 holds, bulls still control the structure. Next levels I’d watch are $1.08 and $1.16.
repost-content-media
Today I saw KOLs again interpreting on-chain large transfers as “smart money,” and there’s a whole bunch of fomo followers underneath. Honestly, with that many anomalies, most of it is whales doing arbitrage or internal housekeeping by exchanges—yet they still have to write a little essay to make it sound convincing… Anyway, the data is right there; people who believe will believe.
Speaking of this, governance tokens have been getting more and more confusing the more I look into them recently. Delegated voting was originally meant to get more people involved, but what happened is that whales a
Seth Ginns’ checklist is pretty interesting—protocols that have survived cycle tests, where value capture and transparency are at the core of the next round of narrative
Original content no longer visible
The RHODL ratio has fallen from 6.5, and the old “grass” is starting to hand over the chips to new players—this plot feels familiar.
Original content no longer visible
The bullish logic remains unchanged, just keep a close eye on the support range of 60,700-61,200 and don't get shaken out.
Original content no longer visible
BTC only saw an inflow of 197 coins in a single day. Compared with ETH, the gap is a bit disheartening.
Original content no longer visible
BTC-0.67%
ETH-1.26%
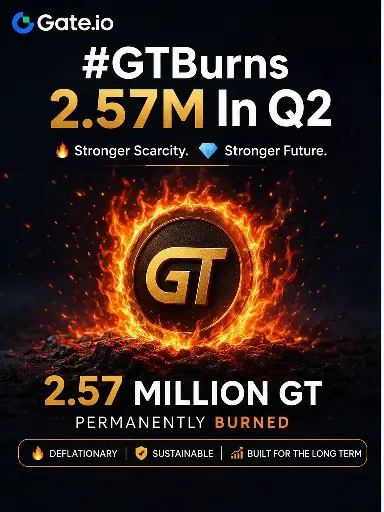
Q2 burned another 2.57 million GT, deflation narrative continues, long-term holders rejoice
Ai_Power
#GTBurns2.57MInQ2
Powerful Hook
While many crypto investors focus only on price movements, experienced market participants pay close attention to tokenomics. GateToken (GT) has completed another major quarterly token burn, permanently removing 2.57 million GT from circulation. This isn't just a routine event—it represents a continued commitment to reducing supply, strengthening scarcity, and supporting the long-term value of the Gate.io ecosystem. As adoption of the platform grows, many investors are asking whether GT's deflationary model could become one of the strongest catalysts for future price appreciation.
Introduction
Token burns have become one of the most important mechanisms in the cryptocurrency industry for managing supply. Unlike inflationary assets that continuously increase in circulation, deflationary tokens gradually reduce their available supply over time. GateToken follows this approach through regular quarterly burns, making GT one of the leading exchange tokens with a transparent long-term supply reduction strategy.
The latest burn of 2.57 million GT once again demonstrates Gate.io's commitment to sustainable ecosystem growth and long-term token value.
What Happened?
During Q2, Gate.io permanently burned 2.57 million GT, removing these tokens forever from circulation. Since burned tokens cannot be recovered or traded again, the total circulating supply continues to decline.
As demand remains stable or increases, a shrinking supply can strengthen the token's long-term economic foundation.
Why Token Burns Matter
Token burns are important because they directly affect supply.
When circulating supply decreases while ecosystem usage continues to expand, scarcity increases. Although burns do not guarantee immediate price appreciation, they improve the long-term tokenomics by making every remaining GT represent a slightly larger share of the total network value.
For investors, this creates an attractive long-term narrative centered on disciplined supply management.
Growing Gate.io Ecosystem
The value of GT is influenced not only by token burns but also by the continued expansion of the Gate.io ecosystem.
As more users join the exchange, participate in Launchpad events, utilize Web3 products, staking services, and on-chain applications, demand for GT may continue to grow alongside the platform itself.
Strong ecosystem growth combined with continuous supply reduction creates a powerful long-term combination.
Market Outlook
Short-Term
Price volatility may continue as broader crypto market conditions influence exchange tokens. Token burns often improve sentiment, but immediate price reactions depend on overall market liquidity and investor confidence.
Medium-Term
If trading activity, platform adoption, and user participation continue expanding, GT could benefit from increasing demand supported by its deflationary supply model.
Long-Term
The long-term outlook remains constructive as quarterly burns continue reducing supply while Gate.io expands its products, services, and global user base. Sustainable tokenomics may become an increasingly important competitive advantage.
Bullish Factors
2.57 million GT permanently removed from circulation.
Continued reduction of total token supply.
Strong deflationary tokenomics.
Expanding Gate.io ecosystem and user adoption.
Long-term value supported by increasing scarcity.
Risks to Watch
Despite positive tokenomics, investors should continue monitoring:
• Overall cryptocurrency market conditions.
• Exchange trading volume.
• Regulatory developments.
• Competition among major crypto exchanges.
• Global macroeconomic trends affecting digital assets.
Final Thoughts
The 2.57 million GT burn in Q2 represents more than a routine quarterly event—it reinforces Gate.io's long-term commitment to building a sustainable and deflationary ecosystem. While no token burn can guarantee immediate price increases, consistent supply reduction combined with continued ecosystem expansion strengthens GT's long-term investment narrative.
For long-term investors, tokenomics remain one of the most important fundamentals, and GateToken continues to demonstrate why disciplined supply management can play a significant role in creating lasting value.
Disclaimer: This content is for educational and informational purposes only and should not be considered financial or investment advice. Cryptocurrency investments involve risk, and investors should always conduct their own research before making financial decisions.
✍️ Ai_Power
repost-content-media
GT-2.41%
SEC and CFTC join forces for on-chain regulation, Germany already has 280 MiCA licenses, the wave of compliance is truly coming.
Original content no longer visible
Load More