Option 1: The Analytical & Professional Approach (Best for Credibility)
Headline: 🚨 The $5 SHIB Dream: Hype vs. Math 🚨
Can Shiba Inu ($SHIB) actually hit $5 in the upcoming bull cycle? Let’s look past the hype and analyze the realistic metrics:
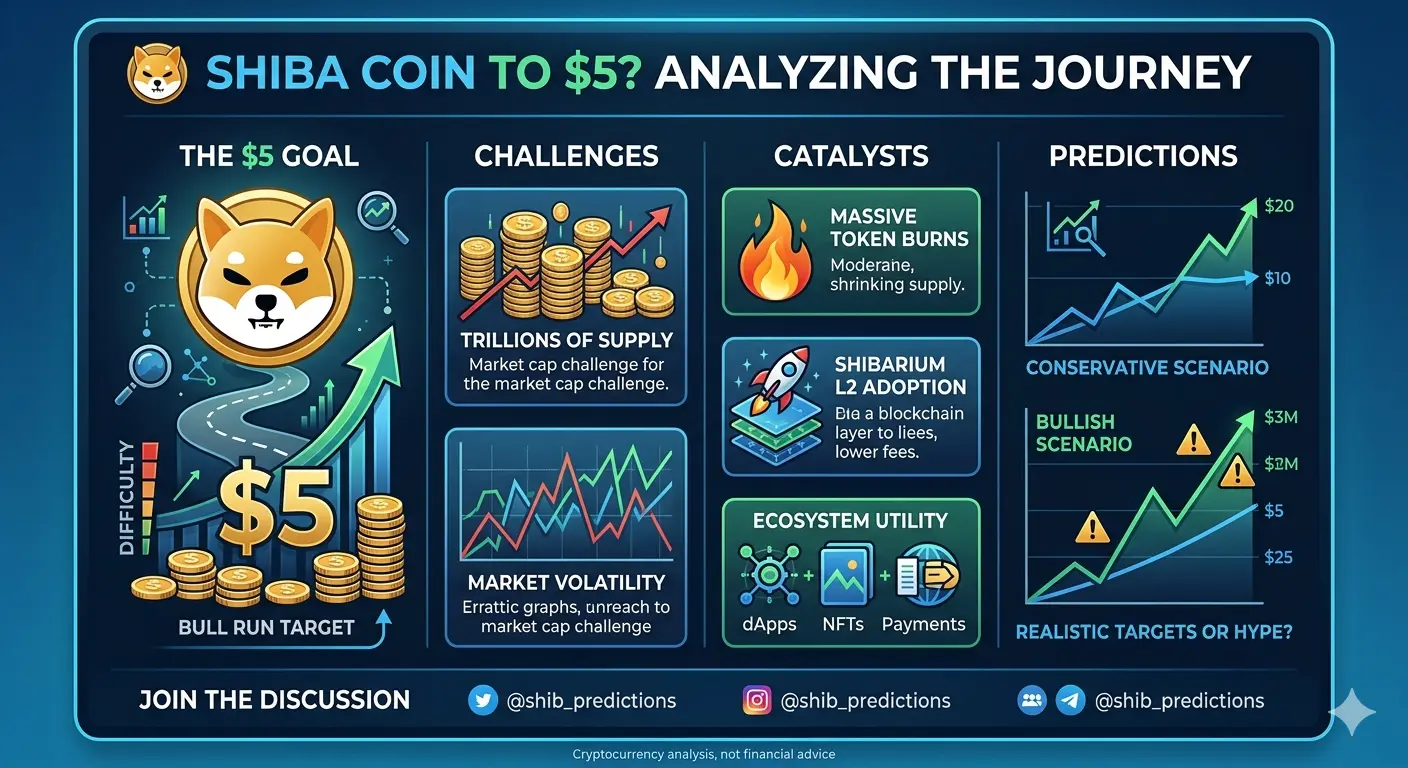
The Supply Constraint: With roughly 589 trillion SHIB tokens currently in circulation, a $5 target implies a market capitalization of nearly $3 quadrillion. For context, that is significantly larger than the entire global GDP.
The Ecosystem Factor: Thanks to the ongoing evolution of Shibarium (L2), automated transactional burn mechanisms, and privacy features via Fully Homomorphic Encryption (FHE), the underlying utility of SHIB is maturing far beyond its original meme origins.
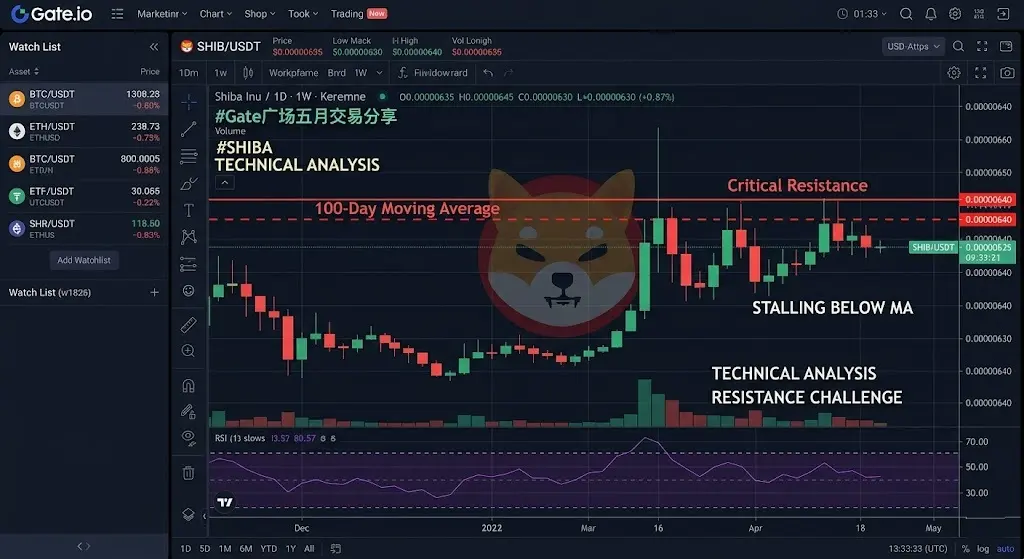
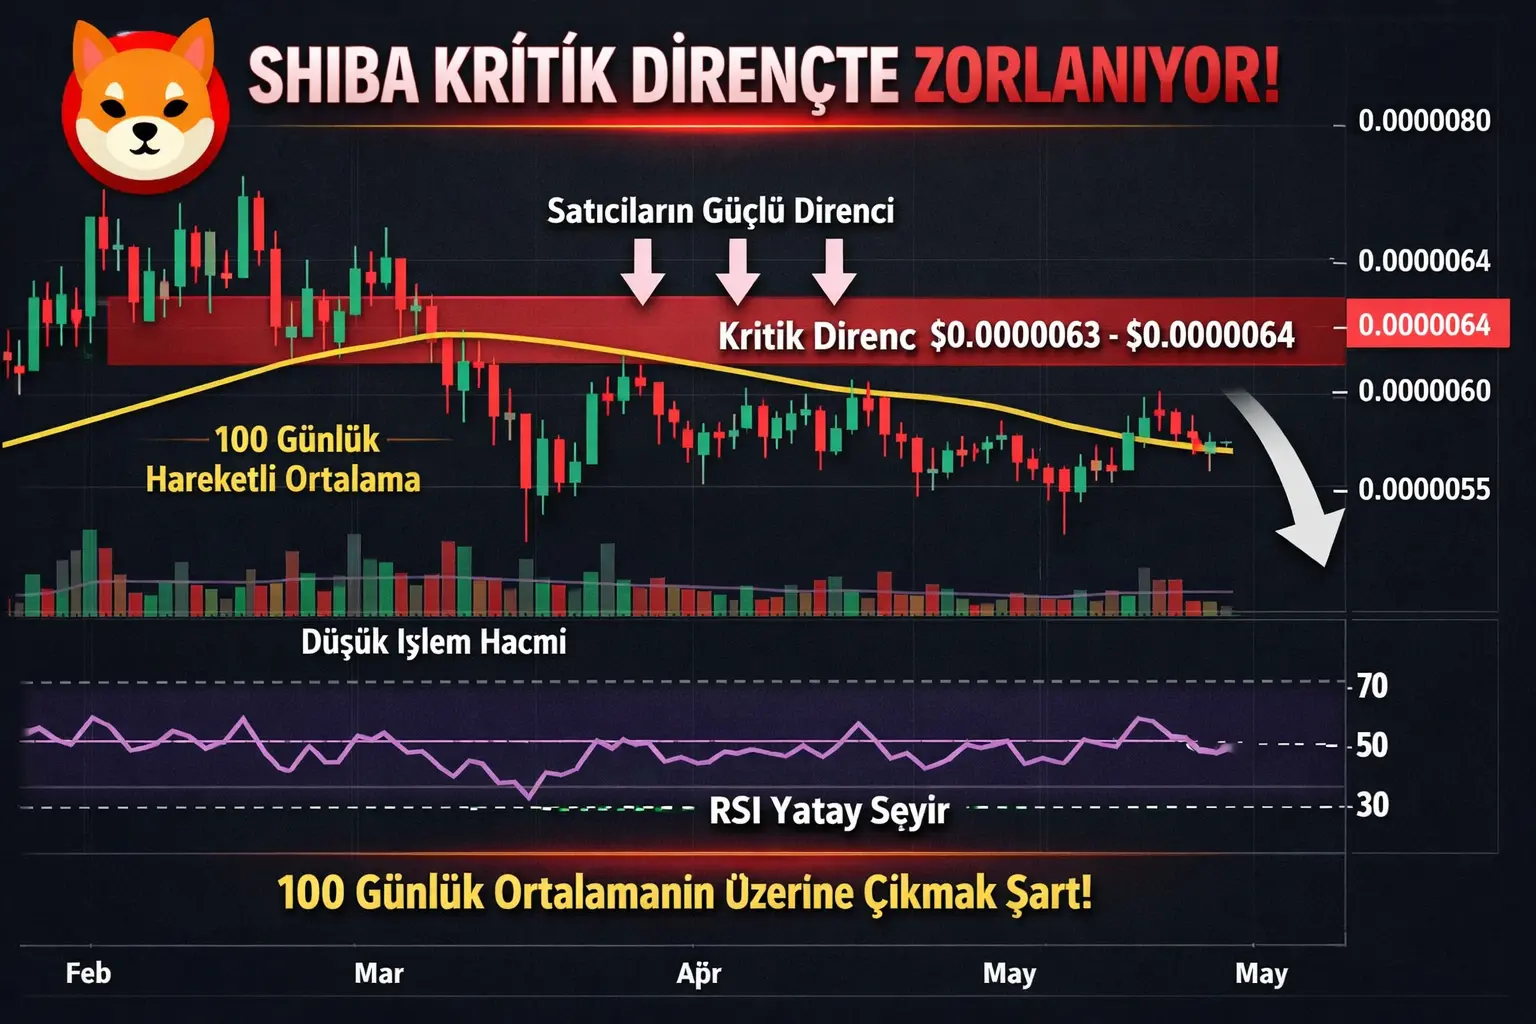
The Valuation Reality: While the structural improvements are highly encouraging, structural burns must reach historical velocity to impact unit economics on that scale. Realistic, upside targets for the height of the cycle sit closer to erasing a zero or two, rather than hitting single-digit dollar figures.
👇 Where do you stand on SHIB’s mid-term valuation? Drop your targets below.
#ShibaInu #SHIB Option 2: The Modern & Engaging Approach (Best for Virality)
Headline: 🚀 SHIB to $5 Next Bull Run? Let’s Do a Reality Check! 💸
The $SHIB Army is buzzing, and the speculation is getting wild. Is a $5 valuation mathematically achievable, or are we confusing long-term milestones with immediate targets? 📉📈
What the Data Shows:
The Macro Ceiling: Hitting $5 with today's 589 trillion token supply creates a mathematical paradox. To make structural multi-dollar progress, massive systemic supply contractions via Shibarium utility burns are required over the next several years.
Fundamental Progress: The "joke phase" is firmly in the rearview mirror. With Shibarium surpassing significant transaction milestones and structural integration continuing, the asset behaves with a much sturdier economic floor.
Let’s see where the consensus lies:
1️⃣ Hyper Bullish (Expecting new All-Time Highs soon)
2️⃣ Cautiously Optimistic (Tracking utility and burn rates)
3️⃣ Bearish (Expecting prolonged lateral consolidation)
👇 Vote or drop your exact numerical prediction below!
#CryptoTrading #SHIBA #MemeCoin #CryptoCommunity
Headline: 🚨 The $5 SHIB Dream: Hype vs. Math 🚨
Can Shiba Inu ($SHIB) actually hit $5 in the upcoming bull cycle? Let’s look past the hype and analyze the realistic metrics:
The Supply Constraint: With roughly 589 trillion SHIB tokens currently in circulation, a $5 target implies a market capitalization of nearly $3 quadrillion. For context, that is significantly larger than the entire global GDP.
The Ecosystem Factor: Thanks to the ongoing evolution of Shibarium (L2), automated transactional burn mechanisms, and privacy features via Fully Homomorphic Encryption (FHE), the underlying utility of SHIB is maturing far beyond its original meme origins.
The Valuation Reality: While the structural improvements are highly encouraging, structural burns must reach historical velocity to impact unit economics on that scale. Realistic, upside targets for the height of the cycle sit closer to erasing a zero or two, rather than hitting single-digit dollar figures.
👇 Where do you stand on SHIB’s mid-term valuation? Drop your targets below.
#ShibaInu #SHIB Option 2: The Modern & Engaging Approach (Best for Virality)
Headline: 🚀 SHIB to $5 Next Bull Run? Let’s Do a Reality Check! 💸
The $SHIB Army is buzzing, and the speculation is getting wild. Is a $5 valuation mathematically achievable, or are we confusing long-term milestones with immediate targets? 📉📈
What the Data Shows:
The Macro Ceiling: Hitting $5 with today's 589 trillion token supply creates a mathematical paradox. To make structural multi-dollar progress, massive systemic supply contractions via Shibarium utility burns are required over the next several years.
Fundamental Progress: The "joke phase" is firmly in the rearview mirror. With Shibarium surpassing significant transaction milestones and structural integration continuing, the asset behaves with a much sturdier economic floor.
Let’s see where the consensus lies:
1️⃣ Hyper Bullish (Expecting new All-Time Highs soon)
2️⃣ Cautiously Optimistic (Tracking utility and burn rates)
3️⃣ Bearish (Expecting prolonged lateral consolidation)
👇 Vote or drop your exact numerical prediction below!
#CryptoTrading #SHIBA #MemeCoin #CryptoCommunity