


#GateSquareMayTradingShare
#$NEAR
NEAR (NEAR Protocol) Current Chart Review – May 13, 2026
1. Current Price & Market State
NEAR moved in the 1.504 – 1.65 USD range in the last 24 hours and gained 5.87%. Current price is in the 1.646 – 1.663 USD band. Day high hit 1.666 USD, day low was 1.504 USD.
Market cap is at 2.01 – 2.13 billion USD, with supply in use at 1.295 billion NEAR. 24-hour trade size is 354 – 360 million USD, up 18%. The rise in size backs the price gain.
2. Time Frame Build & Chart View
Short and mid-term forms stay strong: on the 15-min, 4-hour, and daily charts, MA7 > MA30 > MA120 holds. This shows the up path holds across many time frames.
But signs of slower speed show up. MACD gives a “hidden up gap” on all time frames: price made a new peak while MACD did not. This hints the rise is losing push.
Overbuy tools are on: RSI is 70.27, J-value is 103.86 with KDJ in the overbuy zone. CCI and WR are also high. This level says price is near a short-term peak.
Bollinger Bands got wide, and price near 1.65 USD trades close to the top band. Touches of the top band often bring gains taken.
3. Key Levels
Support Zones:
• 1.603 – 1.61 USD: Key day base where buyers hold the line • 1.504 – 1.52 USD: 24-hour low and 4-hour MA30 zone, a break would speed sells • 1.31 – 1.35 USD: Main base on the weekly chart, goal if a 20% drop comes
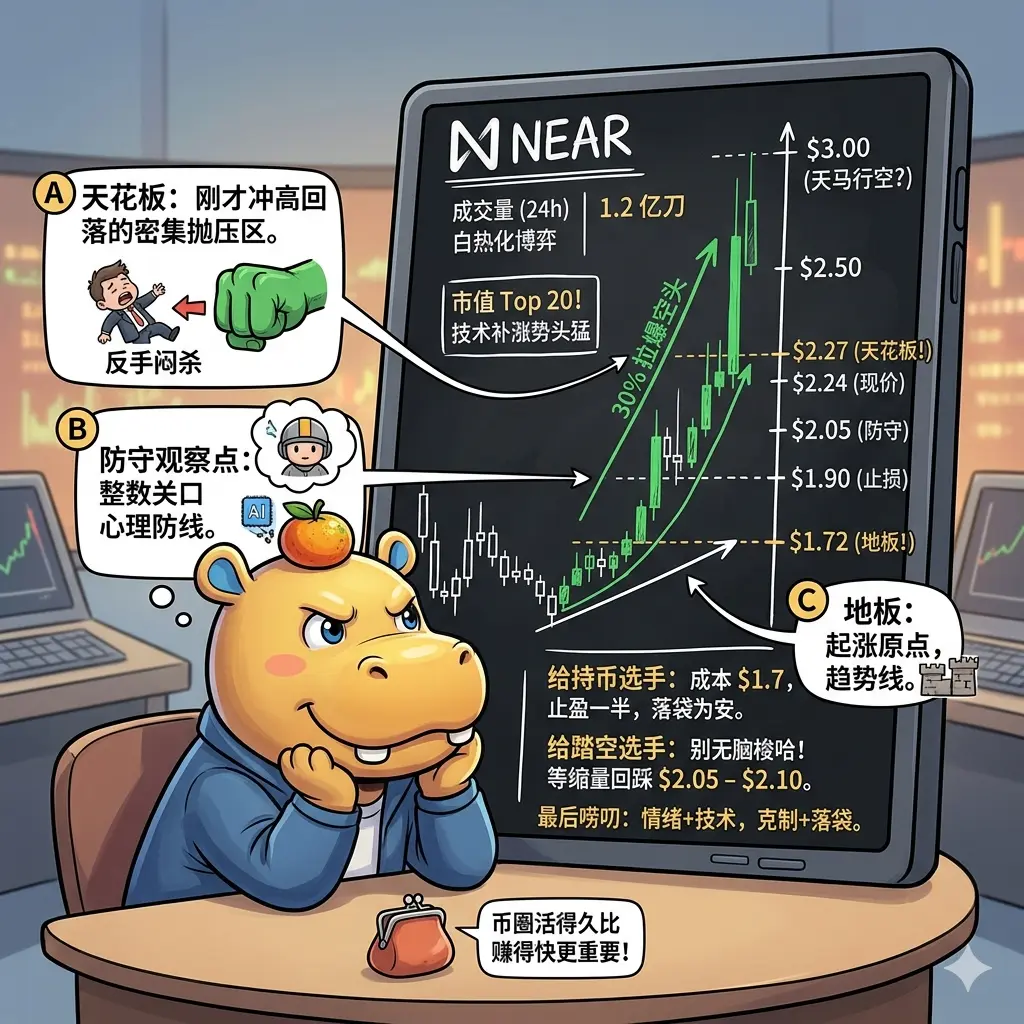
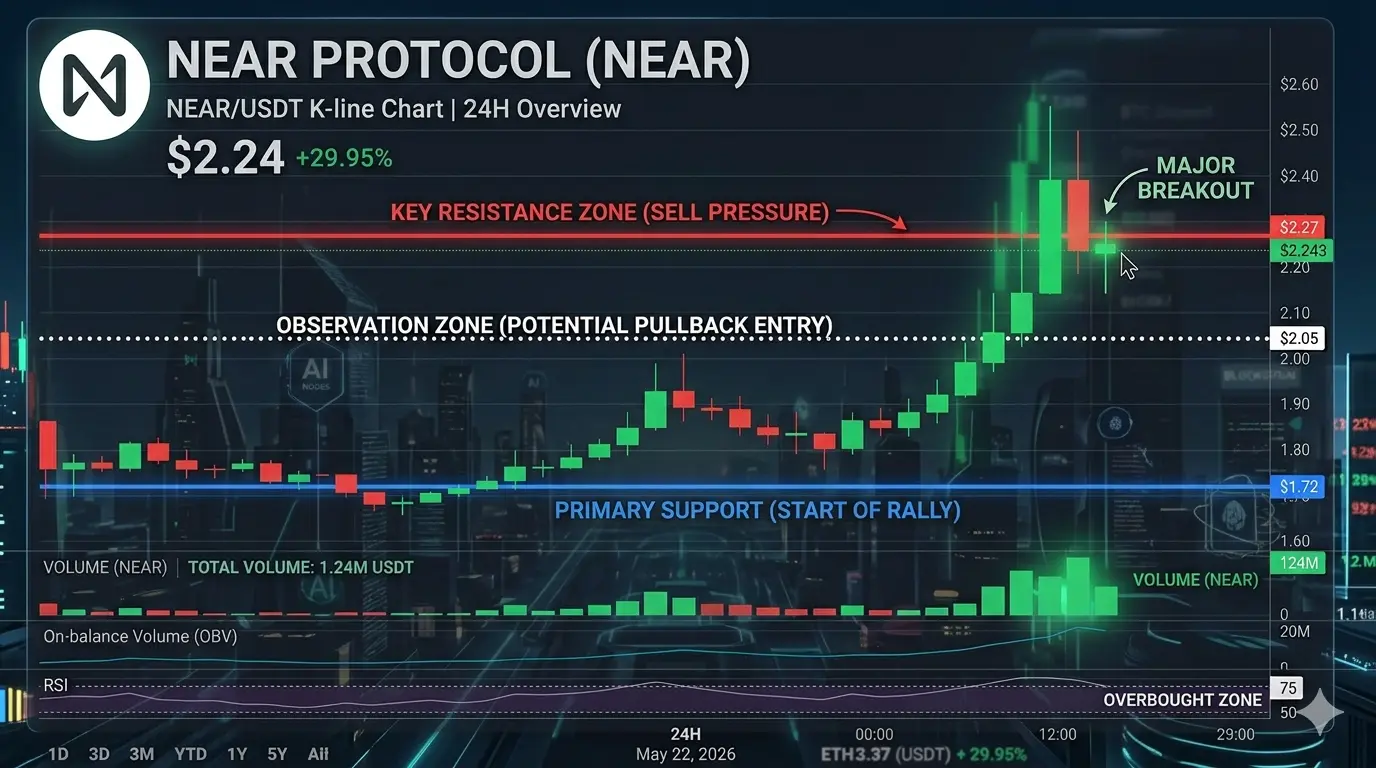
Cap Points:
• 1.65 – 1.666 USD: Day peak and near cap, needs high-size pass • 1.70 – 1.75 USD: Mind-level edge, above the Bollinger top band • 2.00 – 2.20 USD: Peak area after March 2026, mid-term goal • 20.37 – 20.42 USD: All-time peak from Jan 2022, long-term goal
A daily close above 1.65 USD opens the path to 1.75 USD and 1.90 USD. Hourly closes under 1.60 USD put the 1.50 USD base on the table.
4. Notes for Holders
• Speed Weakening: MA build is up but MACD shows a hidden up gap. This may mean the rise is in its last leg. Wait for proof before new buys. • Overbuy Risk: RSI 70.27, J-value 103.86, CCI and WR high. New buys at this point may face a short-term pullback. Taking gains makes sense. • Size Rise Is Good: 24-hour size rose 18%, while the broad market fell 18%. This shows flow moved to NEAR. • Core News: A swap link with a privacy coin was shared, with more than 100 tokens backed. In the Layer-1 group, it gained 20% this month, behind INJ and STRK, and did better than ATOM. • Swings: Bollinger bands are wide. After a touch of the top band, a move back to the mid band near 1.50 – 1.55 USD is common. • Risk Steps: 1.603 USD is main base. Think stop on closes below it. For bounce buys, watch the 1.52 – 1.55 USD band. Do not add new spots until a high-size close above 1.666 USD.
5. Quick View
NEAR bounced 5.87% in the 1.504 – 1.65 USD range. Many time frames keep an up MA line, so the trend is still up. But a MACD hidden gap, RSI at 70.27, J-value at 103.86, and other tools in overbuy raise short-term peak risk.
New buys are risky until the 1.65 – 1.666 USD cap breaks. As long as 1.60 USD holds, the build stays
$NEAR
#Gate广场五月交易分享
#$NEAR
NEAR (NEAR Protocol) Current Chart Review – May 13, 2026
1. Current Price & Market State
NEAR moved in the 1.504 – 1.65 USD range in the last 24 hours and gained 5.87%. Current price is in the 1.646 – 1.663 USD band. Day high hit 1.666 USD, day low was 1.504 USD.
Market cap is at 2.01 – 2.13 billion USD, with supply in use at 1.295 billion NEAR. 24-hour trade size is 354 – 360 million USD, up 18%. The rise in size backs the price gain.
2. Time Frame Build & Chart View
Short and mid-term forms stay strong: on the 15-min, 4-hour, and daily charts, MA7 > MA30 > MA120 holds. This shows the up path holds across many time frames.
But signs of slower speed show up. MACD gives a “hidden up gap” on all time frames: price made a new peak while MACD did not. This hints the rise is losing push.
Overbuy tools are on: RSI is 70.27, J-value is 103.86 with KDJ in the overbuy zone. CCI and WR are also high. This level says price is near a short-term peak.
Bollinger Bands got wide, and price near 1.65 USD trades close to the top band. Touches of the top band often bring gains taken.
3. Key Levels
Support Zones:
• 1.603 – 1.61 USD: Key day base where buyers hold the line • 1.504 – 1.52 USD: 24-hour low and 4-hour MA30 zone, a break would speed sells • 1.31 – 1.35 USD: Main base on the weekly chart, goal if a 20% drop comes
Cap Points:
• 1.65 – 1.666 USD: Day peak and near cap, needs high-size pass • 1.70 – 1.75 USD: Mind-level edge, above the Bollinger top band • 2.00 – 2.20 USD: Peak area after March 2026, mid-term goal • 20.37 – 20.42 USD: All-time peak from Jan 2022, long-term goal
A daily close above 1.65 USD opens the path to 1.75 USD and 1.90 USD. Hourly closes under 1.60 USD put the 1.50 USD base on the table.
4. Notes for Holders
• Speed Weakening: MA build is up but MACD shows a hidden up gap. This may mean the rise is in its last leg. Wait for proof before new buys. • Overbuy Risk: RSI 70.27, J-value 103.86, CCI and WR high. New buys at this point may face a short-term pullback. Taking gains makes sense. • Size Rise Is Good: 24-hour size rose 18%, while the broad market fell 18%. This shows flow moved to NEAR. • Core News: A swap link with a privacy coin was shared, with more than 100 tokens backed. In the Layer-1 group, it gained 20% this month, behind INJ and STRK, and did better than ATOM. • Swings: Bollinger bands are wide. After a touch of the top band, a move back to the mid band near 1.50 – 1.55 USD is common. • Risk Steps: 1.603 USD is main base. Think stop on closes below it. For bounce buys, watch the 1.52 – 1.55 USD band. Do not add new spots until a high-size close above 1.666 USD.
5. Quick View
NEAR bounced 5.87% in the 1.504 – 1.65 USD range. Many time frames keep an up MA line, so the trend is still up. But a MACD hidden gap, RSI at 70.27, J-value at 103.86, and other tools in overbuy raise short-term peak risk.
New buys are risky until the 1.65 – 1.666 USD cap breaks. As long as 1.60 USD holds, the build stays
$NEAR
#Gate广场五月交易分享