Square
Following
Hot
News
Notifications
Profile
Share your thoughts
placeholder
Article
Good morning, Zuo Zuo kept an eye on the crypto market all weekend for you ☕
Early Saturday morning, $BTC got knocked flat in the ring: a low of 55,130, its lowest in more than two years (since September 2024)
Then it got back up on its own: up about 9%, now back above 60,000, around 60,250 at 06:30 Taipei time
The cost of that fall 👇
About 1.8 billion dollars liquidated in 24 hours, including 1.3 billion in long positions
Realized losses hit 11.3 billion dollars in one week, 8 times the profits over the same period
Spot BTC ETFs saw about 1.1 billion dollars in net outflows in one week
The
post-image
BTC-0.67%
$IDOL This rally has entered a clear topping zone, and I’ve already entered a short position. My take-profit target is below 0.035. Those who want to short alongside me can follow suit. 📉🔥
Risk warning: The above is only a record of my personal trades and does not constitute investment advice. Contract trading carries extremely high risk, so please manage your position carefully.
post-image
IDOL-6.71%
  • 1
Trenches
IDOL
I
bade
b
IDOL
0x3b...ab07
Market Cap
$.
Change
.
24h Vol
$.
Holders
.
PIEVERSE
P
bade
b
PIEVERSE
0x0e...25a9
Market Cap
$.
Change
.
24h Vol
$.
Holders
.
FIONA
F
bade
b
FIONA
B34n...pump
Market Cap
$.
Change
.
24h Vol
$.
Holders
.
Singularity
S
bade
b
Singularity
7R4M...pump
Market Cap
$.
Change
.
24h Vol
$.
Holders
.
CLAUDIA
C
bade
b
CLAUDIA
2j5S...W2ZM
Market Cap
$.
Change
.
24h Vol
$.
Holders
.
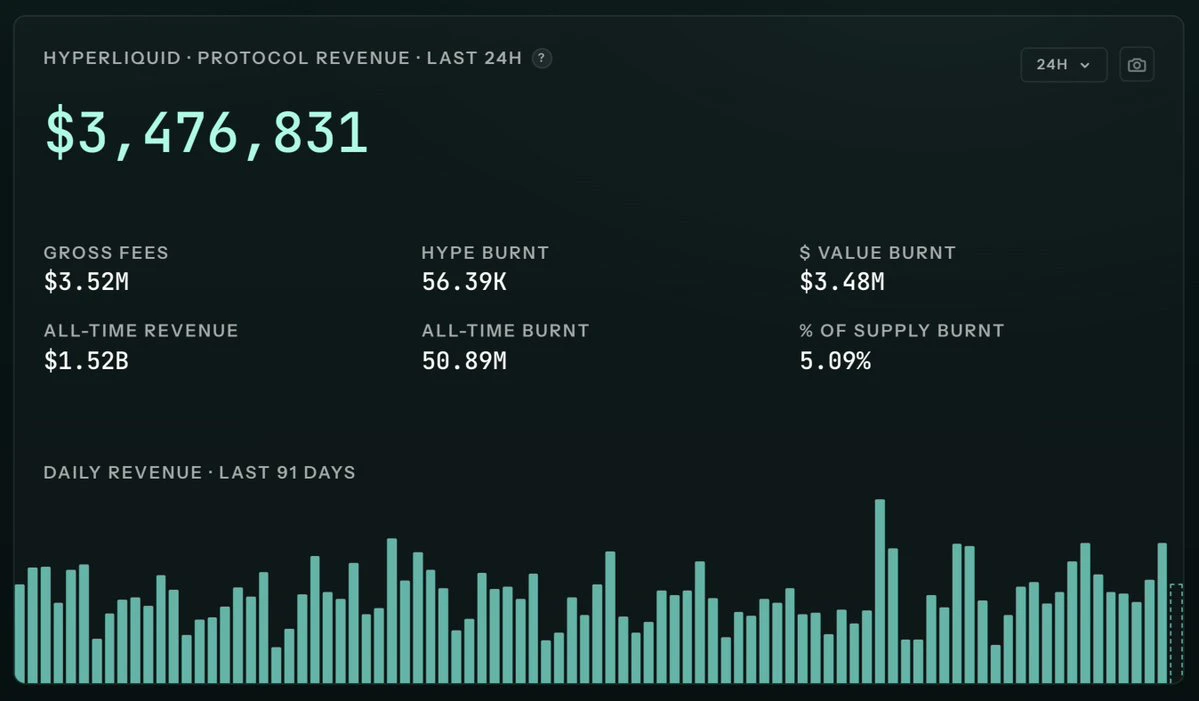
$HYPE is down 40%, but hyperliquid still makes $3M+ a day in revenue
what is zcash doing these days
post-image
HYPE+0.24%
ZEC+1.16%
$NAORIS Up 15% in a day, touching a high of 0.036—is the “breakout pattern confirmed”?
There’s a widely circulated claim: once the price clears the previous high and closes green on heavy volume, the pattern is confirmed and it’ll keep moving up. Sounds convincing, but doesn’t hold up in practice. Today’s 24-hour trading volume was 13.8M. In a 15% green candle, that volume shows there was turnover, but also that selling pressure was absorbed—and being absorbed doesn’t mean it’s all been cleared. Looking at the move from 0.0296 to 0.036, the price has already covered a lot of ground. Structural
NAORIS+0.66%
  • 1
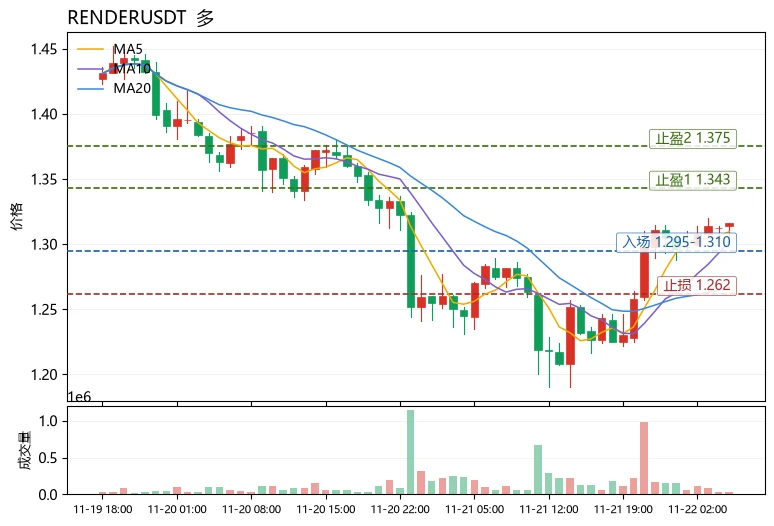
Fear and Greed Index is only 12, and the market is in the extreme fear zone, yet $RENDER bucked the trend and rose 3.62%—this divergence is the most unusual detail in today's market. Funds are not pulling out amid fear, suggesting bulls are quietly accumulating.
Technically, $RENDER is currently at 1.316, with MA5=1.3096 above MA20=1.2666, indicating a bullish short-term moving average alignment; RSI=59.0 is strong but not overbought, while the MACD histogram at +0.009781 maintains bullish momentum. The upper Bollinger Band at 1.34351 is the immediate resistance, and the price is trading near
post-image
RENDER+0.47%
DODO+11.43%
RARE-0.89%
$SUI is strong on the 1-hour timeframe and weak on the 4-hour timeframe; direction remains unresolved
$SUI is currently trading at 0.6455 USDT, down 1.53% over 24 hours, with a range of 0.5882–0.6597. The 1-hour trend is strong while the 4-hour trend is weak. Should we focus on the 1-hour timeframe or wait for 4-hour confirmation?
My view: I’d rather see this as a direction that remains unconfirmed than rush to label it a rebound or a pullback.
The 1-hour support and resistance levels are 0.5882 and 0.6597, respectively, while the corresponding 4-hour boundaries are 0.5882 and 0.7392. The 1-h
post-image
SUI-1.05%
Btc market prediction update
live-cover
LIVE1,321
BTC-0.67%
ETH-1.26%
SOL-0.77%
XRP-1.15%
🔹 Fear Grips Global Markets as Wall Street Approaches a Critical Point
live-cover
LIVE2,154
BTC-0.67%
#BTCBreaksBelow60K #ShareWeekly
Bitcoin has experienced a significant market shock after falling below the psychologically important $60,000 price level. This development has attracted considerable attention from investors, traders, and analysts across the global cryptocurrency market. The breakdown represents an important shift in market sentiment, particularly because Bitcoin had previously maintained strong investor interest around higher price levels. On November 20, Bitcoin dropped below $60,000 for the first time since July, while the selling pressure continued and pushed its price towar
BTC-0.67%
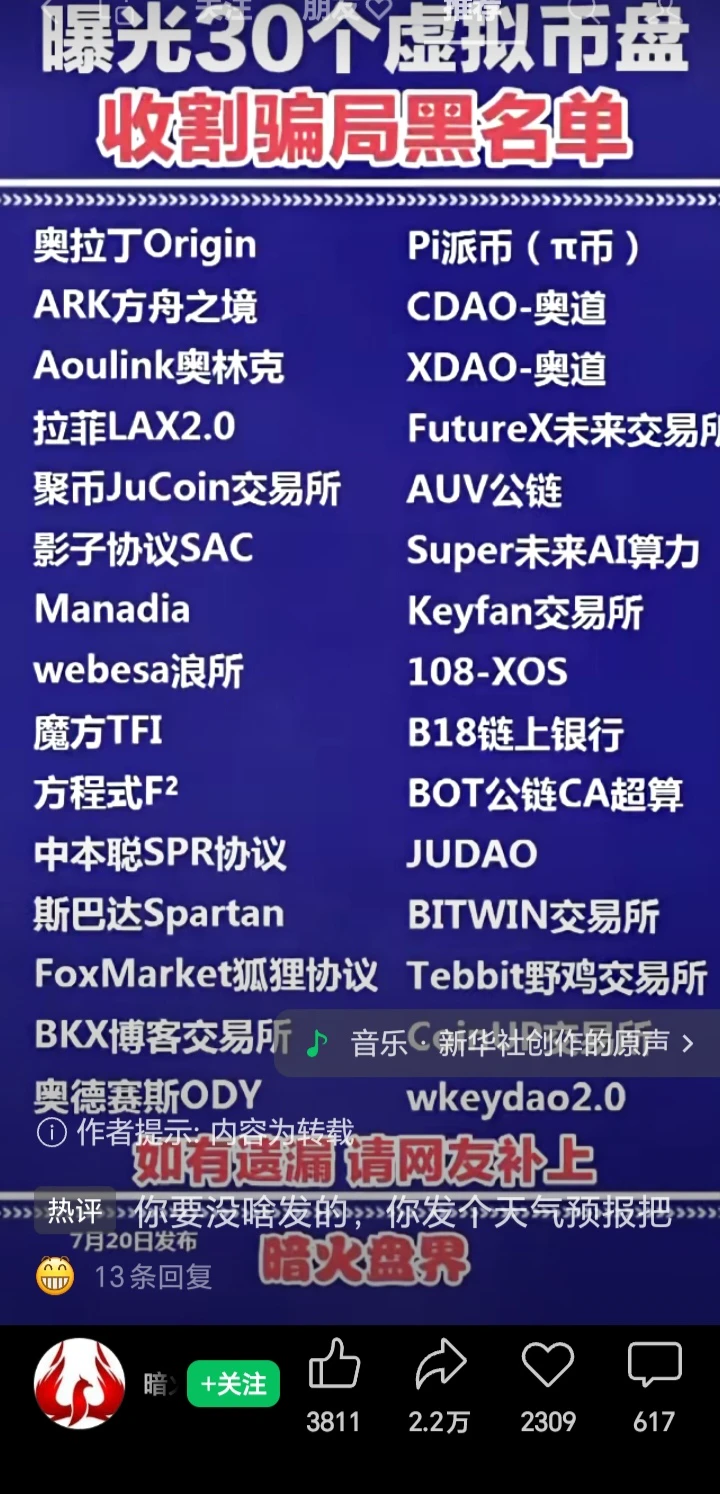
#PI News, everyone, any thoughts??
post-image
PI-0.60%
  • 1
Nvidia just lost nearly $900 BILLION in one week.
And Nvidia-backed funding rounds account for 27.2% of global venture deal value this year.
It sells AI chips, funds the companies buying them, and owns stakes in their success. That's a dangerous amount of the AI economy tied to one company.
When Nvidia cracks, how much of the AI boom cracks with it?
NVDA-13.84%
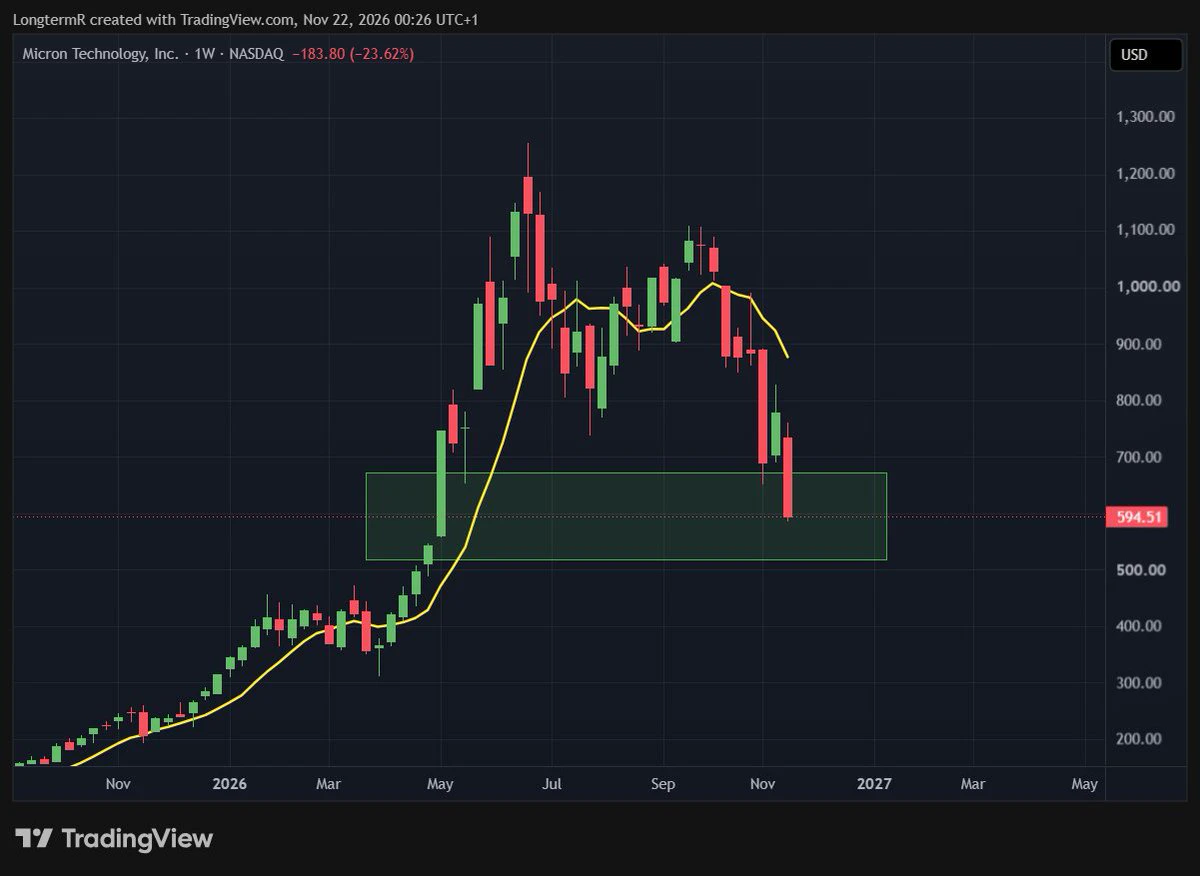
$MU Yeah, I know Micron looks like s*it here.
But it is actually in the Fib retracement area box.
Good to know ✍️🏼
post-image
MU-13.88%
Okay, $SKHYNIX , we understand—the resistance level is hard to break through today. You’ve worked hard enough, and it’s time to catch your breath. Let’s see whether you have the strength to keep going or whether it’s time to call it a day. TP: 734.06SL: 796.72Other coins: $ZEC : Current price 786.23 - 24-hour change: +6.28%$PIEVERSE : Current price 3.4076 - 24-hour change: +14.87%
post-image
SKHYNIX+1.41%
ZEC+1.16%
PIEVERSE+0.58%
At 5 a.m., this street healed me.
post-image
She doesn't know that I'm down 6 figures this month
post-image
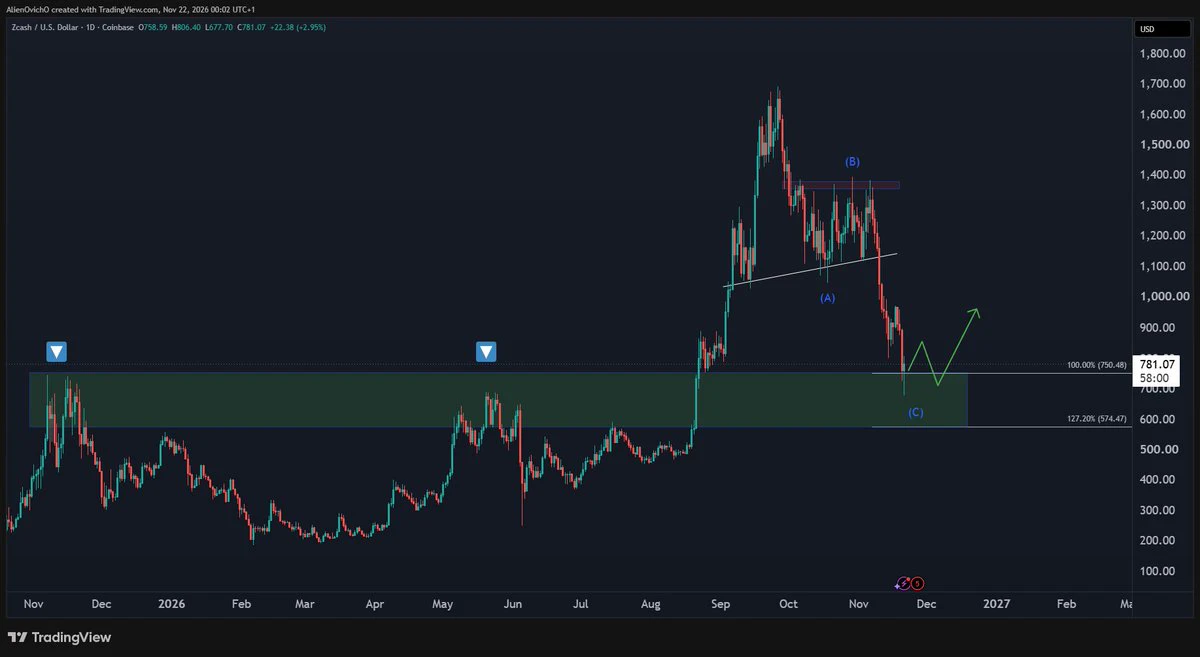
$ZEC is back inside the daily buying zone 🎯
750–575 retests both the 2025 highs and the May 2026 peak, and old resistance is now support.
I expect price to carve a bottom around this area before the 2027 rally.
Accumulating here or waiting lower?
post-image
ZEC+1.16%
Long
$DODOX ‼️ Entry price: 0.03950 - Current price take profit: 0.04366 Stop loss: 0.03600
post-image
DODOX
DODOXDODOX
Pump.Fun
MC:$2.22KHolders:87
32.76%
Driven by active trading volume, price action continues to edge higher; despite limited overall market participation, resistance remains intact. The uptrend is showing initial momentum, but the indicators have yet to fully align, suggesting the move may stall. $AKE — Long entry: 0.005343 Take-profit 1: 0.005401 Take-profit 2: 0.005450 Stop-loss: 0.005129
post-image
AKE+6.07%
$XRP The current 1-hour and 4-hour trends are showing a clear divergence. The 1-hour timeframe is bullish, with the RSI as high as 74.12, while the 4-hour timeframe is bearish, with the RSI at just 39.37. Short-term traders may see a strong uptrend, while investors focused on longer timeframes may think the market remains under downward pressure. This divergence makes the current trend difficult to assess, especially with the price already nearing the 1-hour resistance level of 0.9389.
I would choose to wait at this level, as chasing a long position carries significant risk. The current price
post-image
XRP-1.15%
$NVDAB 131.05, 24H +1.61%. The 1h chart looks relatively strong, but RSI at 69 is nearing overbought territory. Volume is only 0.21x the average, and price has yet to break above the 131.5 resistance. I’m watching this level closely: I’ll only consider higher prices if it holds above 131.5; a break below 127.4 would turn the short-term outlook bearish. Short-term momentum is still settling, so I’m mostly waiting for a clear direction before acting. I’ll watch the chart and decide. Keep monitoring. No need to rush. Not investment advice
#NVDAB
post-image
Load More

Join 40 M users in our growing community

⚡️ Join 40 M users in the crypto craze discussion

💬 Engage with your favorite top creators

👍 See what interests you

Trending Topics

BTCBreaksBelow60K

2.1M Views30K Discussing

BTC fell below $60,000 on November 20 for the first time since July, alongside a tech stock selloff and broader pressure on risk assets. Will $60K become resistance, or can BTC quickly reclaim it? What price or volume signals would convince you that selling pressure is easing?

GateDirectIPOPhase3ANTAllocates92100Shares

797.2K Views4.9K Discussing

NvidiaDropsNearly14Percent

333.9K Views7.6K Discussing

View More