Square
Following
Hot
News
Profile
Share your thoughts
placeholder
Article
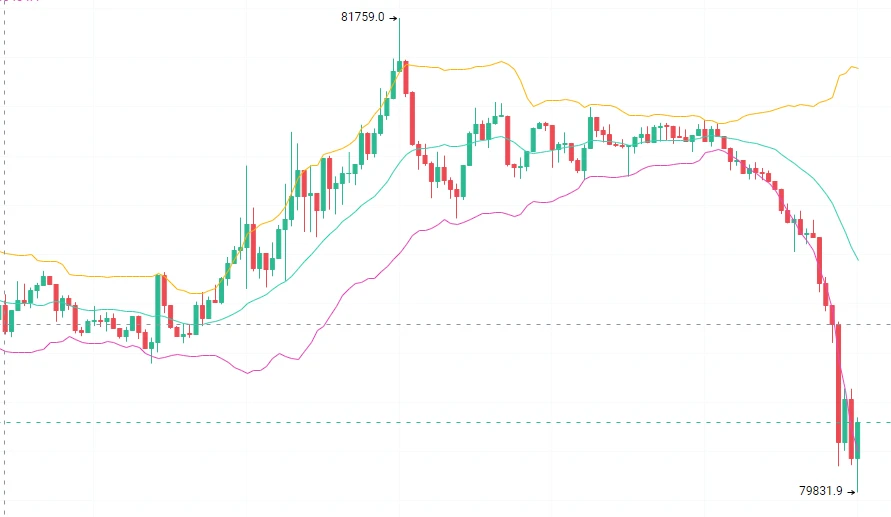
10.29 Bitcoin Positioning Strategy$BTC
After the market surged to a high of 81759, bullish momentum gradually faded and prices came under pressure and pulled back. The upper Bollinger Band began turning downward, and the candlesticks continued to move away from it, successively breaking below the middle Bollinger Band support. The channel shifted from an upward trend to opening downward.
Prices are currently continuing to weaken along the lower Bollinger Band, with bearish pressure concentrated and selling accelerating. Bears are in control in the short term, with no clear signs of stabilizat
post-image
BTC-0.65%
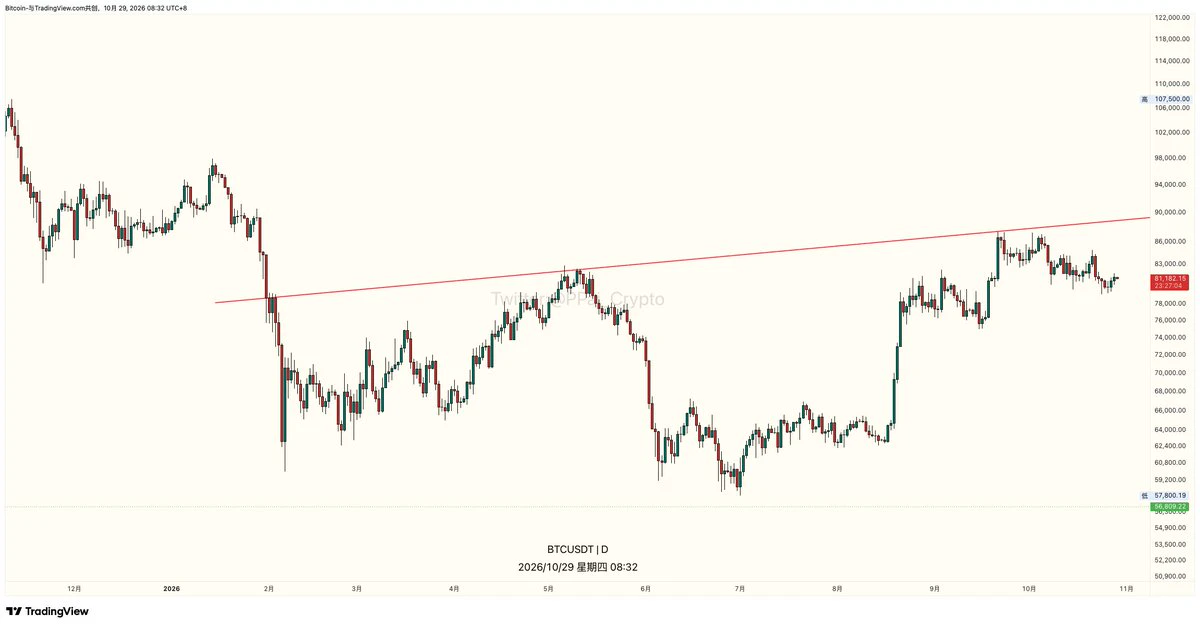
I went through the ETF numbers and found something that doesn’t add up.
Bitcoin ETFs have seen $286 million flow back in over the past two days, 90% of it from BlackRock. Over the same period, the price has only moved 1.4 points and is now at 80.9K.
The money came back, but the price didn’t.
Ethereum’s numbers are more straightforward: it saw net outflows of $1.32 billion in October.
Bitcoin’s hole has been filled, but Ethereum’s is still leaking.
All through October, it was just money moving between two wrappers. The total didn’t grow.
There’s no new money at this level. The move up is driven
post-image
BTC+0.98%
ETH+1.07%
BLK+2.06%
Trenches
TTWO
T
bade
b
TTWO
TTWo...FbKo
Market Cap
$.
Change
.
24h Vol
$.
Holders
.
BNCB
B
bade
b
BNCB
0x49...ec3f
Market Cap
$.
Change
.
24h Vol
$.
Holders
.
STONK
S
bade
b
STONK
6GmA...UNgx
Market Cap
$.
Change
.
24h Vol
$.
Holders
ZIG
Z
bade
b
ZIG
0x8c...1145
Market Cap
$.
Change
.
24h Vol
$.
Holders
.
Q
Q
bade
b
Q
0xc0...0589
Market Cap
$.
Change
.
24h Vol
$.
Holders
.
Scumbag's take on GOOGLE (Google)
A few days ago, while browsing X, Scumbag spotted an opportunity to copy Buffett, so he checked Google's chart. His impression at the time was that it looked like it hadn't finished falling yet, so he placed a long order near the yearly moving average.
When he got up this morning, he saw that the order had filled, and it’s currently showing a small profit.
Let’s take a look at Google’s Q3 earnings. Given how extraordinary Google’s Q2 earnings were, they were clearly unsustainable (the spcx listing brought nearly 100 billion in investment gains). In Q3, its inv
GOOGL+1.58%
SPCX-2.26%
Every day, I open my account and see a little more in staking rewards. It feels pretty good. But when I do the math at the end of the month, why is the value in U lower than when I started?
You need to look at two things at the same time: how many coins you have and how much each coin is worth now.
It’s like running a fruit shop. The apples in your warehouse go from 100 crates to 105, so you have more apples. But if the price per crate drops from 100 yuan to 80 yuan, the value of the whole stock still goes down.
Staking works the same way. Say you started with 100 coins, each worth 10 U, for a
post-image
[ NEW STREAMER ]TODAY MARKET TALK
live-cover
LIVE1,965
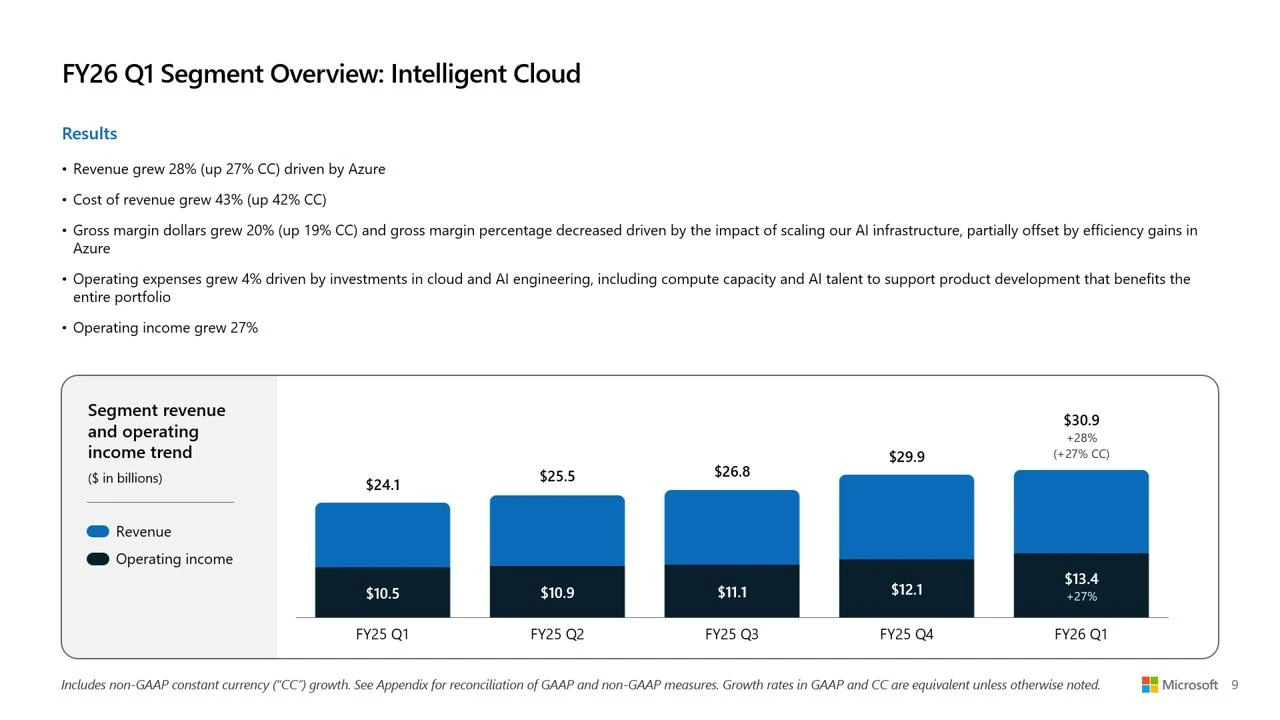
Google Cloud revenue surged 103%, yet its stock was hammered nearly 10%! Microsoft’s grew just 48%, but the market rewarded it?
These two earnings reports from last night are well worth a closer look.
Both are AI giants, and both are racing to build data centers, but their stocks moved in completely opposite directions after hours.
① Microsoft’s earnings were genuinely solid
Quarterly revenue was $92.3 billion, up 19% year over year, with net income of $36.6 billion.
The standout was Azure: revenue grew 48%, above market expectations.
Microsoft not only proved there’s demand for AI, but also t
post-image
GOOGL+1.58%
MSFT+0.17%
  • 3
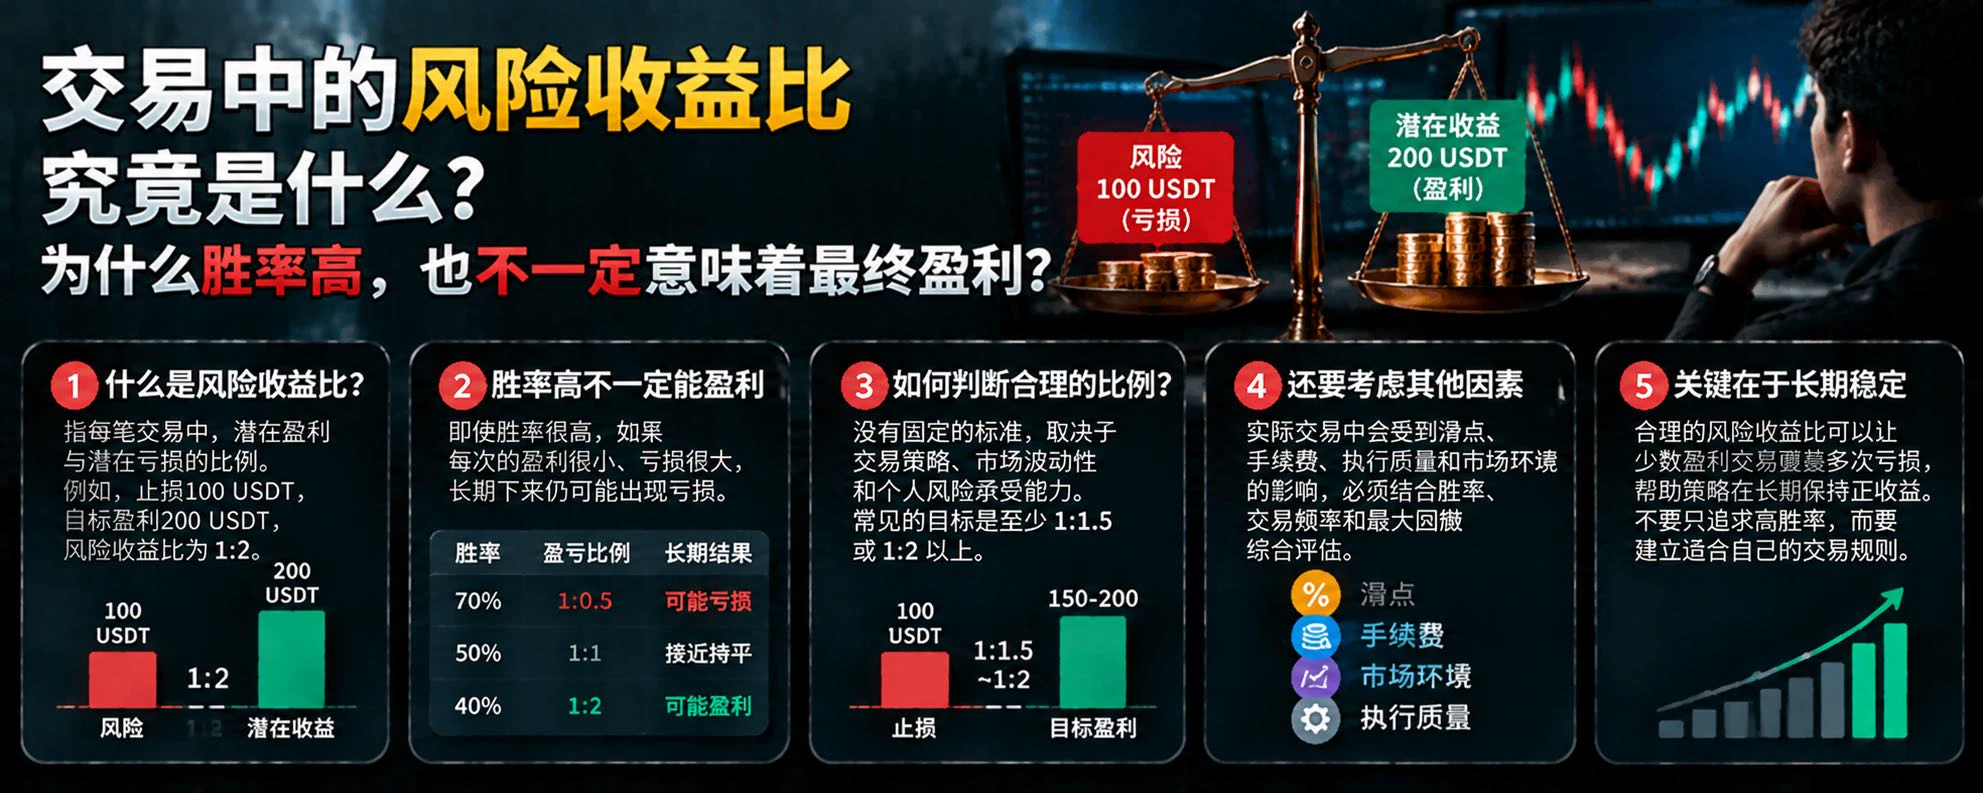
What Is Value at Risk (VaR)? Can It Tell Us How Much Our Account Could Lose?
In cryptocurrency trading, many people calculate returns, but few carefully estimate how much their accounts could lose in adverse market conditions. Value at Risk (VaR) is a commonly used risk measurement tool that can help us understand potential losses from a probabilistic perspective.
First, what exactly is VaR?
VaR is typically used to estimate the potential loss threshold for a particular position over a given time horizon and at a specified confidence level. For example, a 1-day 95% VaR of 1,000 USDT for an acc
post-image
  • 1
Halloween 🎃 Candy challenge carnival week
live-cover
LIVE1,889
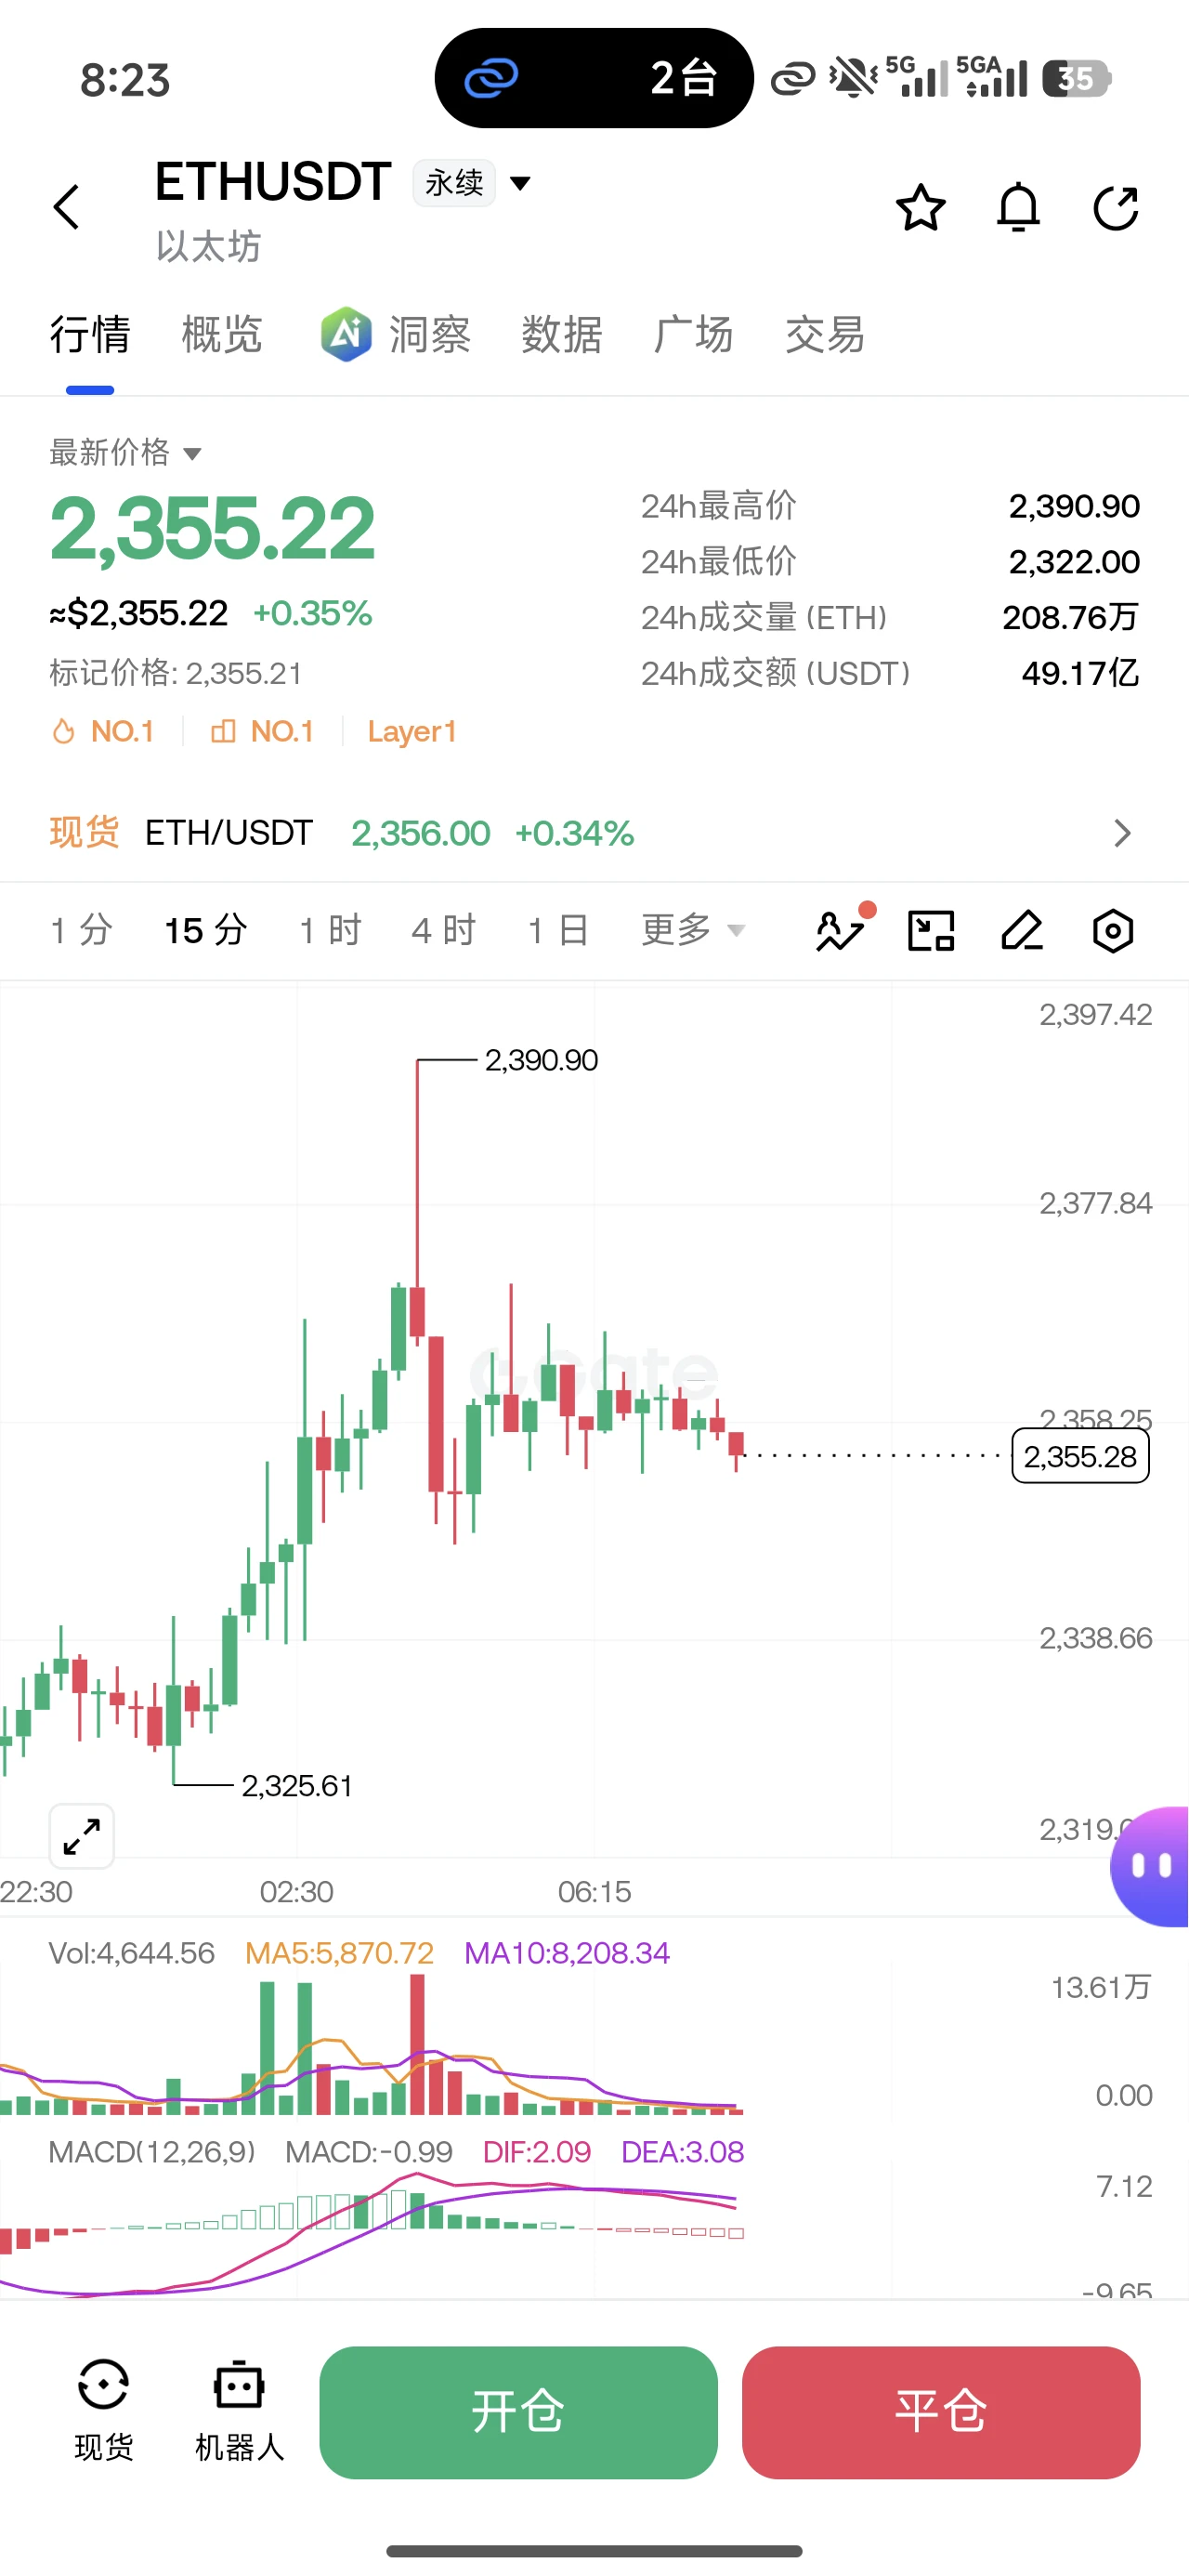
ETH fell 0.59% over a 15-minute window. Attribution indicates the move was driven mainly by technical fluctuations amid a lack of directional consensus and localized capital impacts in shallow order books, rather than a single confirmed news catalyst. The snapshot showed bullish 4-hour moving averages and neutral aggregate technical signals, consistent with mild fluctuations. Open interest denominated in ETH remained near its previous peak, while the funding rate was slightly above zero, indicating that leverage and directional confidence remained, but not proving that closing positions trigge
post-image
ETH-1.23%
BTC-0.67%
Every day, I open my account and see that another bit of staking rewards has arrived, which feels pretty good. But when I calculate it at the end of the month, why is the value in U lower than when I started?
You need to look at two things at the same time: how many coins you have and how much each coin is worth now.
It’s like running a fruit shop. The number of apples in your warehouse goes from 100 boxes to 105, so you have more apples. But if the price per box drops from 100 yuan to 80 yuan, the value of the whole batch still falls.
Staking works the same way. Say you started with 100 coins
post-image
$PEPE The final big move is here—Sun seems to have the inside scoop after all, with PEPE surging 14% yesterday.
Today, PEPE’s price climbed back above $0.000005, up more than 14% in 24 hours. On-chain data revealed that addresses linked to Justin Sun quietly started buying the dip in mid-October, at a purchase cost of just $0.000004115. His unrealized gains have now reached $9.62 million, and his holdings account for 2.86% of PEPE’s total supply, putting him among the largest individual holders on-chain.
There’s even more room for speculation: the first PEPE spot ETF has also made progress. U
PEPE+1.05%
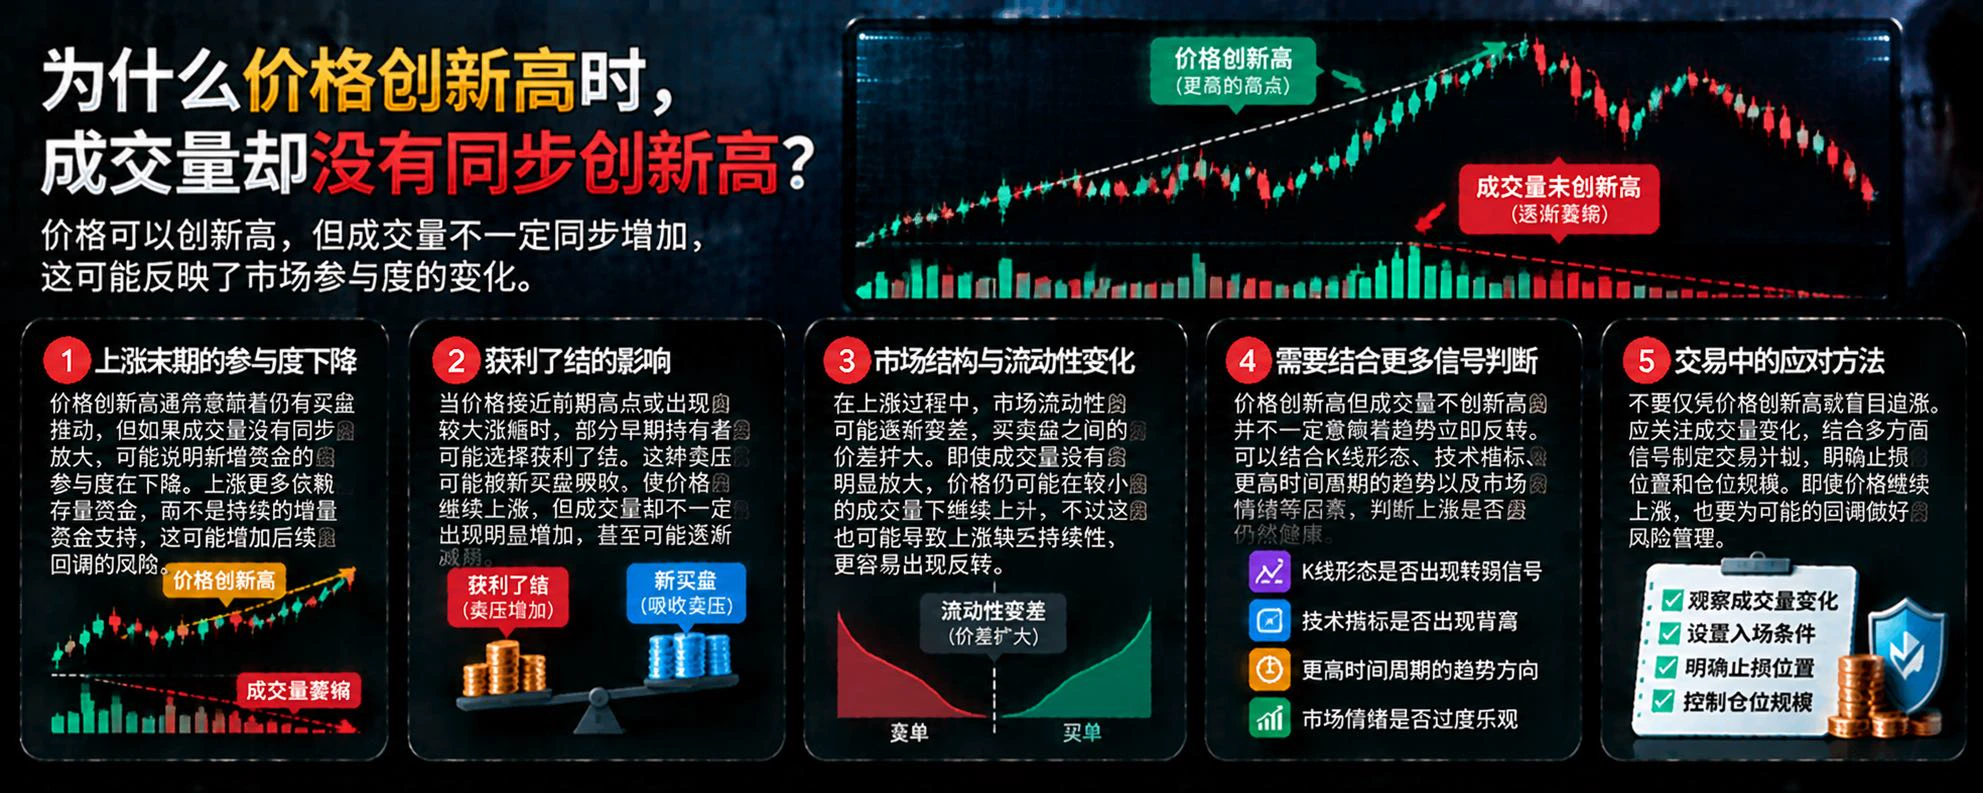
Price rises and OI increases: Does this mean capital is entering or risks are building up?
In crypto derivatives trading, when prices rise and open interest (OI) also increases at the same time, many people assume that longs are continuing to enter the market and that prices may keep rising. But this judgment is not always correct, because OI reflects outstanding contract exposure, not the market’s net long capital.
First, what do rising prices and rising OI indicate?
This usually means that outstanding contract exposure is also increasing as prices rise, and market participants are opening or
post-image
  • 1
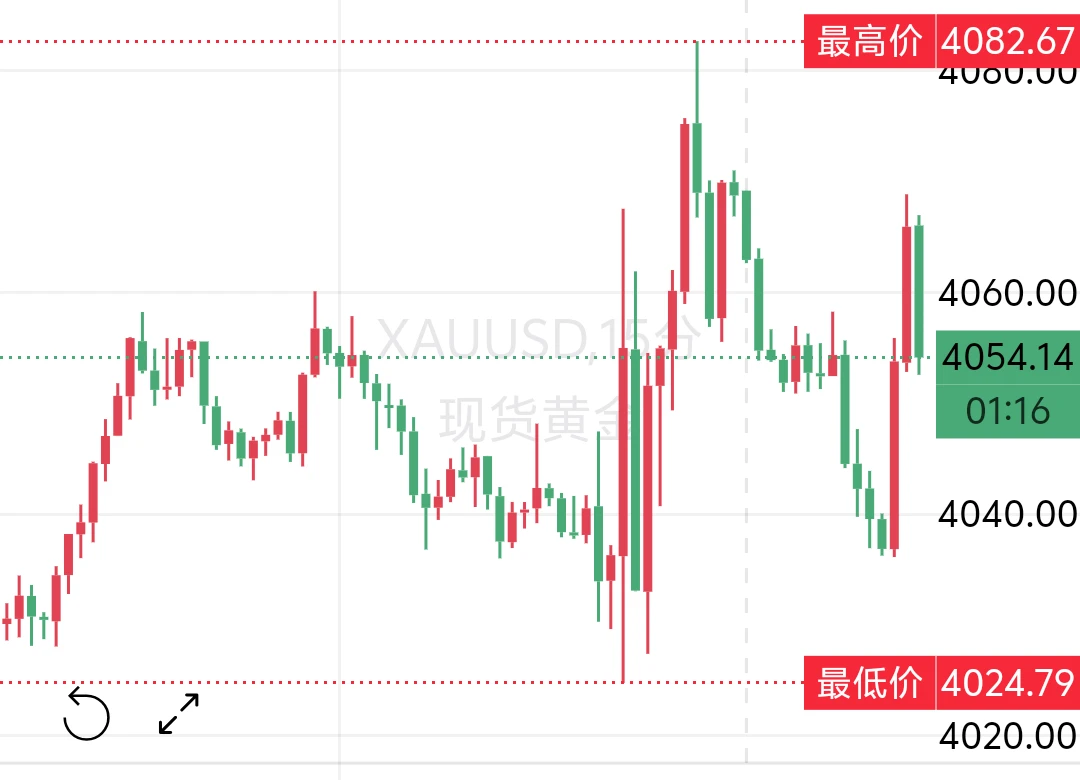
10.29 Thursday Morning Zhong Ling Gold Silk Dew
The Fed decision triggered a major shakeout, with gold bottoming at 4024 before surging and pulling back. After rising on the hourly chart, prices continued to retrace under overhead pressure. After the news passed, the market entered a volatile consolidation phase.
The short-term support held on the lower timeframes, but overhead resistance remains significant, with fierce battles between bulls and bears. The vote on the decision was divided, while today's PCE and jobless claims data will continue to drive price action.
4070 was yesterday's shor
post-image
XAU+0.38%
BTC-0.65%
Allium, Blockchain Data Provider Serving Visa, Stripe and Coinbase, Discloses Security Breach
Blockchain data infrastructure provider Allium disclosed that it detected unauthorized access to certain systems on October 25. The company has notified affected customers and engaged an independent cybersecurity firm to investigate. Its core services, including the Allium App, Explorer, and Explorer APIs, are back online, although some features remain unavailable. Allium has not disclosed the full scope of the incident. The company raised $40 million in Series B funding in June and serves clients inc
V-0.17%
COIN+0.75%
I wonder if there's a chance to go long around 22980 when the market opens shortly! Watch the signals 😅 and keep making profits
  • 7
Why could falling prices and rising OI indicate stronger bearish pressure while also signaling a risk of a rebound?
In the crypto derivatives market, when prices continue to fall while open interest (OI) rises at the same time, many traders assume that short positions are increasing and the market may continue to weaken. But this is only one possible explanation; the market direction cannot be confirmed based on just two indicators.
First, what do falling prices and rising OI mean?
This means that open contract exposure is increasing as prices fall. New long and short positions may be opening,
post-image
  • 1
Morning: 44040 at the current price; the target has been reached, with 20 points of room. Everyone, feel free to do as you like! $XAU ‌
XAU+0.38%
What Is Position Concentration? Why Can the Risk of a Single Coin Affect an Entire Account?
In cryptocurrency trading, some traders concentrate most of their funds in the coins they are most bullish on, believing that if their judgment is correct, they can earn higher returns. But when the market moves against expectations, a decline in a single asset can have a significant impact on the entire account.
First, what is position concentration?
Position concentration refers to the degree to which an account's funds or risk exposure are concentrated in a particular asset, sector, or trading direct
post-image
BTC-0.67%
IRYS | Short-term short 🔴 | Bearish | 15m 24-hour change: +0.43% | Volume: 55.6M USDT Short rationale: Price below EMA200; EMA20/50/200 are bearishly aligned; RSI14 is 46.7; MACD histogram is negative; ADX14 is 21.5; volume is 3.85 times the average of 20 candles; trend pullback/continuation. Entry: 0.02341 Stop-loss: 0.0248108 Take-profit 1: 0.021659 | Take-profit 2: 0.0206084 | Take-profit 3: 0.0192075 Entry price is for reference only; do not chase the trade. The strategy is invalidated if the stop-loss level is hit. Technical analysis only; this is not investment advice. $IRYS $IRYS
post-image
IRYS-22.27%
Load More

Join 40 M users in our growing community

⚡️ Join 40 M users in the crypto craze discussion

💬 Engage with your favorite top creators

👍 See what interests you

Trending Topics

FedKeepsRatesSteady

37.44k Views1.75k Discussing

The Fed will announce its rate decision on October 28 at 18:00 (UTC), followed by a press conference at 18:30 (UTC). Markets widely expect rates to remain unchanged, with attention turning to future policy signals. Could this decision break crypto out of its trading range? What signals are you watching?

GateFirstToLaunchGoldCFD7X23Trading

68.27k Views6.45k Discussing

GoogleCloudSurges103%ButStockFalls

71.82k Views528 Discussing

View More