Square
Following
Hot
News
Profile
Share your thoughts
placeholder
Article
$XNY It’s now at 0.0061, up 12.54% in 24 hours, but I just dumped everything I bought last Friday at 0.0055 for 0.0064. Don’t ask why—just look at the sentiment indicators: the Fear & Greed Index surged to 78 today, and the funding rate is +0.08%. The last time it reached this level was three months ago, when XNY plunged from 0.0072 back to 0.0058 in two days. The day I bought, the Fear & Greed Index was only 31, the funding rate was negative, and nobody in the group chat said a word—that’s my comfort zone. I don’t regret selling too early; I made 16 points. The lesson: when the funding rate t
XNY+12.98%
Don't lose heart, just return the favor as I did
post-image
Crypto
Will El Salvador hold $1b+ of BTC by...?
December 31, 2026
73%1.37x
September 30
No
$3.63 24H+1 more
Trenches
BTC
B
bade
b
BTC
C5xp...pump
Market Cap
$.
Change
.
24h Vol
$.
Holders
.
STONK
S
bade
b
STONK
6GmA...UNgx
Market Cap
$.
Change
.
24h Vol
$.
Holders
.
CNPY
C
bade
b
CNPY
0xc6...ddd2
Market Cap
$.
Change
.
24h Vol
$.
Holders
.
ZIG
Z
bade
b
ZIG
0x8c...1145
Market Cap
$.
Change
.
24h Vol
$.
Holders
.
LIGHT
L
bade
b
LIGHT
0x47...3c0e
Market Cap
$.
Change
.
24h Vol
$.
Holders
.
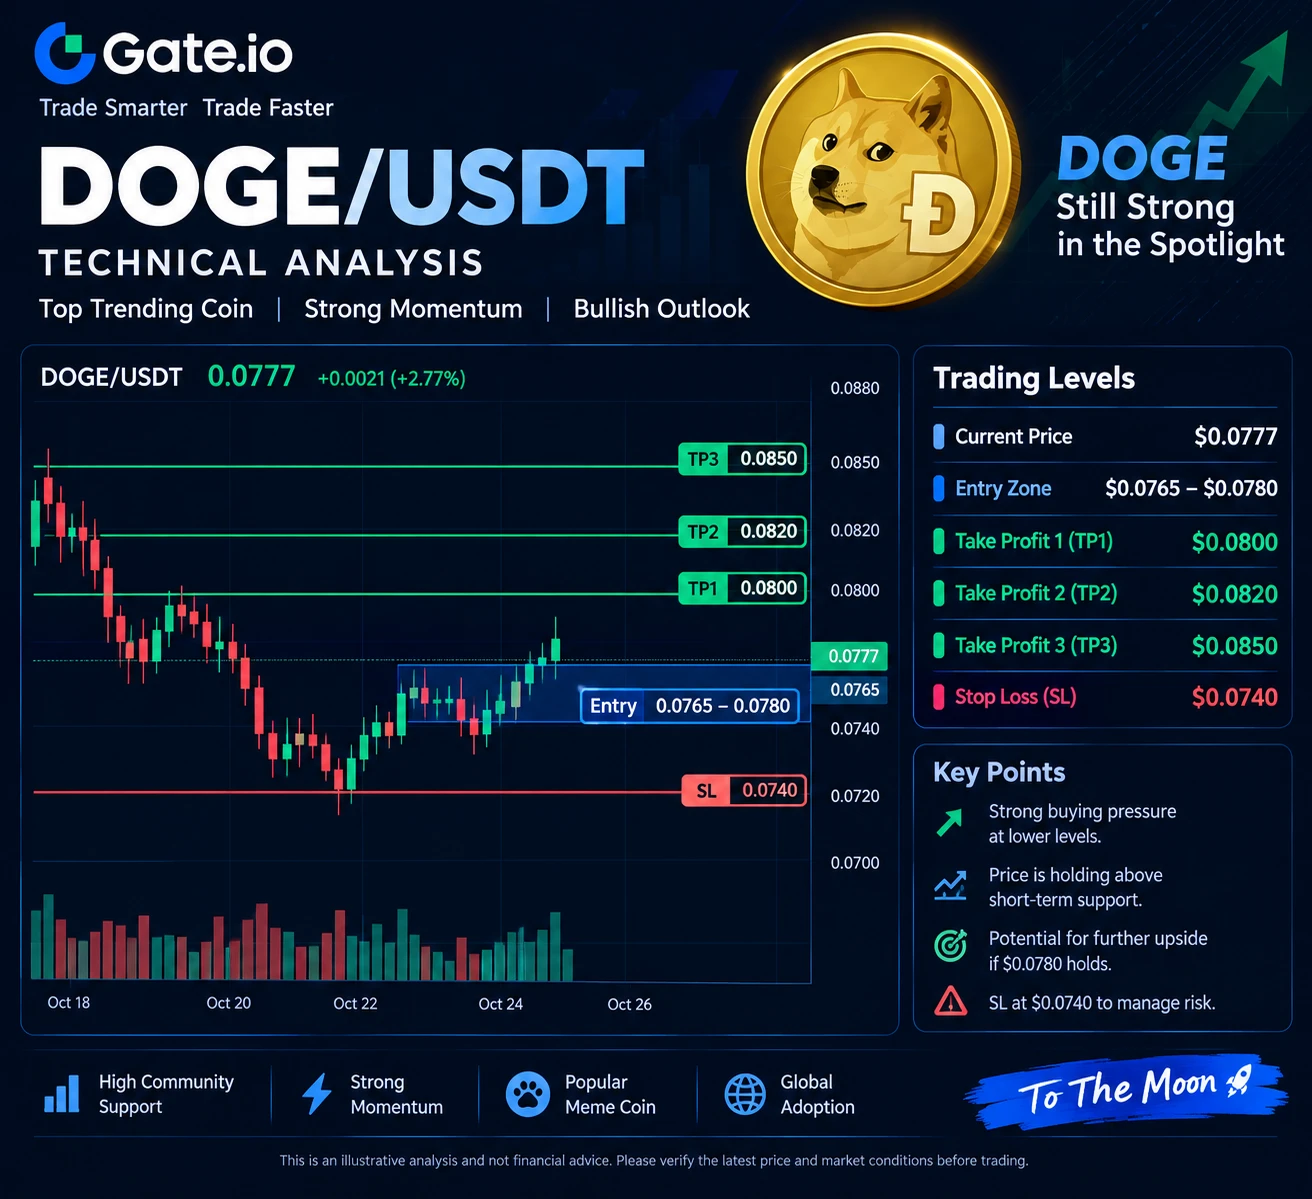
DOGE/USDT Technical Analysis — Watching the Next Move
Dogecoin remains a popular market to watch because of its volatility and strong community interest. Around $0.077, traders can monitor whether DOGE holds the $0.0765–$0.0780 area and attempts a recovery toward $0.0800. Since meme coins can move sharply in either direction, risk management is particularly important.
Trade Setup (Illustrative)
- Entry Zone: $0.0765–$0.0780
- TP1: $0.0800
- TP2: $0.0820
- TP3: $0.0850
- Stop Loss: $0.0740
- Support: $0.0765 / $0.0740
- Resistance: $0.0800 / $0.0850
A sustained move above $0.0800 could support
post-image
DOGE+2.46%
  • 1
$ETH Where would be a suitable level to buy back spot Ethereum?❓
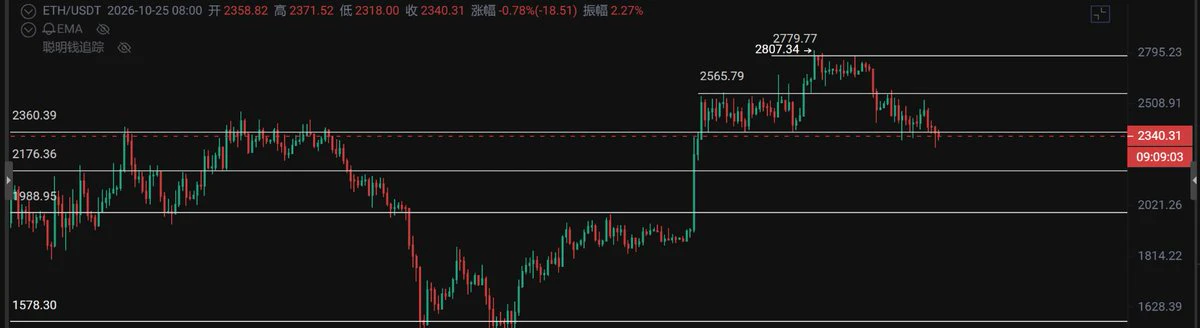
On Sep 25, Ethereum rebounded to 2770, giving everyone a chance to reduce their positions. Since then, it has corrected by 17%, while Bitcoin has corrected by 9%. ETH has basically corrected by roughly twice as much as Bitcoin, indicating that ETH’s price action is relatively weak.
Our previous expectation was to buy back at the weekly EMA30. However, BTC has only reached around 79K so far, still 5% above the EMA30 at 76600. By contrast, ETH has already pulled back to the EMA30. So we can conclude that if Bitcoin pulls back to th
post-image
ETH+2.21%
BTC+1.46%
Review of Yesterday’s Trading Plan (October 24)
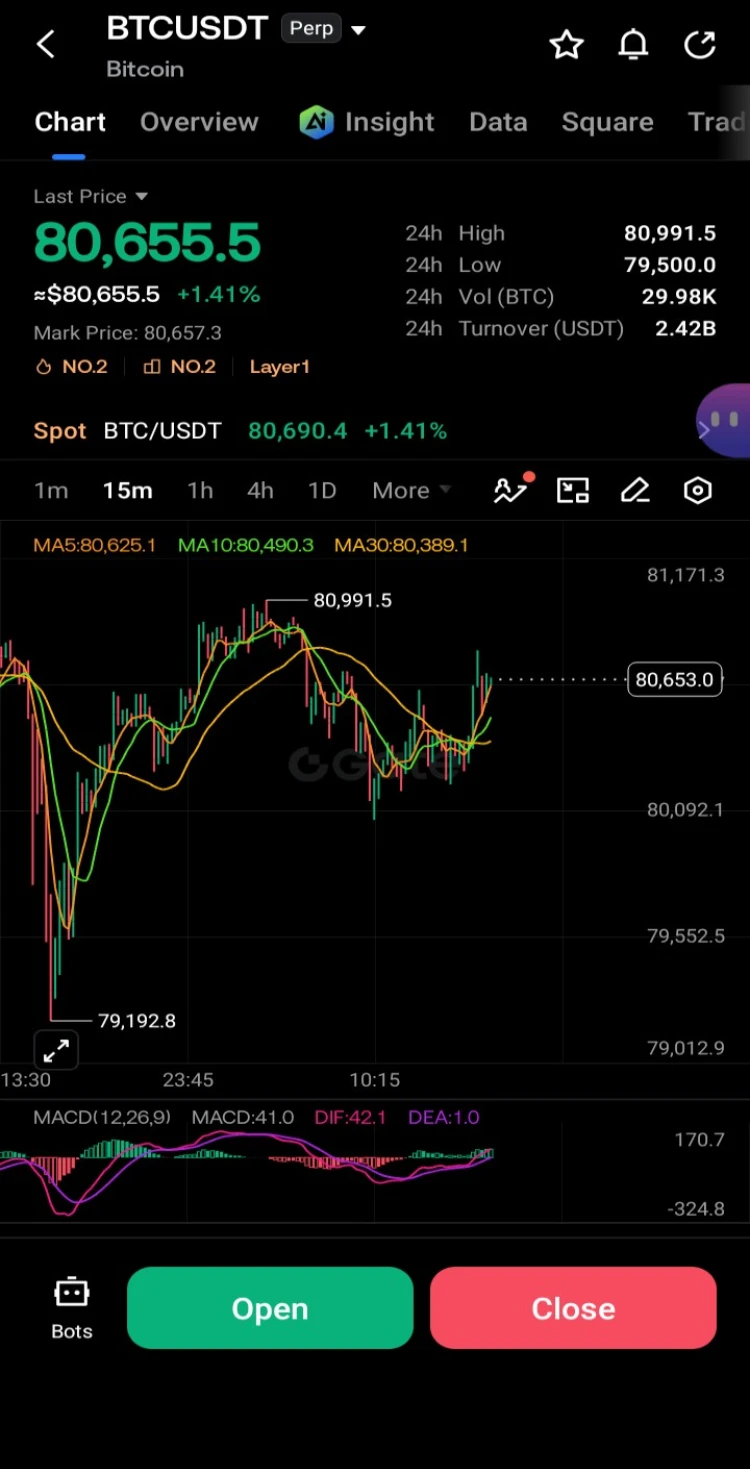
Short setup: The direction and levels were exactly right. Yesterday’s plan was to short after a rebound was rejected in the 81,000–81,200 area, with a stop-loss at 81,500 and targets at 80,000/79,500. In the actual price action, BTC reached a high near 81,846 and then turned lower, subsequently breaking below the 80,000 level and reaching a low of $79,277. The bearish direction played out exactly.
Long setup: Not triggered. The condition for going long after support held in the 80,000–80,200 area was not met, as no valid bottoming candle formed w
post-image
BTC+1.46%
BLK-1.75%
This woman makes a lot of sense.
In short, don’t let inner turmoil drain you.
Be strong on the inside.
🔹 An address has closed its SOL long positions and opened short positions valued at $10 million.
live-cover
LIVE1,668
LONG BTC
Limit Order
•ENTRY 76240
•SL 74120
•TP 87261
Apply risk management
$BTC ‌
post-image
BTC+1.40%
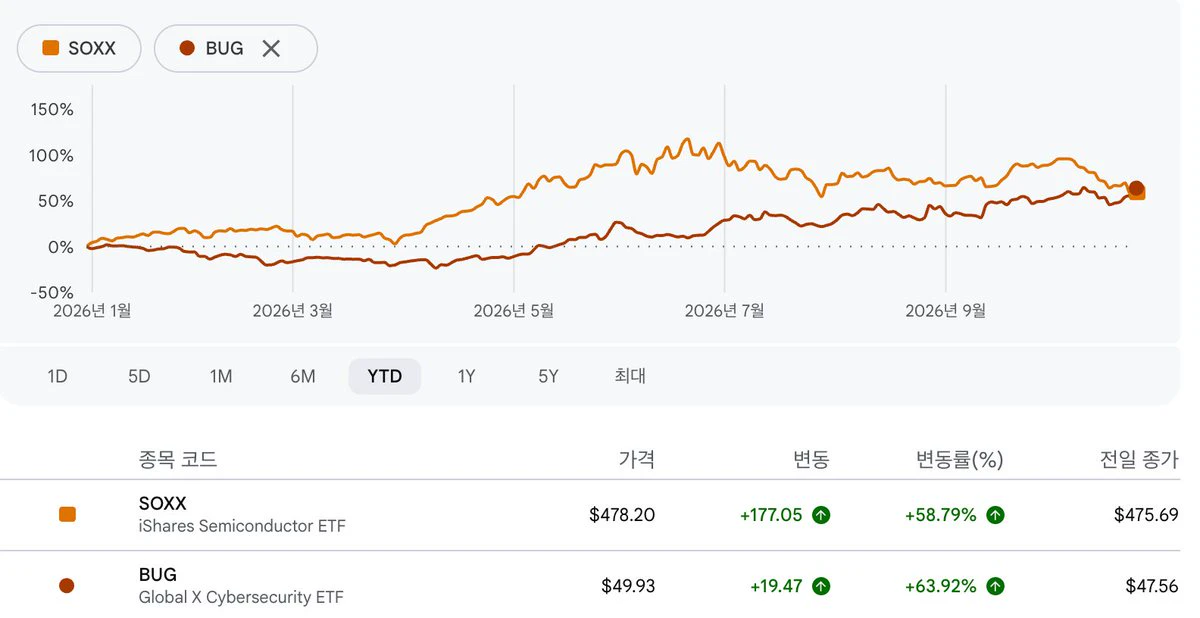
An interesting development: cybersecurity stocks have caught up with semiconductor stocks in terms of YTD performance.
post-image
Should AI log into your accounts for you—and should you give it your password?
1Password’s answer: don’t give it to anyone.
On October 22, 1Password launched 1Password for Agents, allowing personal AI agents to log in and complete tasks after your approval, while ensuring the agents never see or store any passwords, secrets, or credentials.
The cleverest part of this design is how it divides responsibilities: AI only gets as far as the login form, using a unique digital key to prove, “I’m the agent you authorized.”
Then it’s your turn—you’ll see on your own device which credential it wants to
post-image
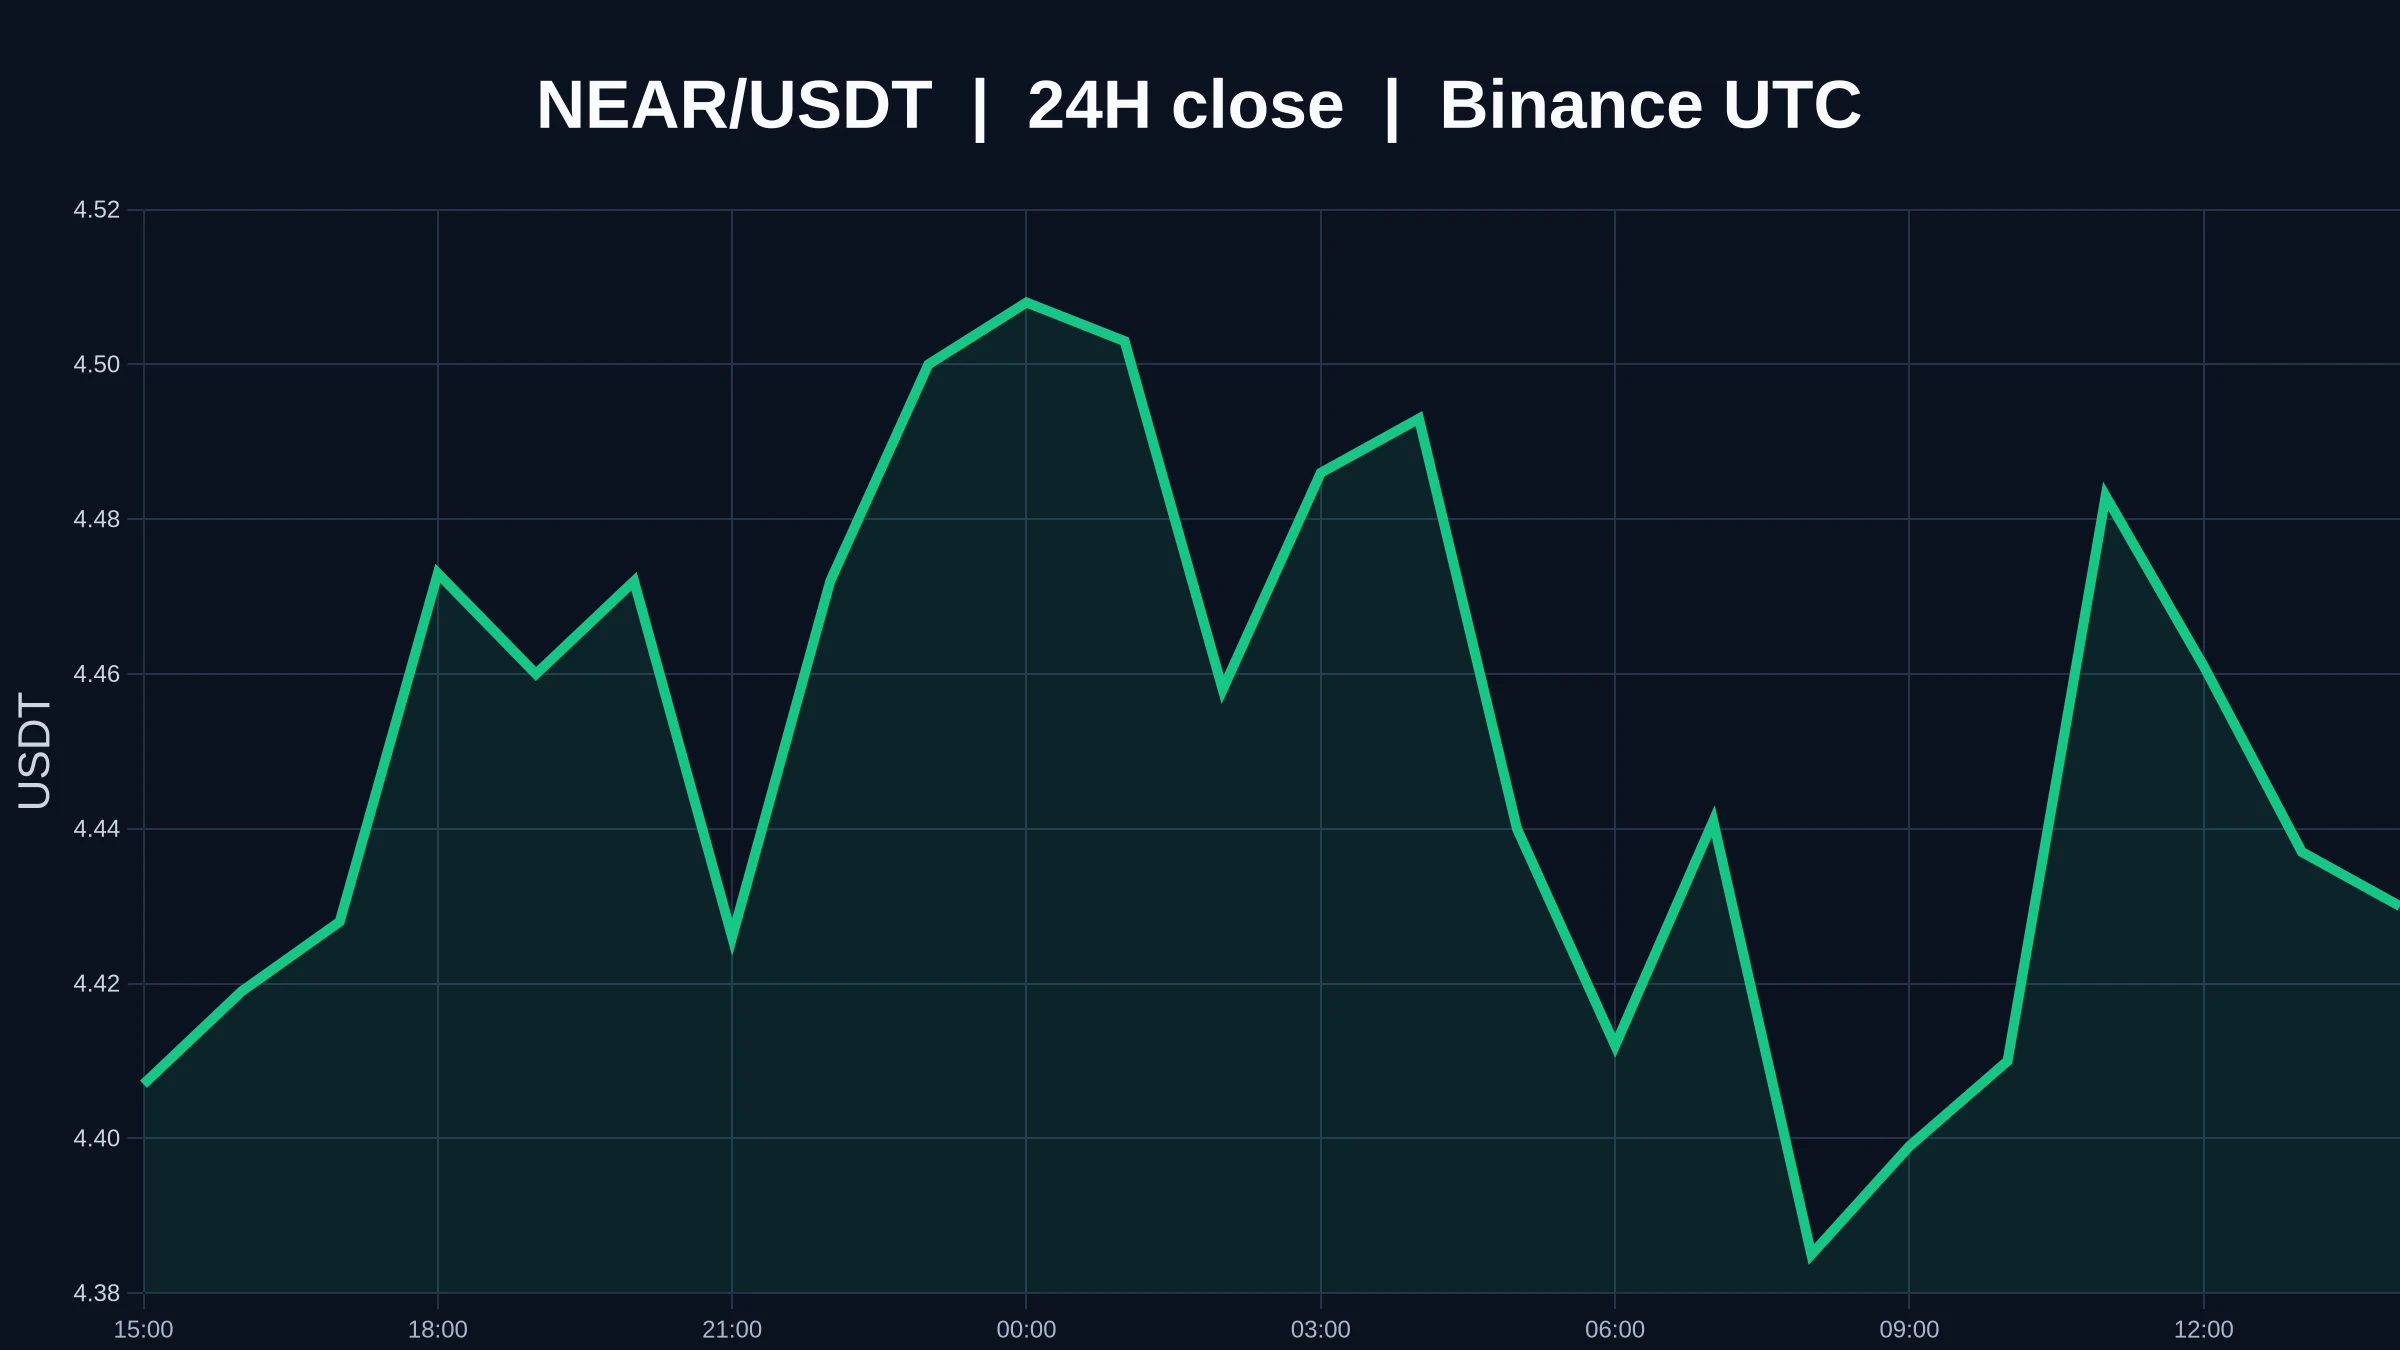
Treat $NEAR as a thesis to be tested: current price 4.454, up 1.25% in 24 hours, with participation at 0.15x. What we know is clear; the key unknown is whether real buying will appear once key levels are reached. One simple rule of thumb: RSI entering oversold territory only means selling pressure has been released in a concentrated burst, and the price may rebound; only a failure to make new lows and a recovery above key levels add evidence that the decline has stopped. A sharp-looking drop can make a price seem cheap, but cheapness is a feeling; a confirmed bottom is evidence on the chart.
post-image
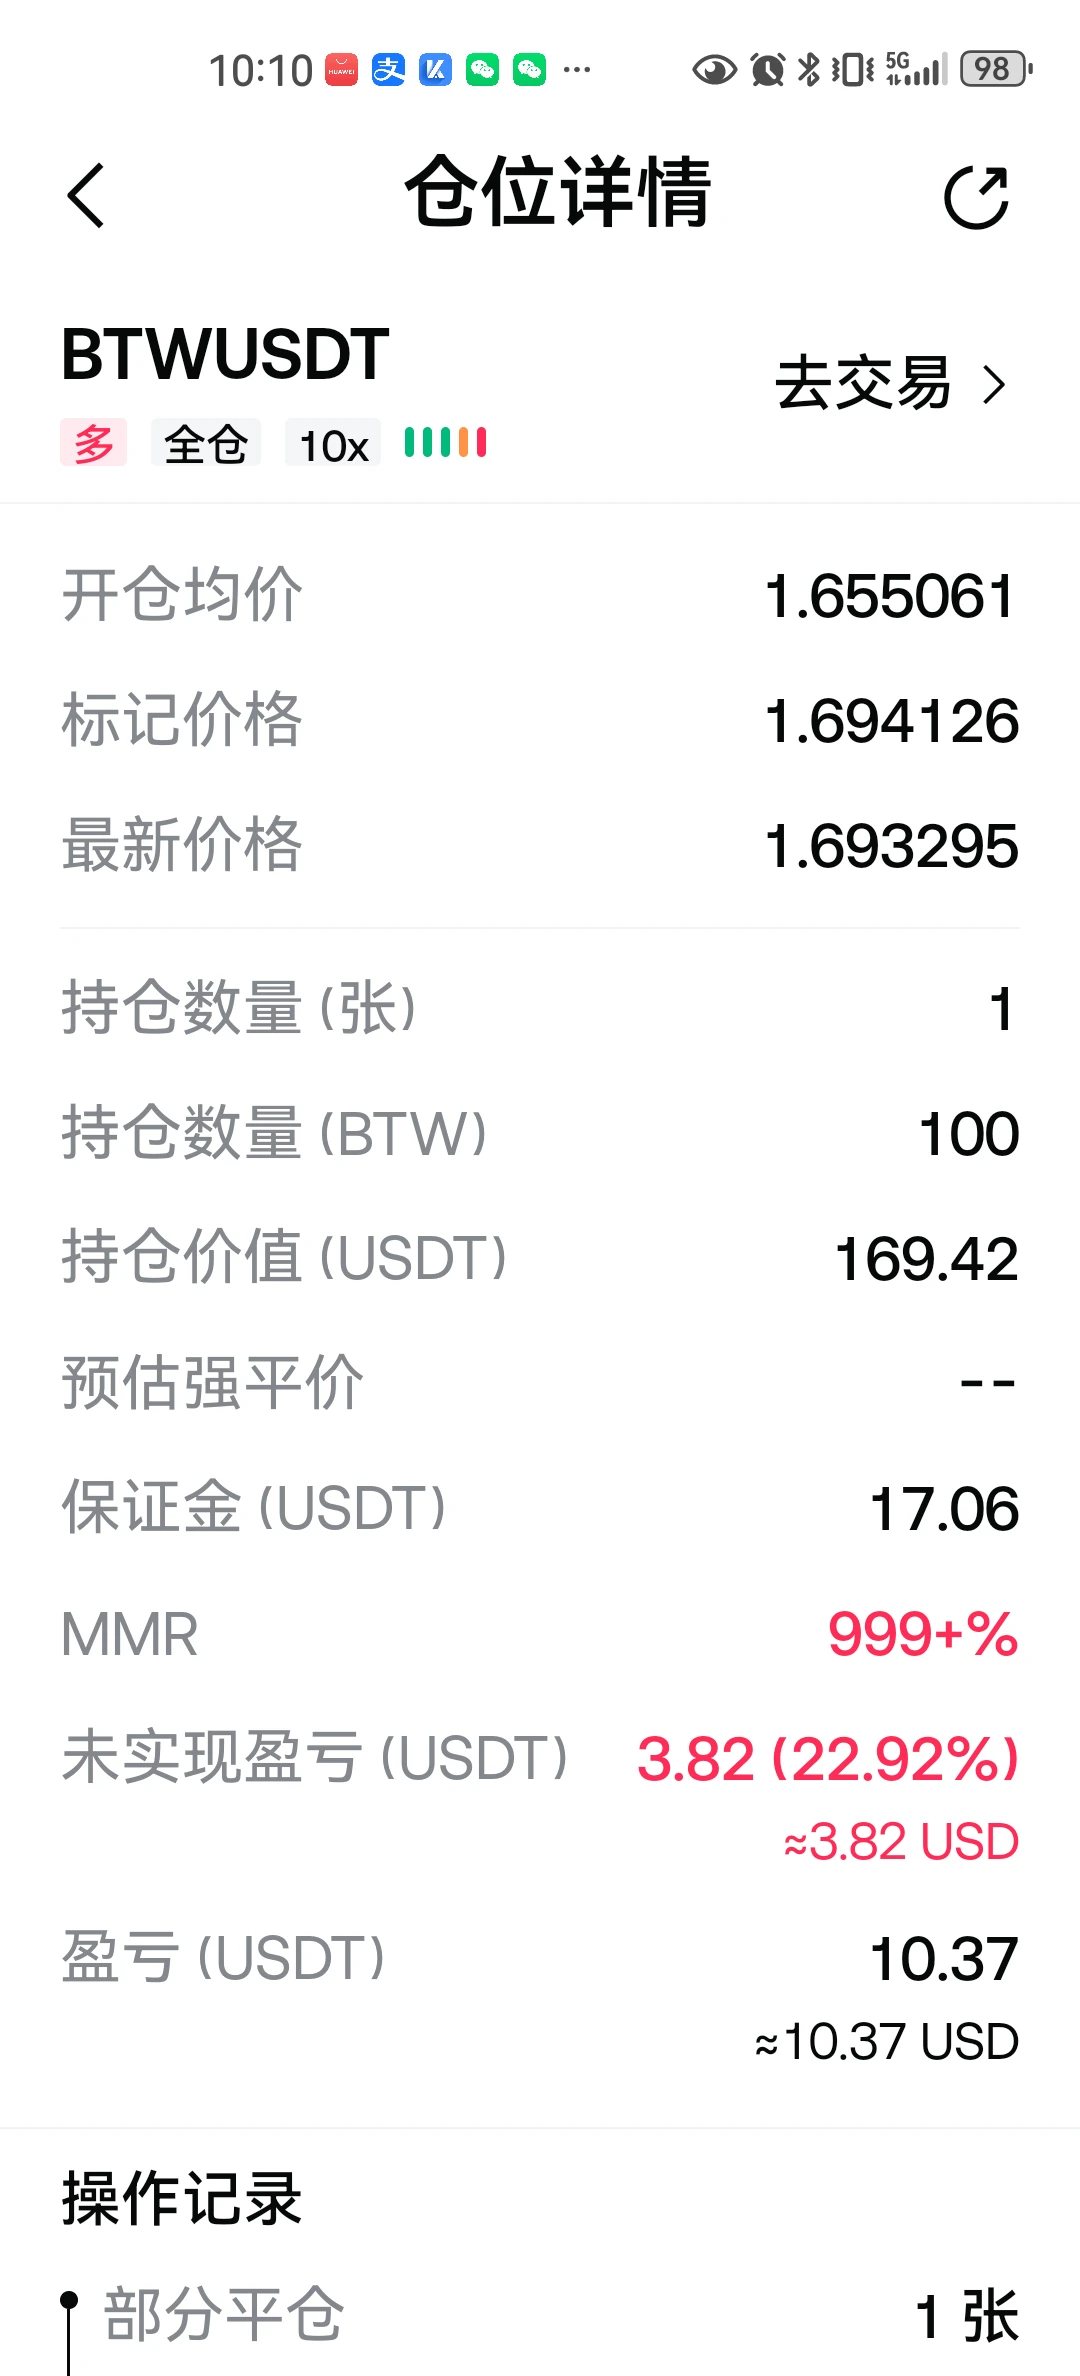
$BTW Warriors, do you still dare to short
post-image
BTW-5.59%
$APR I just capitulated and sold at a 30,000 U loss last week, and seeing this candle today nearly made me throw my phone. It went from 0.0251 to 0.0549 in 24h, and has now pulled back to 0.0433. That 63.99% gain was backed by a whopping 398.2M in trading volume. A guy in the group says open interest in futures doubled 1.8x in half an hour—clearly, funds are repeatedly shaking out traders around 0.04. I pulled the data again: 0.042 is today’s bull-bear dividing line, with overhead selling pressure from the previous high at 0.048. Trading plan: try a small long at the current price of 0.0433,
APR+60.37%
RWA has been booming this year, but among several altcoins built around the RWA narrative, only one actually shares interest with holders:
$ONDO is currently the leading project by business scale, but its token captures no value. Its own dollar-yield product has surpassed BlackRock’s and grown to over $2 billion, but ONDO is just a governance token, and not a cent of protocol fees flows to the token.
ONDO’s MA7 (0.430)/MA20 (0.455)/MA30 (0.473) are all overhead, RSI at 32 is nearing oversold, its 30-day range position of 1.3% is close to the monthly low, and it’s down 26.3% for the month. It’
post-image
ONDO+1.90%
PENDLE+2.11%
CFG+0.42%
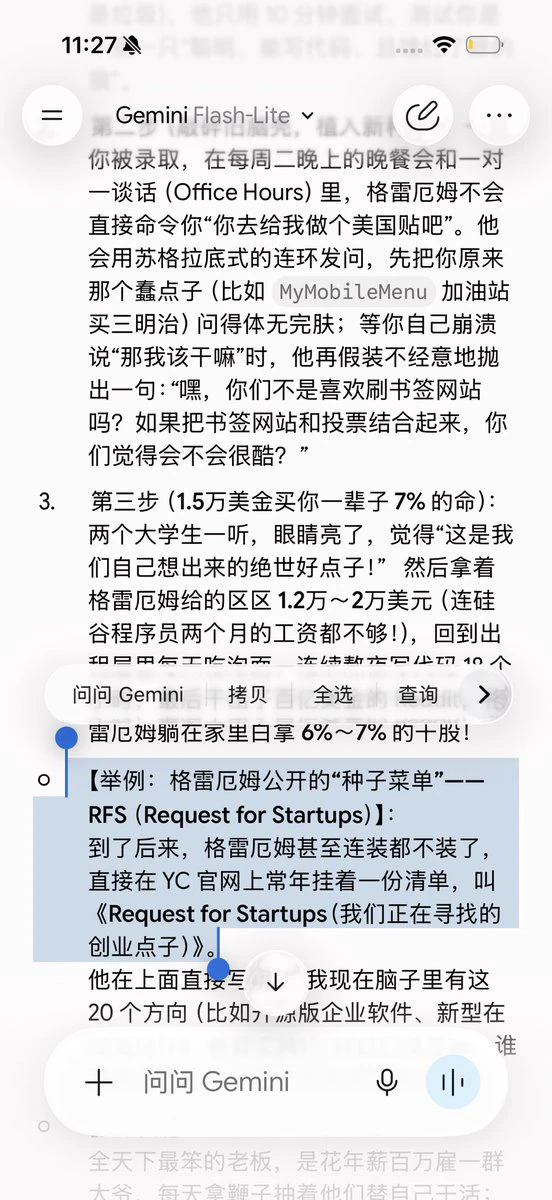
When reading a book, asking a general question versus following up on the details can yield completely different answers and useful information.
The former might ask his girlfriend: “What did you do today?”
She says: “I was busy working today.” (A very standard, predictable answer)
The latter asks in detail: “You left at 9 a.m. today wearing your new shoes, and when you came back at 10 p.m., I could still smell the fresh scent of hair gel on you. What were you doing?”
She says: “Baby, I was actually cheating on you.”
post-image
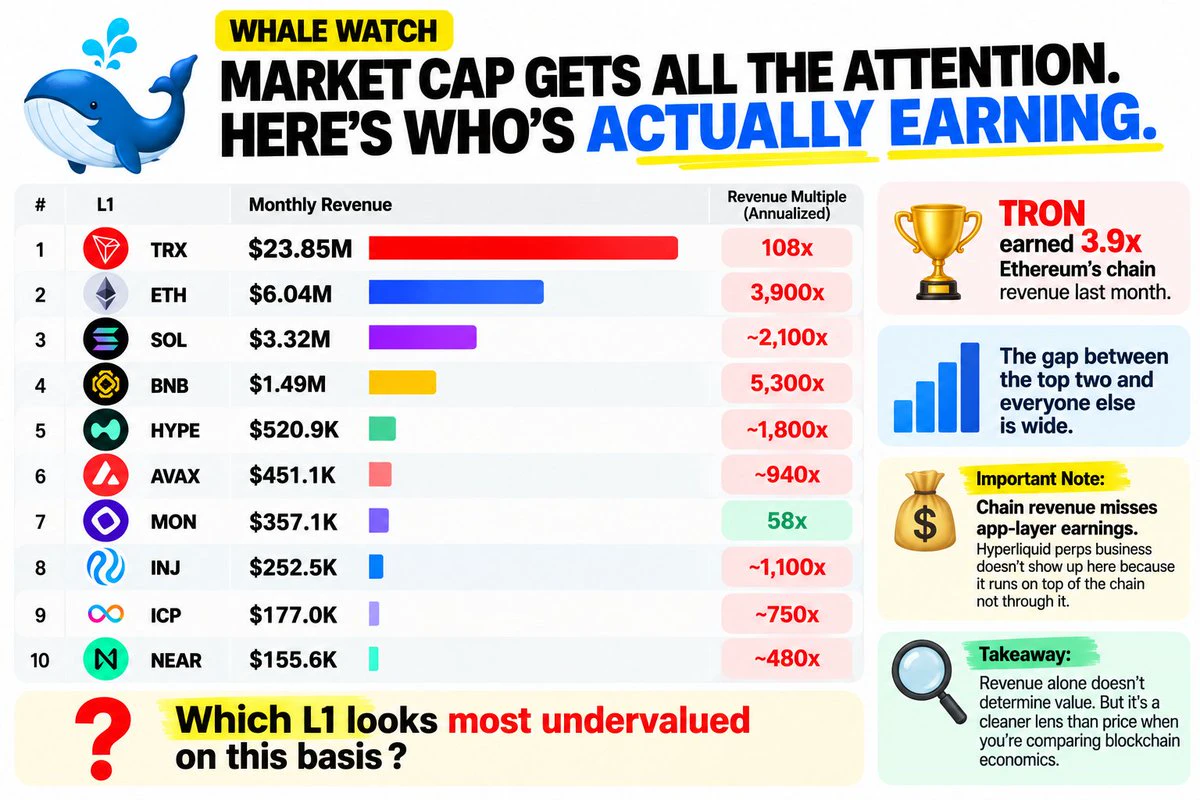
🐋 WHALE WATCH : Market cap gets all the attention. Heres whos actually earning.
Monthly L1 revenue:
$TRX => $23.85M
$ETH => $6.04M
$SOL => $3.32M
$BNB => $1.49M
$HYPE => $520.9K
$AVAX => $451.1K
$MON => $357.1K
$INJ => $252.5K
$ICP => $177.0K
$NEAR => $155.6K
TRON earned 3.9x Ethereums chain revenue last month. The gap between the top two and everyone else is wide.
Now look at the multiples. TRX trades at 108x annualized revenue. MON at 58x. ETH sits near 3900x. BNB over 5300x.
One caveat: chain revenue misses app-layer earnings. Hyperliquid perps business doesnt show up here because it runs
post-image
TRX+0.12%
ETH+2.21%
SOL+2.42%
BNB+3.15%
HYPE+3.47%
Bitcoin and Ethereum Face Renewed Selling Pressure as Large Traders Reduce Market Exposure
live-cover
LIVE1,441
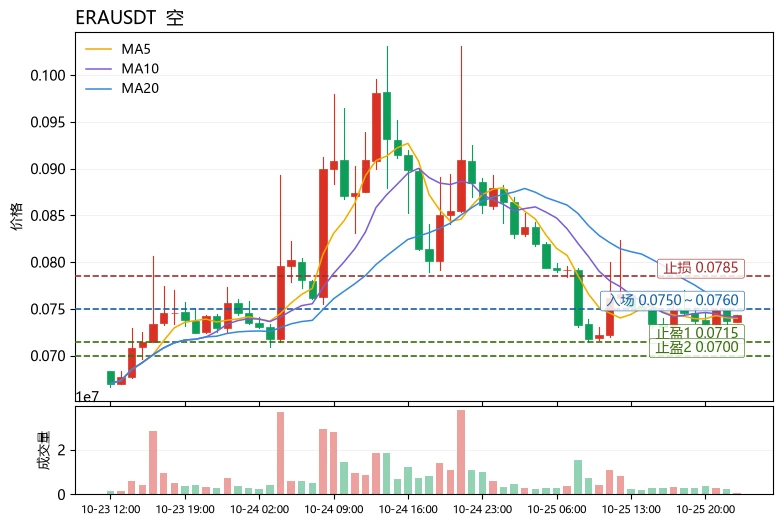
$ERA The current price is 0.0743. The first resistance above is the Bollinger upper band at 0.0805, while the first support below is the Bollinger lower band at 0.0700. The MA20 level of 0.0753 is the short-term dividing line between bulls and bears. These three levels are highlighted first because the current price is caught between the lower and middle bands, with no clear direction yet, while the 24h decline of 13.61% has amplified volatility to an extreme level, with the 30-candle range at approximately 42.66%.
Structurally, MA5=0.07398 remains below MA20=0.075295, with the moving averages
post-image
DASH+7.31%
#Gate广场万圣节 #BTC
Bitcoin Market Analysis — October 25, 2026
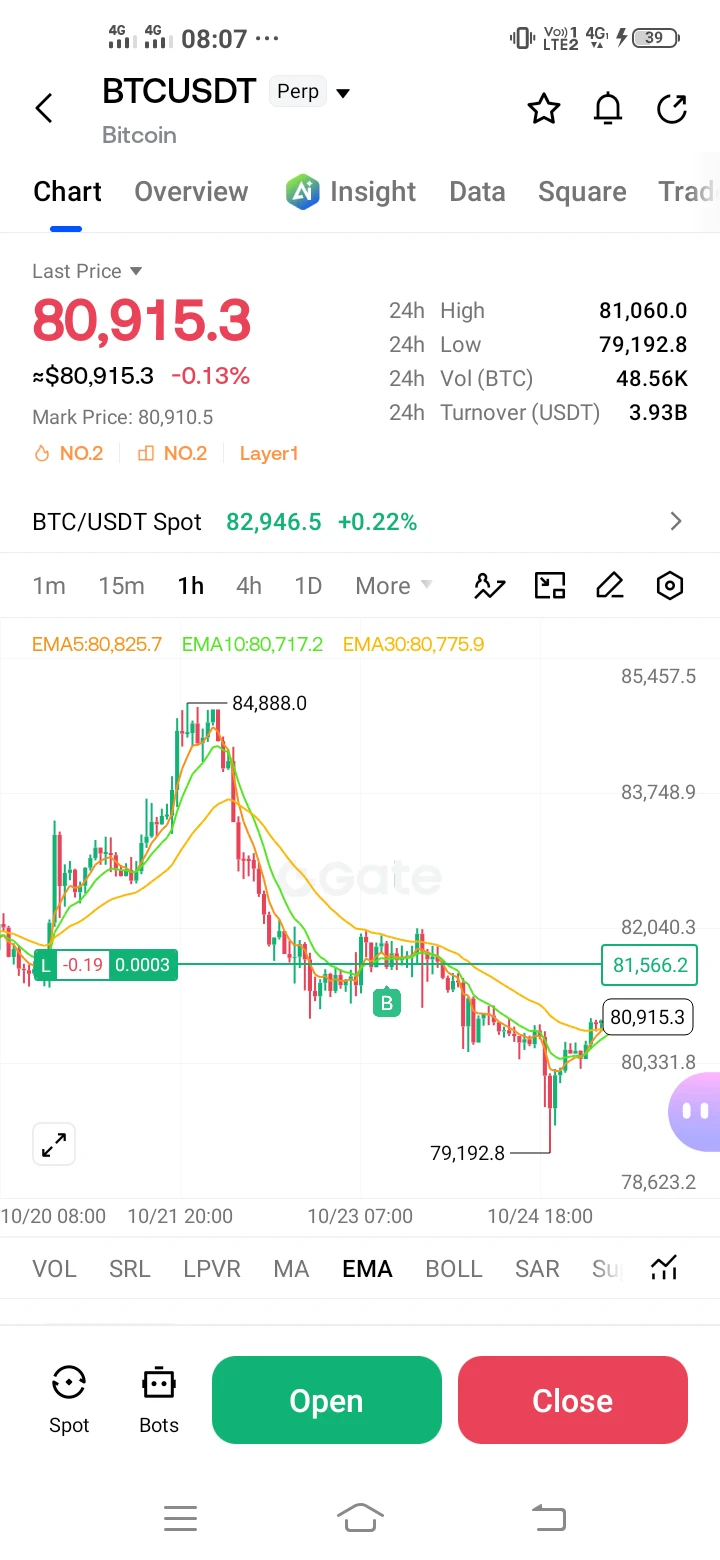
Bitcoin is trading near $80,900–$81,000 right now, sitting in the lower-middle of a week-long trading range. Over the past week price pushed to roughly $84,800 on October 21, got sold sharply to about $80,800 on October 22 during the tech-stock slide, and has since been chopping between roughly $79,200 and $81,100. Over the last 24 hours BTC is essentially flat (about −0.03%), and over the last seven days it is down about 0.9%. This is not a fresh high and not a confirmed breakdown, it is a congested, indecisive market waiting on the
post-image
BTC+1.46%
IBIT-0.23%
Load More

Join 40 M users in our growing community

⚡️ Join 40 M users in the crypto craze discussion

💬 Engage with your favorite top creators

👍 See what interests you

Trending Topics

USEarningsSeason

96.67k Views3.5k Discussing

The U.S. Q3 earnings season is in full swing, with major tech companies including Tesla and Meta reporting results. Market focus is shifting beyond revenue and profit toward AI spending, capital expenditure, margins and forward guidance. Which company’s earnings are you watching most closely?

GateWCTCS9GlobalTradingCompetition

711.68k Views8.07k Discussing

USConsumerSentimentNearRecordLow

11.29k Views296 Discussing

View More