Square
Following
Hot
News
Profile
Share your thoughts
placeholder
Article
I can't be the only one 😭
post-image
$CRCL Short Fades a Fresh Bullish MACD Cross Momentum Conflict
Pair: $CRCL /USDT
Direction: SHORT
Entry Zone: 77.89
Take Profit:
- TP1: 76.12 +2.3%
- TP2: 74.94 +3.8%
- TP3: 73.18 +6.0%
Stop Loss: 80.25
Chart Structure:
- CRCL declined steadily from ~86 through MA7, MA25, and MA99 to a low near 74.5, then recovered to current price, now consolidating just below the broken MA7/MA25 cluster
- MA99 (purple) remains above as declining resistance, not yet tested on this bounce
- RSI(14) recovered from the low-20s to the high-40s a decent, sustained recovery, not just a tick
- ⚠️ MACD has been d
CRCL+8.85%
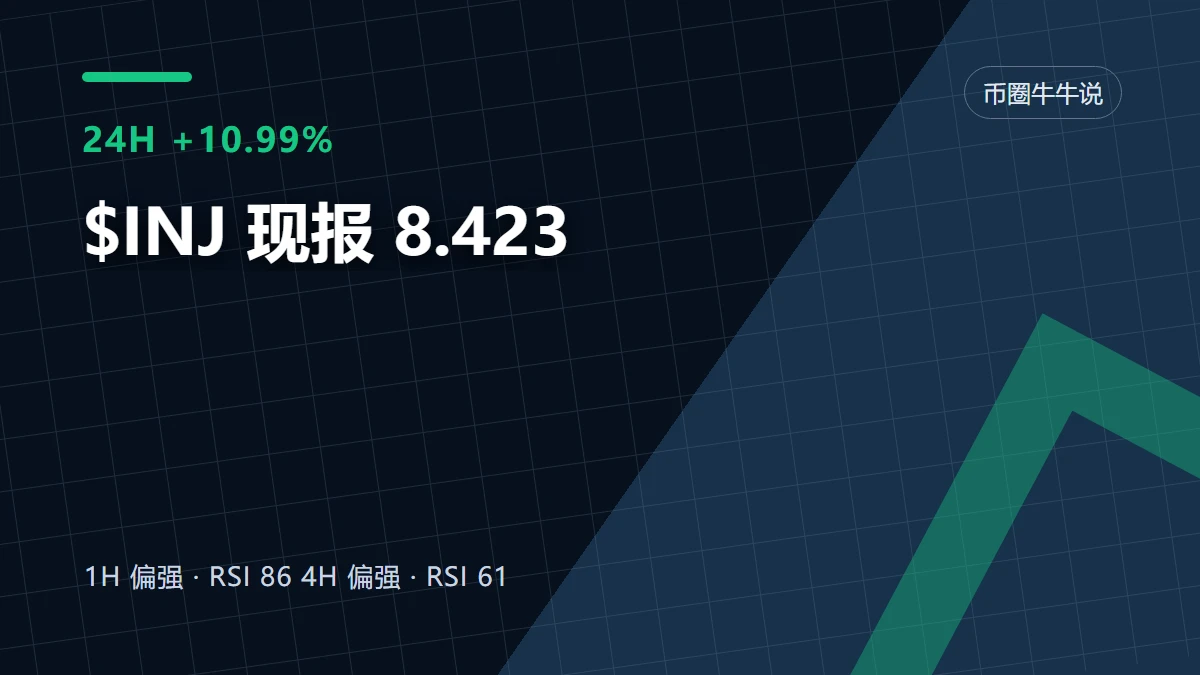
An unpopular take: $INJ ’s current +10.99% gain is not as conclusive as it looks.
$INJ is currently at 8.423, up +10.99% over 24 hours. The 1-hour support is 7.061, resistance is 8.562, and current volume is 0.77 times the average volume of the past 20 periods. What is truly useful in these numbers is where 7.061 and 8.562 are containing the range.
This is where I currently stand: I acknowledge that the trend is strong, but what matters next is not how much higher it can surge, but whether buyers step in during the first pullback. The 1-hour trend is strong, with an RSI of 86; the 4-hour trend
post-image
INJ+10.92%
$OP
This move is pushing from 0.1397 toward 0.1418, up more than 13% over the past 7 days, while open interest is piling up as longs keep adding and driving it higher🚀 The wildest part is that shorts are effectively paying to stay in, having to hold on while funding remains negative. The pressure isn’t a bad thing—it’s an early-entry position. Break through 0.1418 and jump aboard.
post-image
OP+0.76%
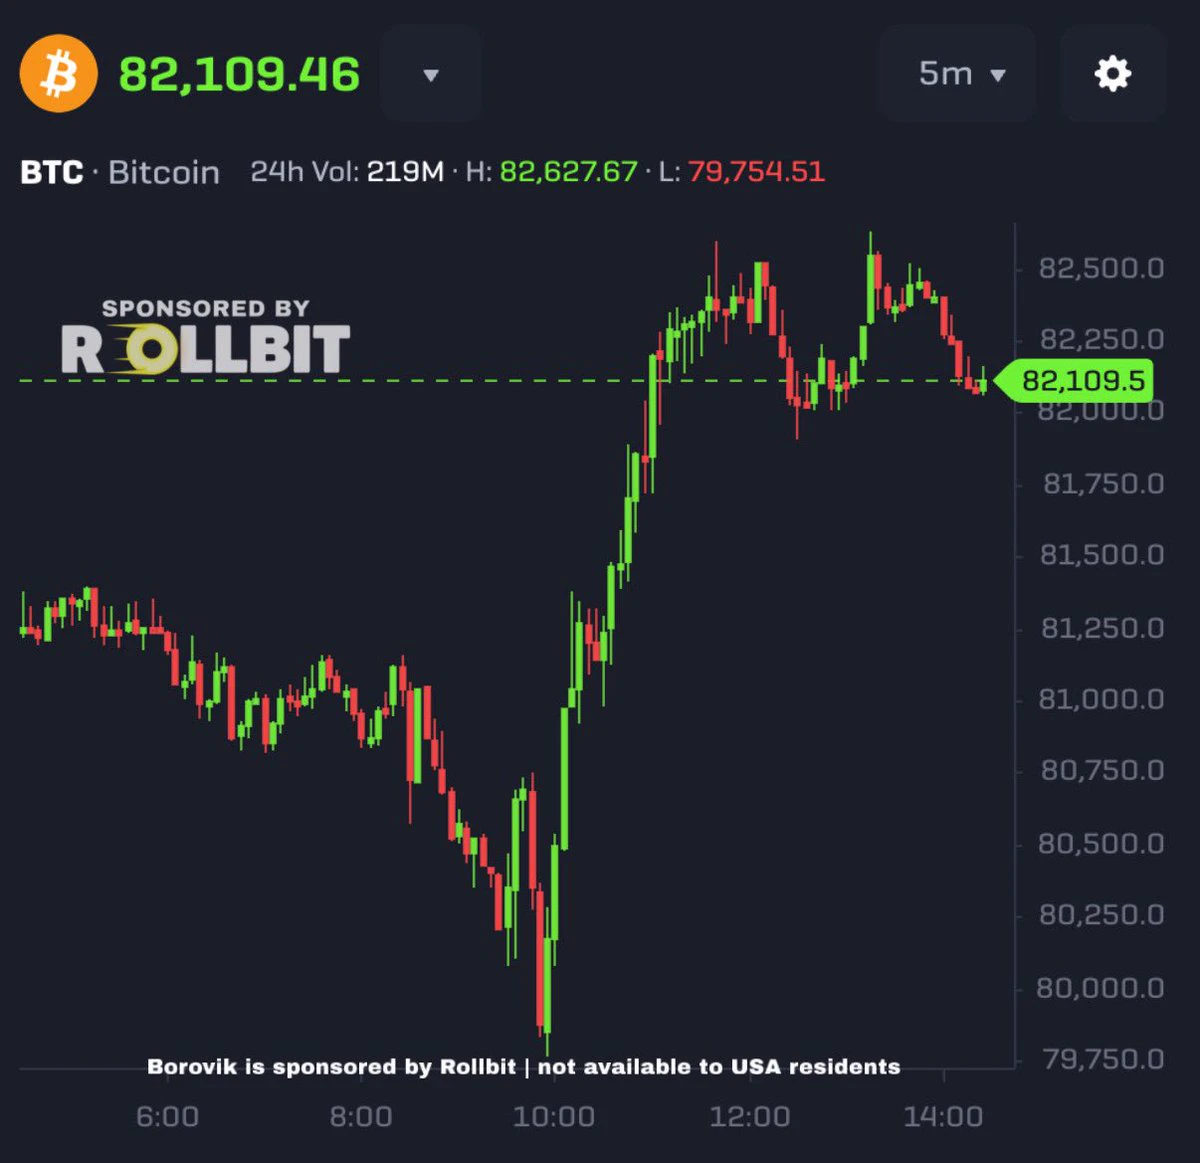
Bitcoin is BACK over $82,000!!
We are so back!!
post-image
BTC+0.48%
$FET took me through a trade like this: the hardest part is knowing when to exit.
This feels like a good spot. Close the position right here. Watching these two today: $SO and $BAT .
post-image
FET+5.05%
BAT+28.31%
$RENDER took decisive action, so the account performed better. This is a good reason to exit. Profits have been locked in. My daily watchlist: $BAT and $ETH .
post-image
RENDER+3.20%
BAT+28.31%
ETH+1.41%
SANDISK $SNDK REJECTING MOVING AVERAGE RESISTANCE ARE BEARS TARGETING $1,272.23 NEXT?
Trade Parameters

Pair: $SNDK /USDT
Direction: SHORT
Entry Price: 1,347.86
Target Levels (Take Profit)
🎯 TP 1: 1,302.48 3.37%
🎯 TP 2: 1,272.23 5.61%
Stop Loss
SL: 1,408.36
Technical Breakdown
SNDK ($1,348.19) faced strong rejection following an aggressive upward push, printing a topping wick that stalled out right at structural resistance. This price action confirms persistent seller defense and sets up a clean continuation toward lower targets.
Price action tested areas above short-term moving ave
SNDK-0.15%
In this $ZRO move, which step is easiest to be fooled by?
When I looked at $ZRO again, I first covered up the 24-hour +9.37%. It’s not that this number is unimportant, but it is too good at grabbing attention. What really needs explaining right now is that after $ZRO’s sharp 24-hour rise, momentum and continuation are not the same thing. I won’t extrapolate the large move that has already happened into the next leg; I’ll first see whether the price can hold in the new range.
The most convenient—and easiest to get wrong—reading is that the gainers and losers list records the past, while the mo
post-image
ZRO+9.59%
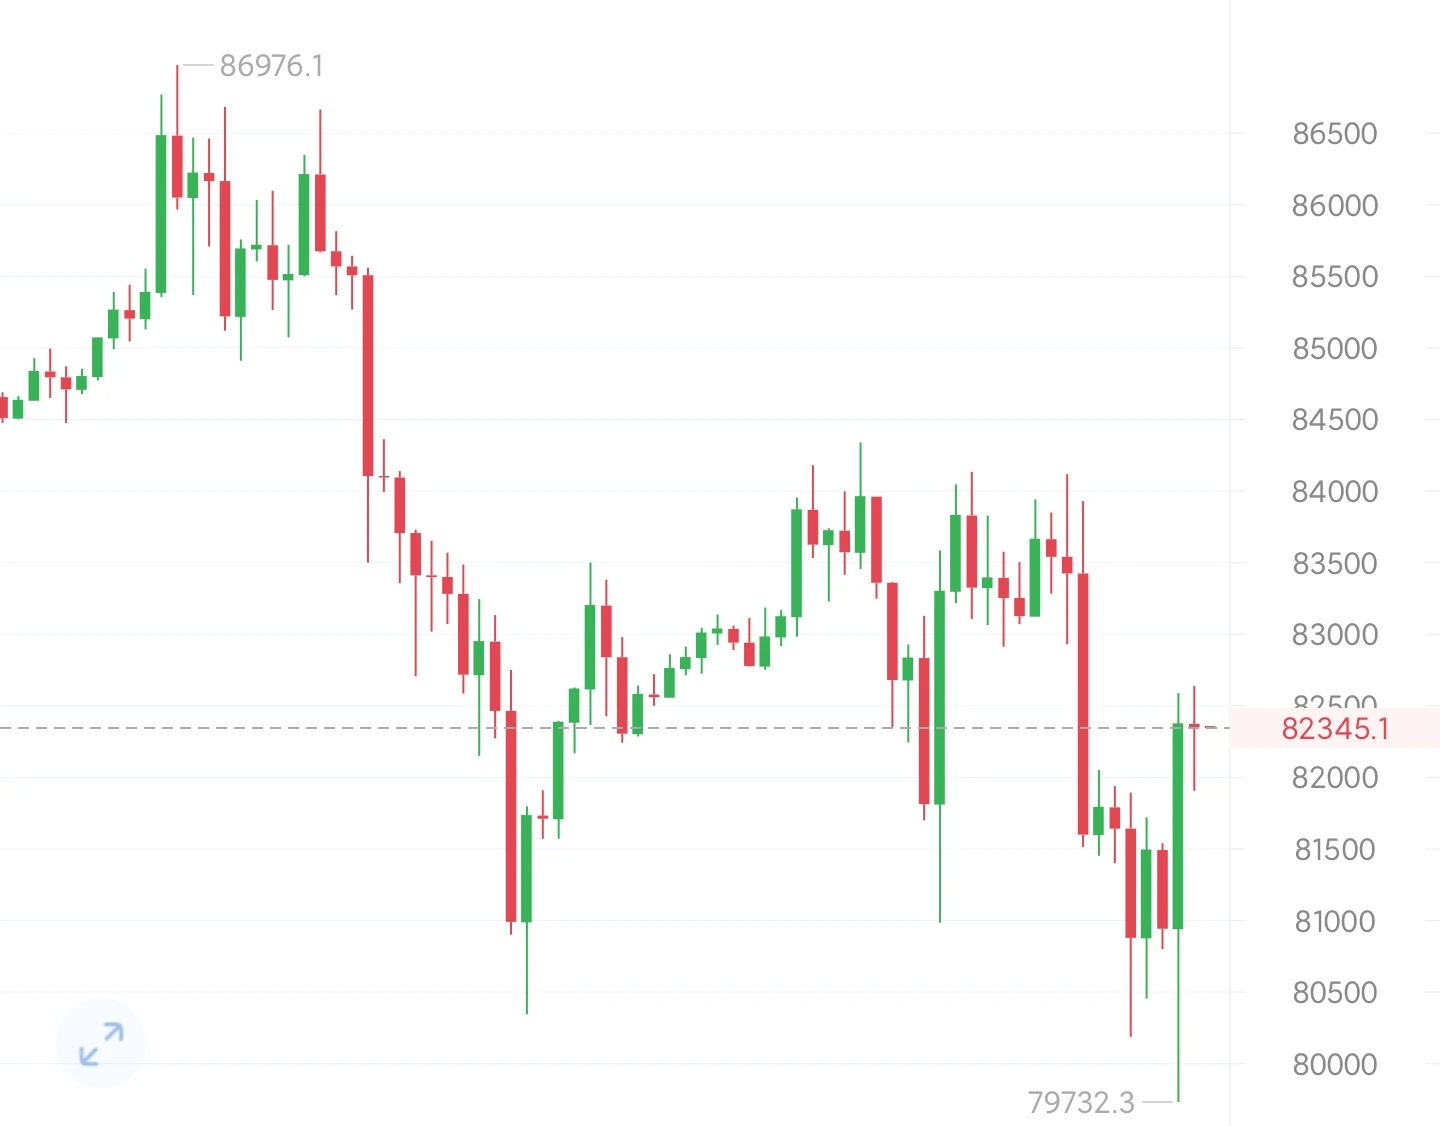
BTC is currently around 82400; after the previous pullback, it has staged a short-term corrective rebound, but the upside follow-through is weak. This is a technical recovery after the decline, with no trend reversal signal appearing for now. The broader structure remains range-bound with a bearish bias.

On the 4-hour chart, the price is below the moving averages, and rebound volume is insufficient, indicating a weak consolidative recovery. The overhead resistance zone is substantial. As long as the price fails to firmly hold above resistance, this rebound is more likely to be a continuation
post-image
BTC+0.49%
Trade is actually an old script. In the 1980s, Japan’s economy was at its peak, with GDP reaching nearly 70% of the United States’, while its semiconductor industry was putting immense pressure on the US. Japan also wanted to improve relations with China and bring China in to counterbalance the US. What happened? The US launched a combination of measures: the 1985 Plaza Accord forced the yen to appreciate; the 1986 US-Japan Semiconductor Agreement forced Japan to open its market and restricted its exports; and the constraints of the US-Japan security alliance kept Japan firmly in line. From th
post-image
AAPL-0.31%
Short-Selling Analysis of the Biggest Decliners: Real wealth is hidden in the red candlesEveryone is mesmerized by green candlesticks. Chasing pumps, chasing hot trends. But where is the real opportunity? It is right in front of you—in the red candles. Most people are too afraid to touch them. These four coins are weakening sharply. The market structure has already broken down. Sellers are fully in control. This is not a pullback, but a trend. Smart money positioned itself long ago. I have carefully examined every chart. No hype, just letting the charts speak. $TRUT
Risk level: HighEntry price
post-image
🔹Whale Dumps BTC and Loads Up on ETH! After selling 237.8 BTC and buying 7,929 ETH, is big money be
live-cover
LIVE23
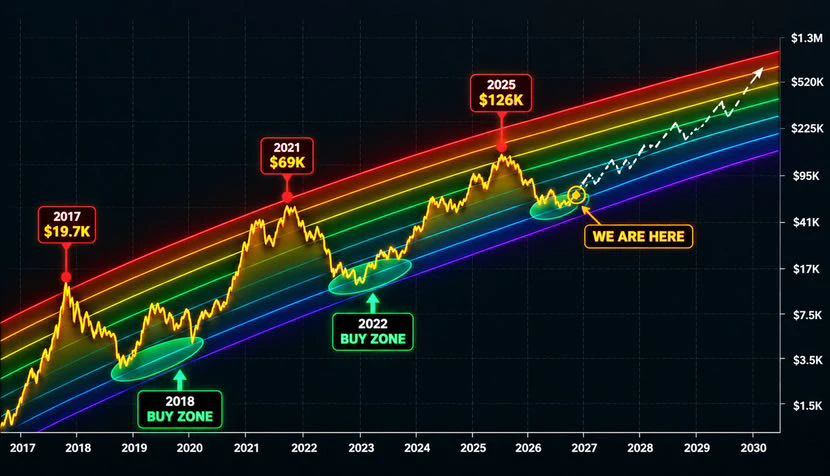
Bitcoin’s Long Term Cycle Chart Points to a Bigger Question: Are We in Another Accumulation Zone? 🙄
Bitcoin’s historical price cycles show a recurring pattern: major rallies, deep corrections, and long recovery periods.
The chart highlights previous peaks near $19,700 in 2017, $69,000 in 2021, and $126,000 in 2025, alongside earlier areas that some traders viewed as accumulation zones.
Now, the key question is whether the current price structure represents another opportunity to accumulate or whether the cycle is changing.
I think that the Historical patterns can offer useful context, but the
post-image
BTC+0.48%
Robinhood's stock tokens have generated $15B in cumulative trading volume as Robinhood Chain, built on Arbitrum, passes 100 days live. About 200,000 people hold the tokens, which track 190+ US stocks and funds.
@arbitrum
post-image
ARB+7.51%

SOL oscillated downward from the earlier high of 124.99, with the intraday low dipping to 100.51 before a slight rebound, reaching a high of 106.49. This rebound is merely a minor corrective bounce during the decline; the overall broader downtrend channel remains intact, and a rebound to resistance presents an opportunity to enter short.

From the chart, the daily highs have been gradually moving lower, and the bearish trend structure remains intact. This rebound is only a brief pause amid the decline. MACD remains weak and trending downward, while heavy pressure from previously trapped posit
post-image
SOL+1.22%
Bitcoin Support and Resistance Levels
live-cover
LIVE103
Everyone watching SYMBOL long is about to get blindsided by a sharp drop.

$MU /USDT - SHORT

Trade Plan:
Entry: 927.98 – 934.84
SL: 964.38
TP1: 906.68
TP2: 890.19
TP3: 865.47

Why this setup?


Debate:
Are we testing TP2 or is 994.50 about to flip this setup?

⚠️ Personal market analysis only. NFA — manage risk and DYOR.
Educational content, not investment advice or a recommendation to buy, sell, deposit, or withdraw any asset. No paid promotion or referral/affiliate links.
MU+2.08%
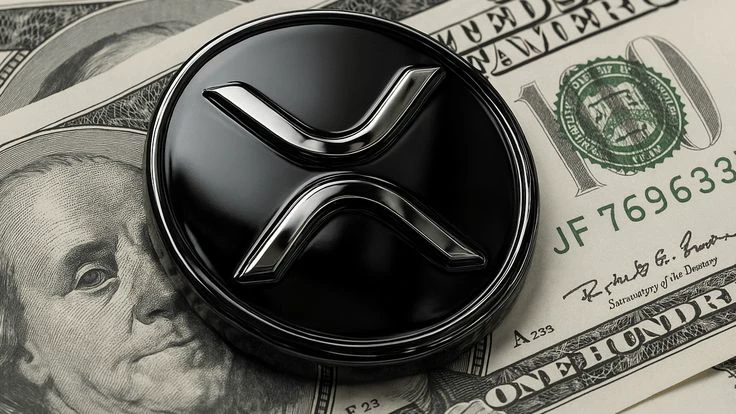
While XRP has seen significant developments on the institutional front, its price has followed a more cautious trend. Despite approximately $1.8 billion in net inflows into XRP exchange-traded products (ETPs) over the past 13 weeks, the token’s price currently sits at $1.39—a decline of over 8% in the last week alone. This divergence raises a fundamental question that is now at the forefront of investors' minds.
The developments on the institutional side are noteworthy. Evernode—a company holding 473 million XRP and $300 million in cash—has begun trading on the Nasdaq under the ticker symbol X
post-image
XRP+0.61%
  • 8
  • 1
Load More

Join 40 M users in our growing community

⚡️ Join 40 M users in the crypto craze discussion

💬 Engage with your favorite top creators

👍 See what interests you

Trending Topics

USSeptemberPPIBeatsExpectations

91.35k Views1.88k Discussing

US September PPI came in at 6.3% YoY, well above the 5.3% market expectation, pointing to renewed producer-side inflation pressure. Weekly jobless claims were 199K, broadly in line with forecasts. Could hotter inflation further reduce room for rate cuts, and what does it mean for $BTC, US stocks, and gold?

DrLinHanSpeaksAtOxfordUnion

135.63k Views1.86k Discussing

JapanAndKoreaStocksPlunge

47.27k Views1.76k Discussing

View More