Square
Following
Hot
News
Profile
Share your thoughts
placeholder
Article
Morning fam , my group is top 0.1% for the month
Pump challenge has been great so far with everyone printing
Market has been good to us so I’ve been making sure to give back
Who’s active ?
post-image
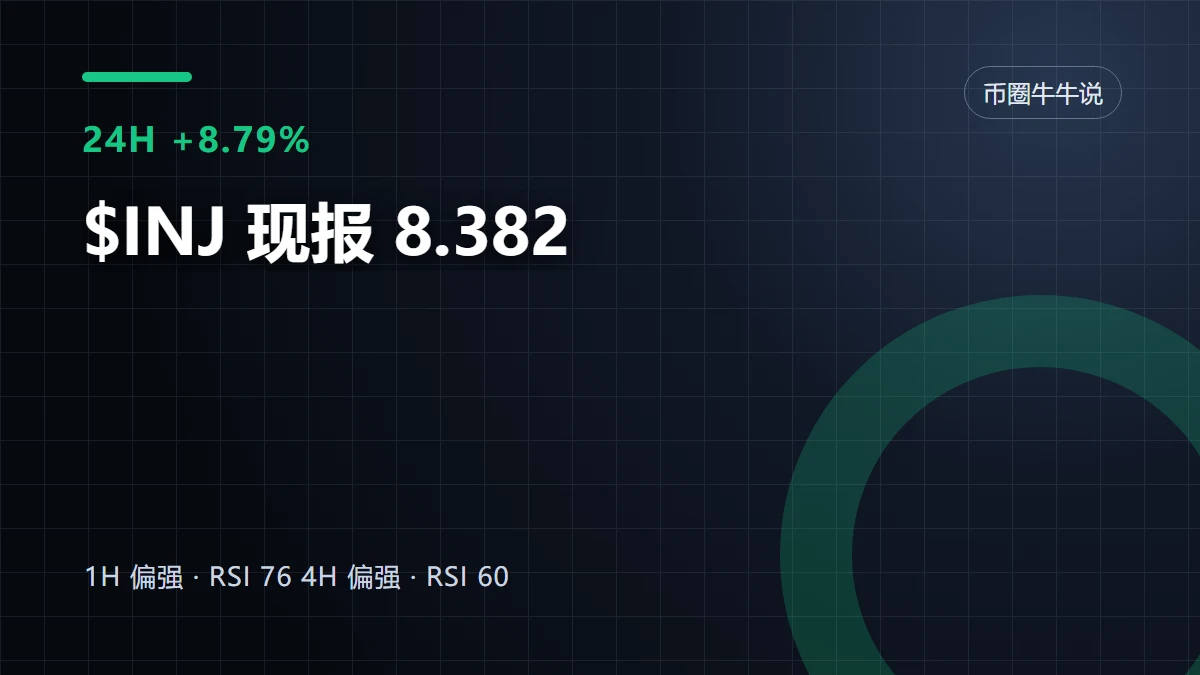
Which step in this $INJ rally is the easiest to get fooled by?
When I looked at $INJ again, I first covered up the 24-hour +8.79%. It’s not that this number is unimportant, but it is too easy to let it steal your attention. What really needs explaining right now is that $INJ remains strong, while crowding has also been put plainly on the table. I admit the trend is strong, but what needs watching next is not how much higher it can surge, but whether anyone steps in on the first pullback.
The most convenient—and easiest to get wrong—reading is to mistake hype for support during a rise. Real su
post-image
INJ+8.44%
Eth market update
live-cover
LIVE1,621
Bottom-fishing: As the night session begins, the market enters the countdown
Stage One: Studying technical analysis.
Watching candlestick charts, moving averages, and MACD every day, while studying all kinds of trading strategies and indicators. The more I learned, the more excited I became, always feeling that I understood a little more than others and was a little closer to making money.
Stage Two: Becoming obsessed with tools.
I started switching software, buying data, and adding indicators, practically wanting to cover the entire screen. I now also use TradingVane to view charts and browse
post-image
BTC+0.75%
( new streamer) market overview
live-cover
LIVE537
$ZEC Preparing to short, stop-loss at 1280-1300
post-image
ZEC+6.96%
  • 1
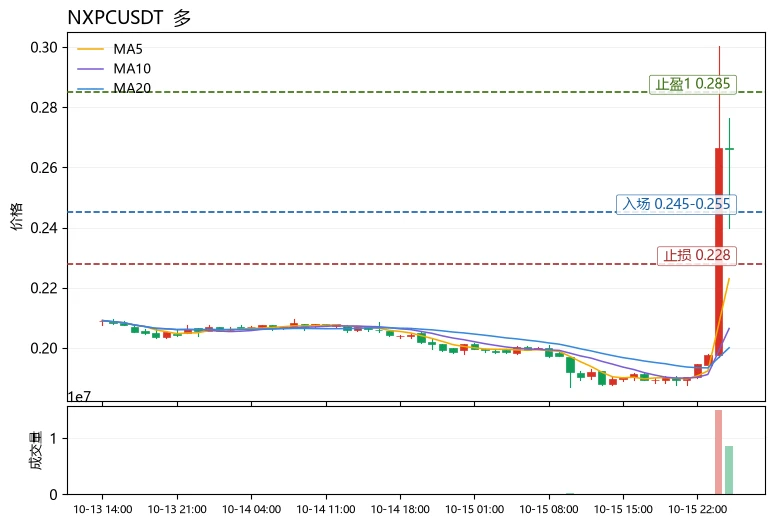
Many people see RSI surge above 80 and immediately shout “overbought, time to short,” applying range-bound market experience rigidly to a trend-starting move. Overbought only means the short-term rally is fast; it does not mean the trend is ending—the real thing to watch is whether the moving-average structure is healthy.
Take $NXPC as an example: the current price is 0.266, up 33% over 24h, with RSI as high as 89.1, which looks frightening. But MA5=0.223 has clearly crossed above MA20=0.200, the moving averages are diverging bullishly, and the MACD histogram at +0.008 remains bullish. This i
post-image
NXPC+25.03%
OSMO+17.07%
ZK+17.24%
🟢 $H long
Stop: $0.0549
Target: $0.0658
1.95R planned · 8/10 checks
P. Acct risk: 10.00%
— DTT
Breaking news 🚨Ledger launches Ledger Atom, a hardware device capable of running Android apps while isolating and protecting cryptocurrency signing and AI approvals ⚡It combines the familiar mobile device experience with top-tier key protection, making it suitable for advanced users and enterprises 🔒. An independent security mode protects transaction signing from potential malware. Early testing shows that apps run smoothly without compromising cryptographic security. Stay tuned for further updates 📢$NXP, $ANIME, $AGT
post-image
AGT+114.07%
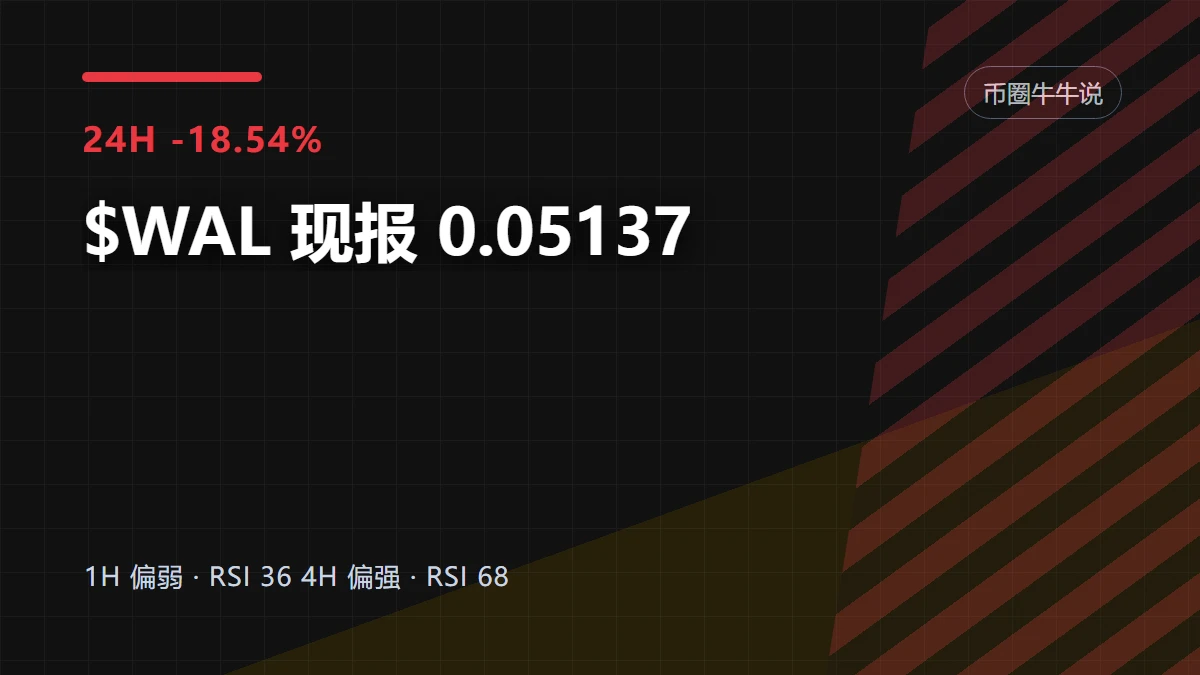
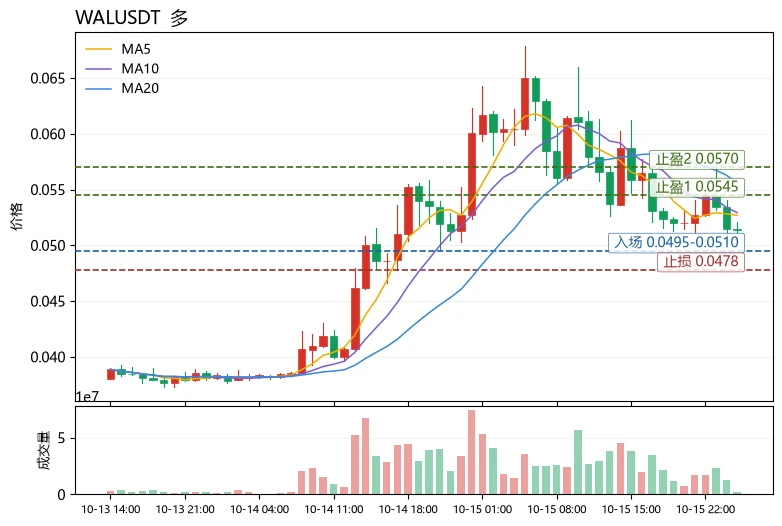
$WAL The most interesting thing right now isn’t guessing whether prices will rise or fall, but seeing who is forced to change their tune first.
The bulls’ test is at 0.06786, while the bears’ test is at 0.0503. $WAL is currently at 0.05137, down 18.54% over 24 hours. The 1-hour support is 0.0503, resistance is 0.06786, and current volume is 0.14 times the average volume of the past 20 periods.
I’ll first note that the 1-hour chart for $WAL has moved, while the 4-hour chart still hasn’t acknowledged it, because I treat shorter timeframes as alerts, not direct conclusions; if the higher timefram
post-image
WAL-16.48%
$UNI UNI this pile of fancy renovations 💩 — the protocol looks glossy, the token lies flat, the team counts money until their hands cramp, and retail investors get stuck so badly they start questioning life 😅 . Big trading volume? More users? Just the words “leading” and “leader” get you a get-out-of-death gold card? They’re doing business; you’re holding a daytime dream. If it drops, it’s called “wrong kill”; if it moves sideways, it’s called “building up strength”; if you’re trapped, it’s called “long-termism.” With a different package, people will kneel and舔 — this isn’t investing, it’s
post-image
UNI+4.02%
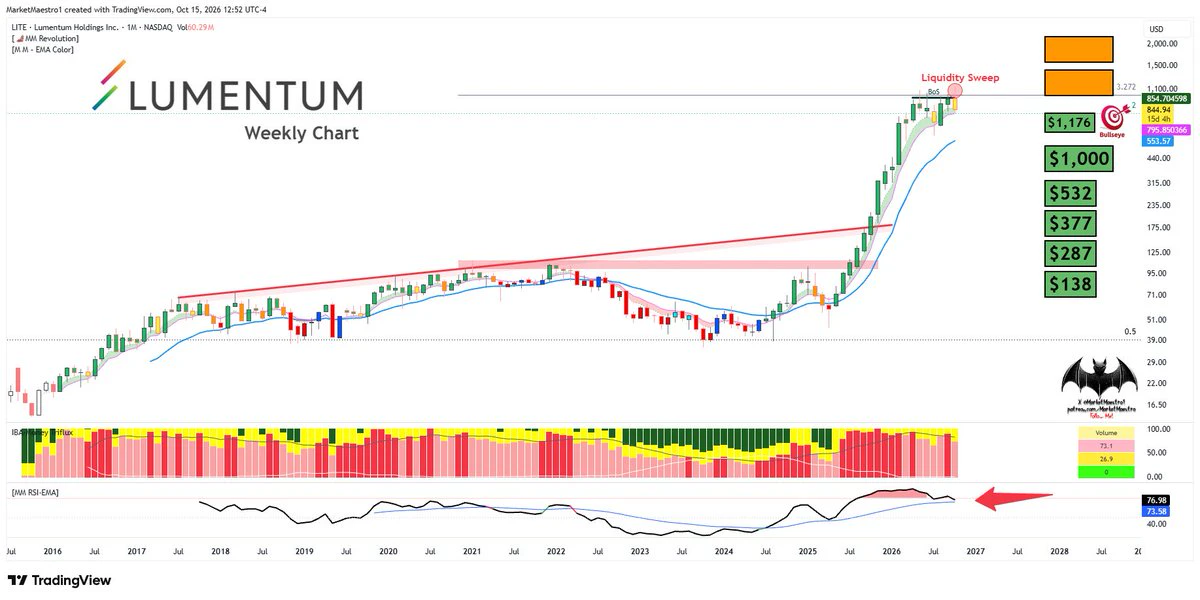
$LITE
It made a liquidity sweep after the BoS breakout. You can see the bearish divergence in RSI
post-image
LITE-5.33%
✨ Inflation data has shifted the macro narrative, with markets recalibrating their positions.
🔹 Following the hotter-than-expected CPI print, today's PPI report confirmed that price pressures are broadening beyond consumer level. The September PPI rose 1.3% month-over-month and 6.3% year-over-year, exceeding consensus estimates and marking the largest monthly increase in four and a half years .
📊 Key price levels as the market digests the data:
🔹 Bitcoin: Trading near $81,500, down about 3.6% over 24 hours, after breaking below key support levels .
🔹 Gold: Recovered above $4,150, up over 1
BTC+0.75%
XAUUSD+1.25%
XAGUSD+2.55%
XRP+1.01%
$STRK
One of the coins that most respects technical analysis remains strong, and we expect it to reach 10 to 15😎✋WarshPushesToScaleBackForwardGuidanceAndDotPlot$TR
$AR
post-image
STRK+19.38%
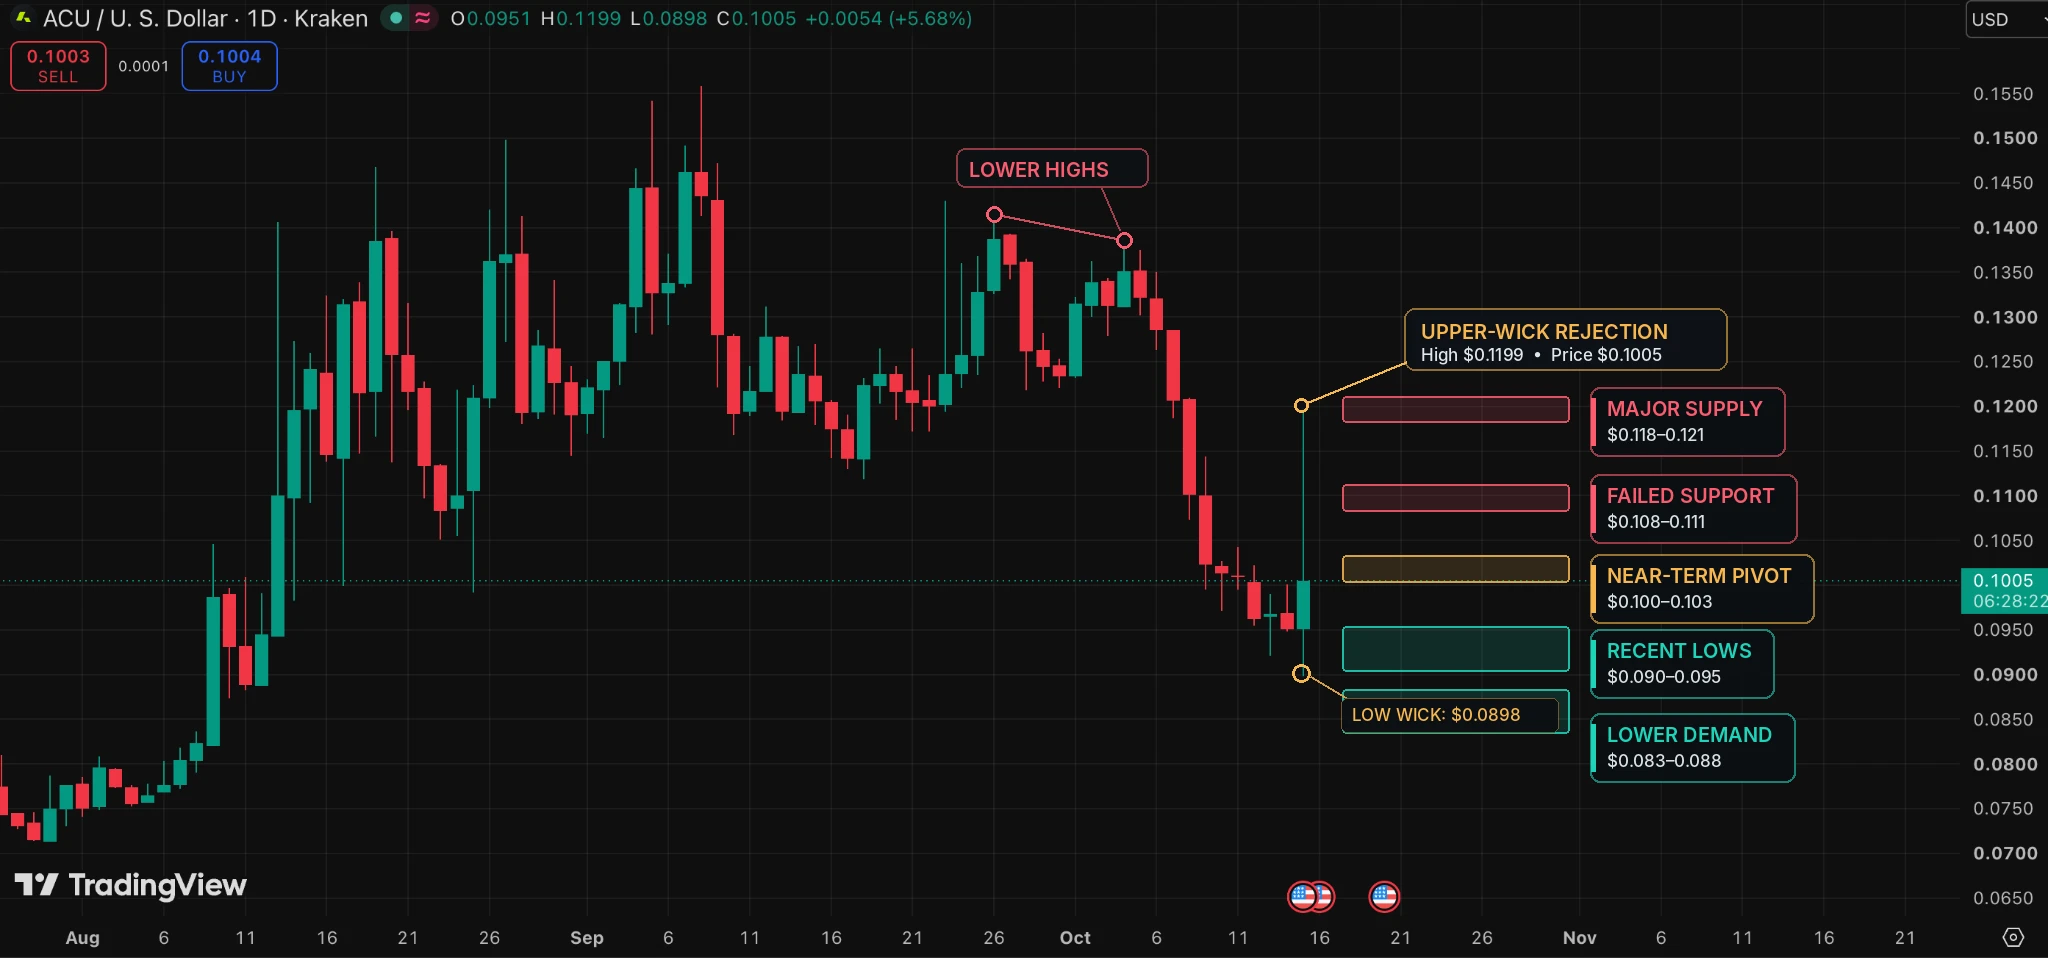
$ACU Jumps 5.68%, But the Rejection Near $0.12 Raises Questions
$ACU is showing some recovery after days of selling pressure, but the daily chart is still far from bullish.
Price jumped from $0.0951 to $0.1199 before falling back toward $0.1005.
That's a sharp rejection.
The long upper wick suggests buyers tried to push higher, but sellers stepped in near the $0.118–$0.121 resistance zone.
Interestingly, price also briefly dropped to $0.0898 before recovering. This could be a liquidity sweep, although confirmation is still missing.
What are the key levels now?
$0.100–$0.103: Immediate resista
post-image
ACU+3.34%
Strive Buys $280M in Bitcoin, but BTC Per Share Rises Only 1.72%
Strive bought 3,311 BTC during Oct. 5–9 while its cash balance rose, showing accumulation alongside replenished liquidity.
Strive’s gross Bitcoin per effective common share rose 1.72%, while additional SATA shares increased claims ahead of common holders.
⚠️ Personal market analysis only. NFA — manage risk and DYOR.
Educational content, not investment advice or a recommendation to buy, sell, deposit, or withdraw any asset. No paid promotion or referral/affiliate links.
post-image
ASST+2.22%
SATA-0.30%
BTC+0.75%
  • 1
$FIL 5L
see the fil original price bro what is wrong with this etf 😂😂 @Gate_Square
$FIL
$FIL5L ‌
FIL5L-14.72%
FIL+0.33%
The most unusual detail in today’s market isn’t the decline, but the funding rate: $WAL plunged 17.31% over 24 hours, yet its funding rate crashed to -0.0581%, with shorts overwhelmingly crowded and still paying to hold positions. This extreme “falling price, negative funding” structure is often a sign of crowded shorts rather than a healthy trend, making it worth reviewing through a moving-average framework.
First, the method: to determine whether a trend is healthy, look at two points—the moving-average alignment and the price’s position within the Bollinger Bands. $WAL The current MA5=0.05
post-image
TIA+8.11%
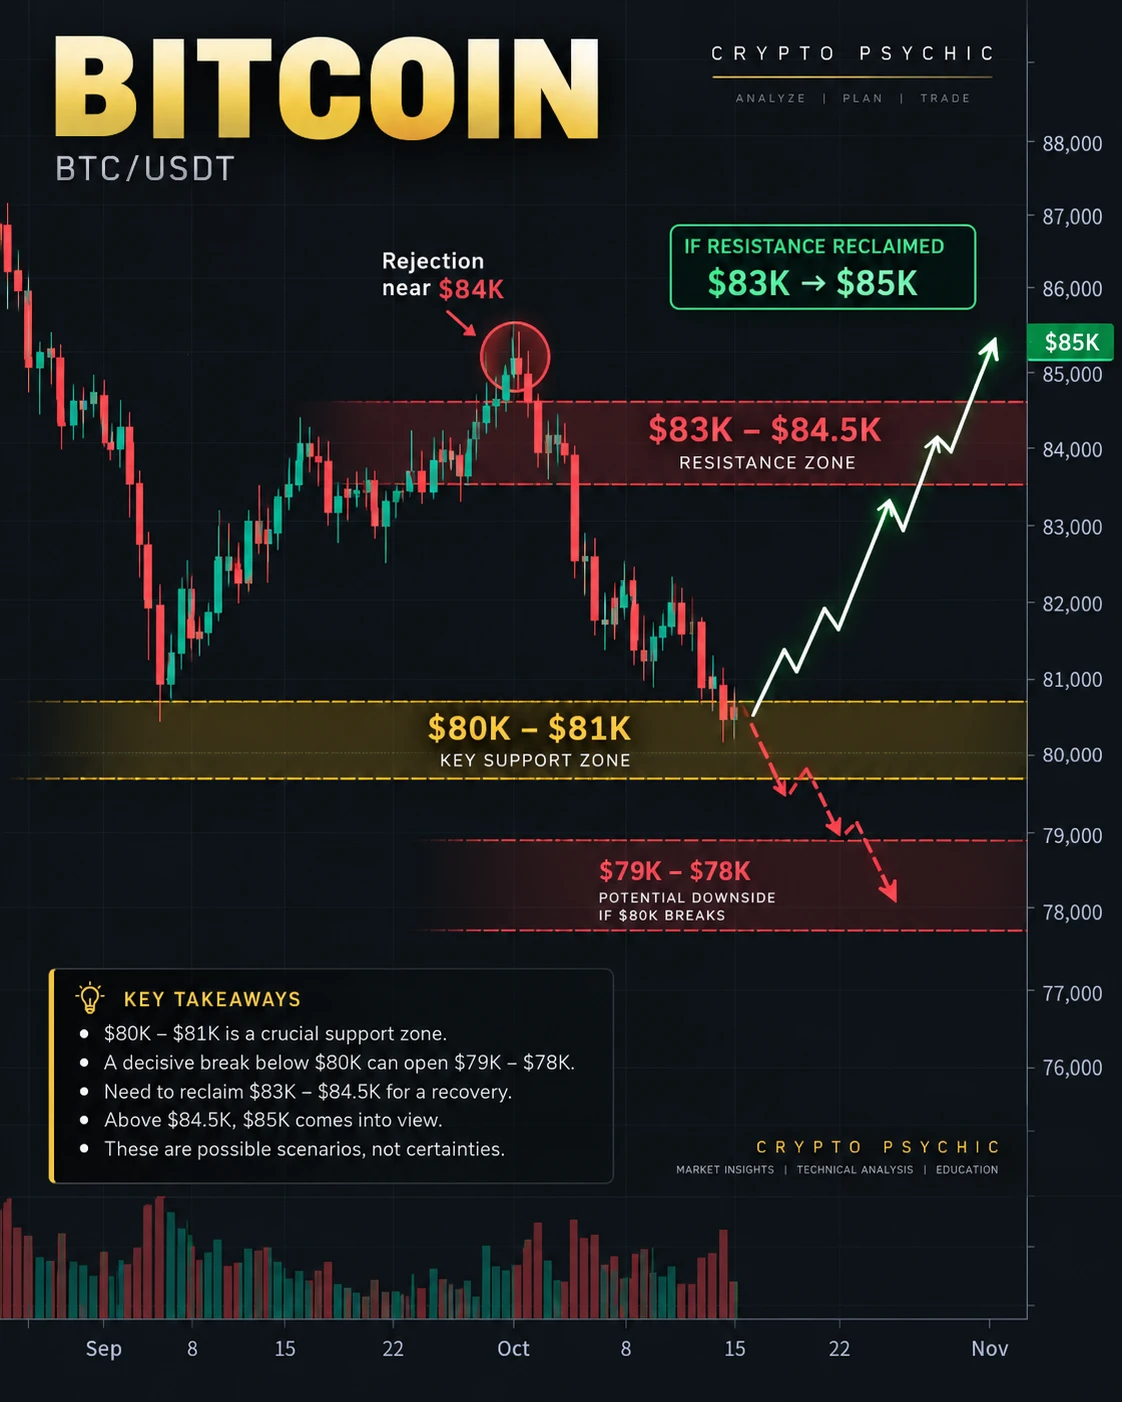
🚨 BITCOIN IS AT A CRITICAL LEVEL RIGHT NOW.
$BTC pushed toward $84K, but the breakout failed to hold. Now the market is testing a zone that could decide the next major move.
Here’s what I’m watching 👇
🔴 $83K–$84.5K: Resistance. Bulls need to reclaim this zone to bring momentum back.
🟡 $80K–$81K: Critical support. Buyers need to defend this area.
If BTC loses $80K decisively, the next downside zones to watch are around $79K–$78K, with deeper support potentially near $76K.
But don't assume the dump is guaranteed.
If BTC reclaims $83K and holds above it, a recovery toward $84.5K–$85K becomes
post-image
BTC+0.73%
  • 1
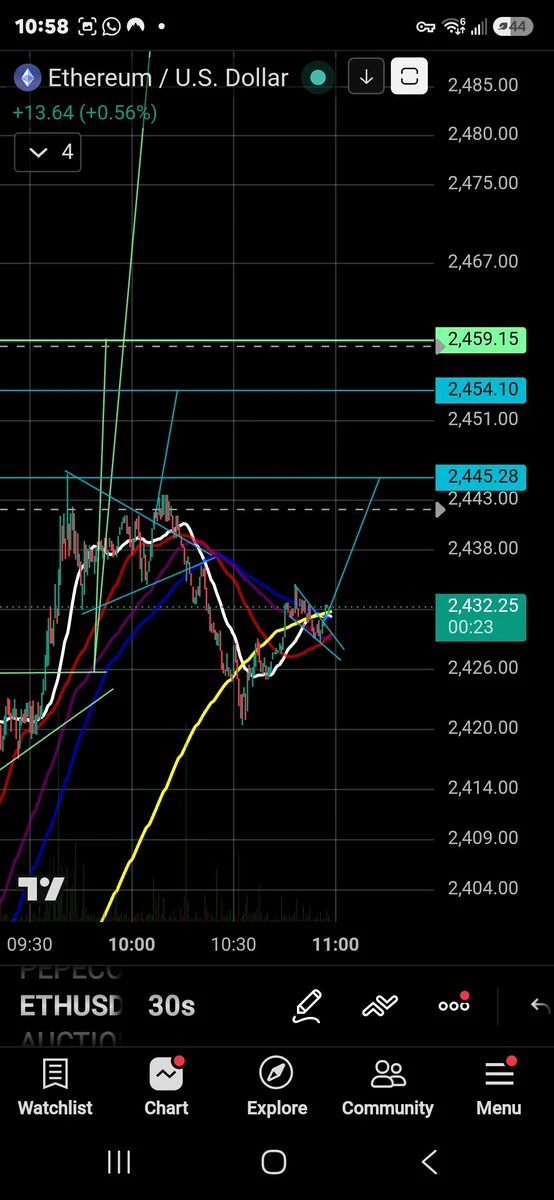
Small long position on $ETH just opened cup and handle breakout. LFG!!!
post-image
ETH+0.66%
Load More

Join 40 M users in our growing community

⚡️ Join 40 M users in the crypto craze discussion

💬 Engage with your favorite top creators

👍 See what interests you

Trending Topics

USSeptemberPPIBeatsExpectations

91.35k Views1.86k Discussing

US September PPI came in at 6.3% YoY, well above the 5.3% market expectation, pointing to renewed producer-side inflation pressure. Weekly jobless claims were 199K, broadly in line with forecasts. Could hotter inflation further reduce room for rate cuts, and what does it mean for $BTC, US stocks, and gold?

DrLinHanSpeaksAtOxfordUnion

135.63k Views1.86k Discussing

JapanAndKoreaStocksPlunge

47.27k Views1.75k Discussing

View More