📉
$BTC – The Daily Chart Is Showing Weakness!
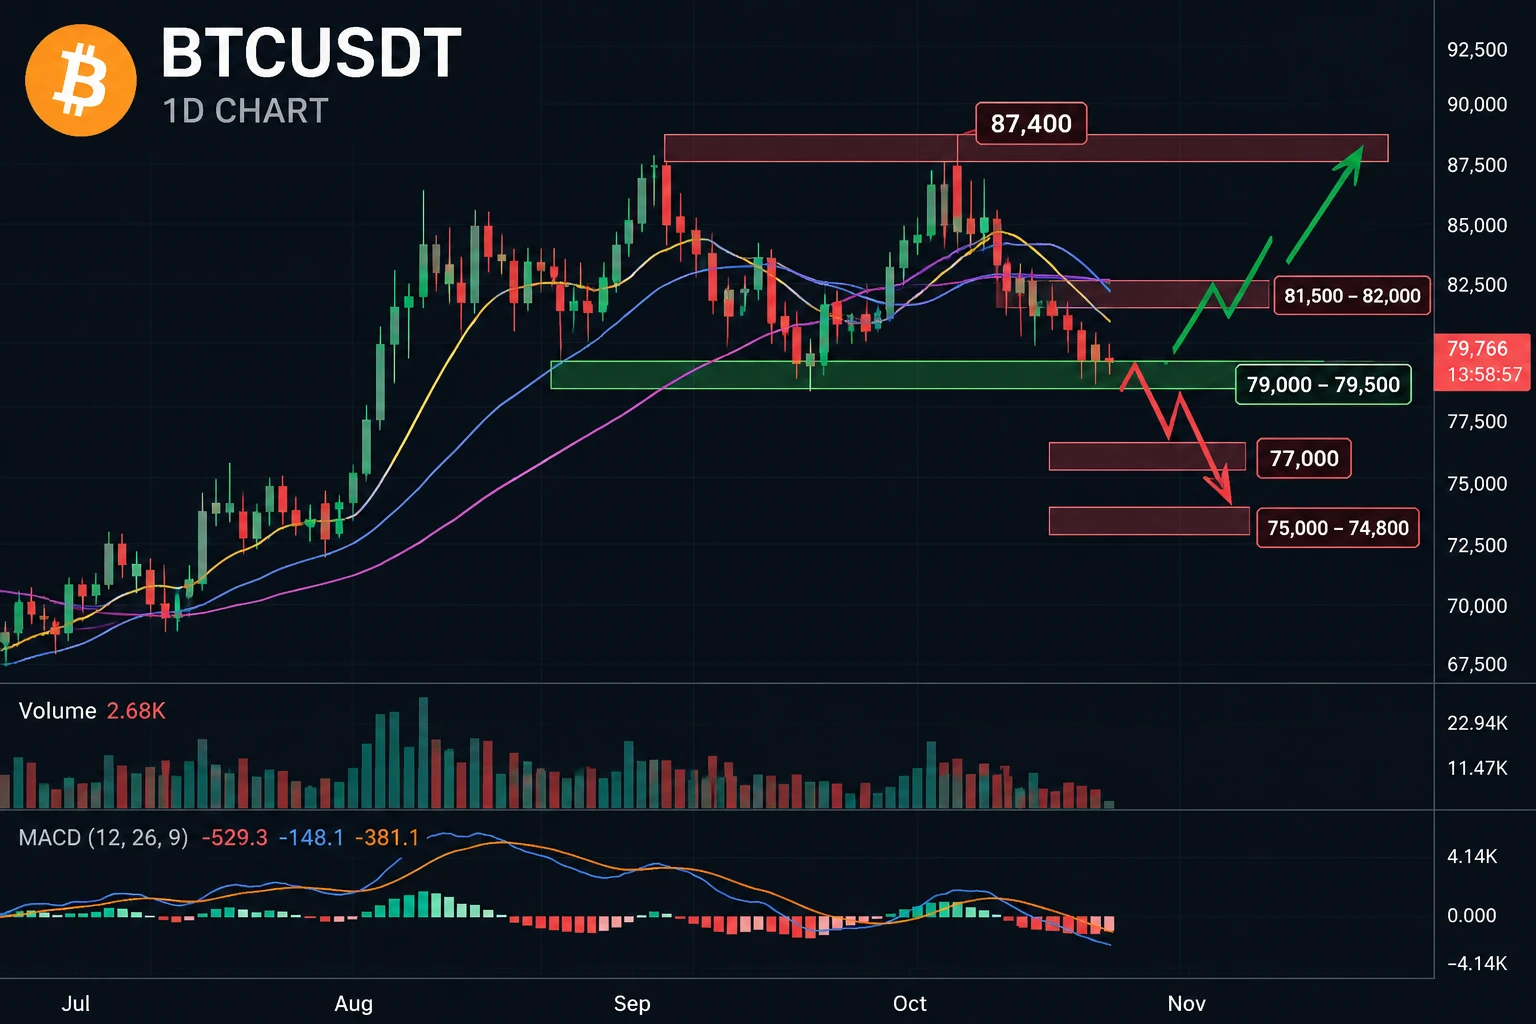
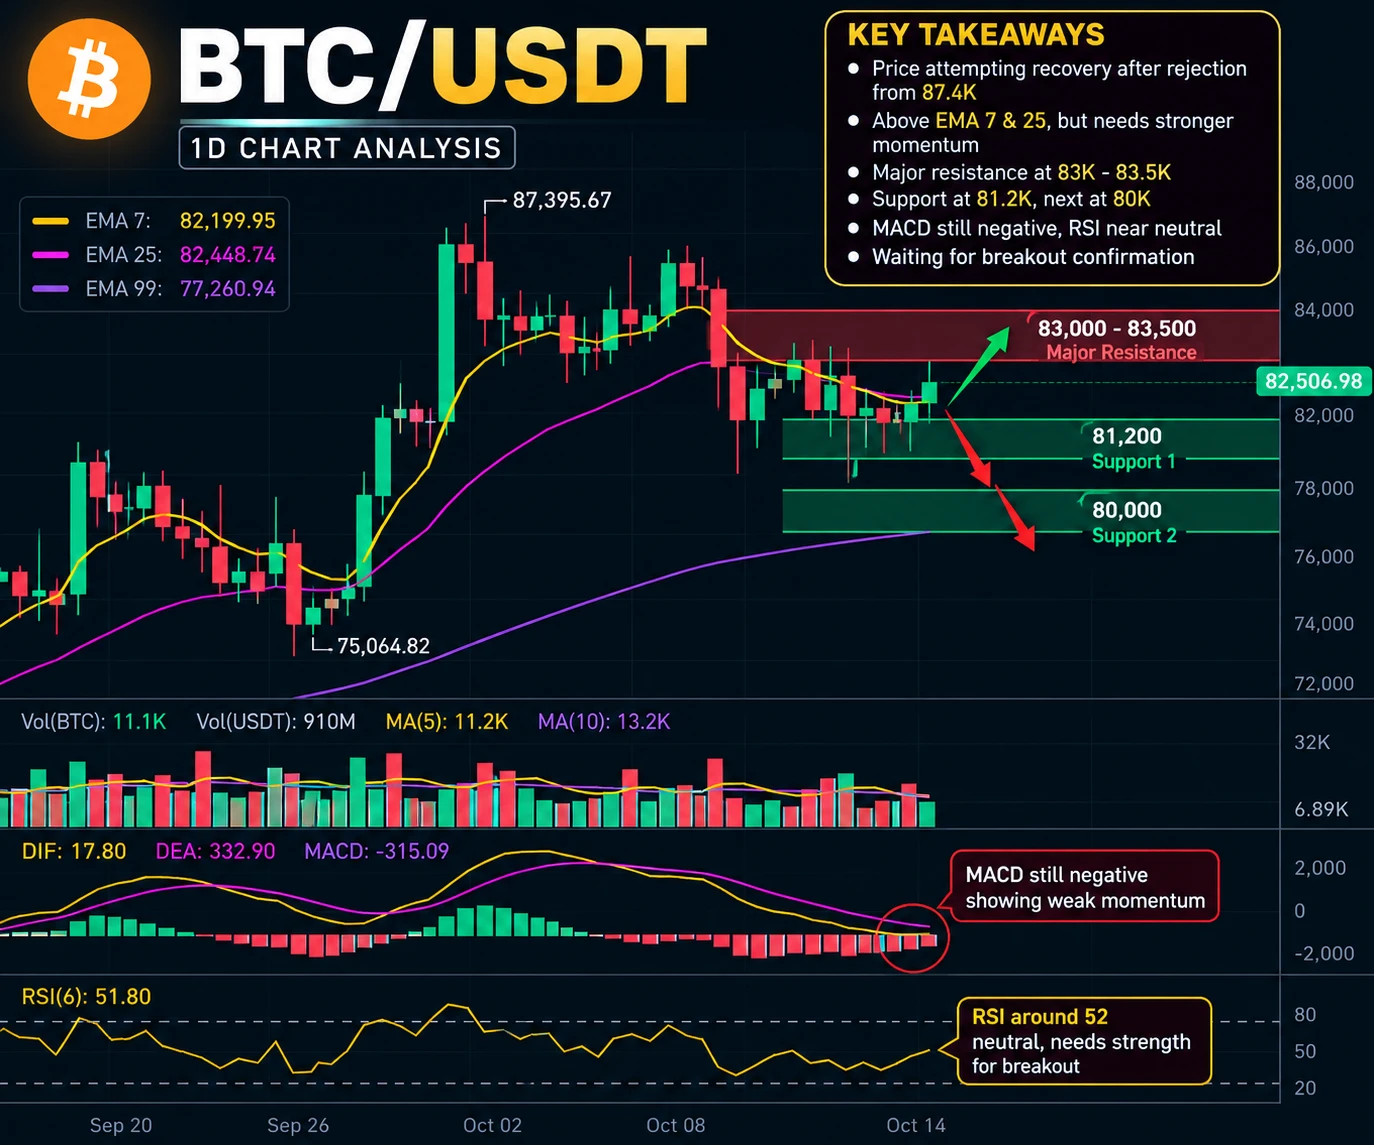
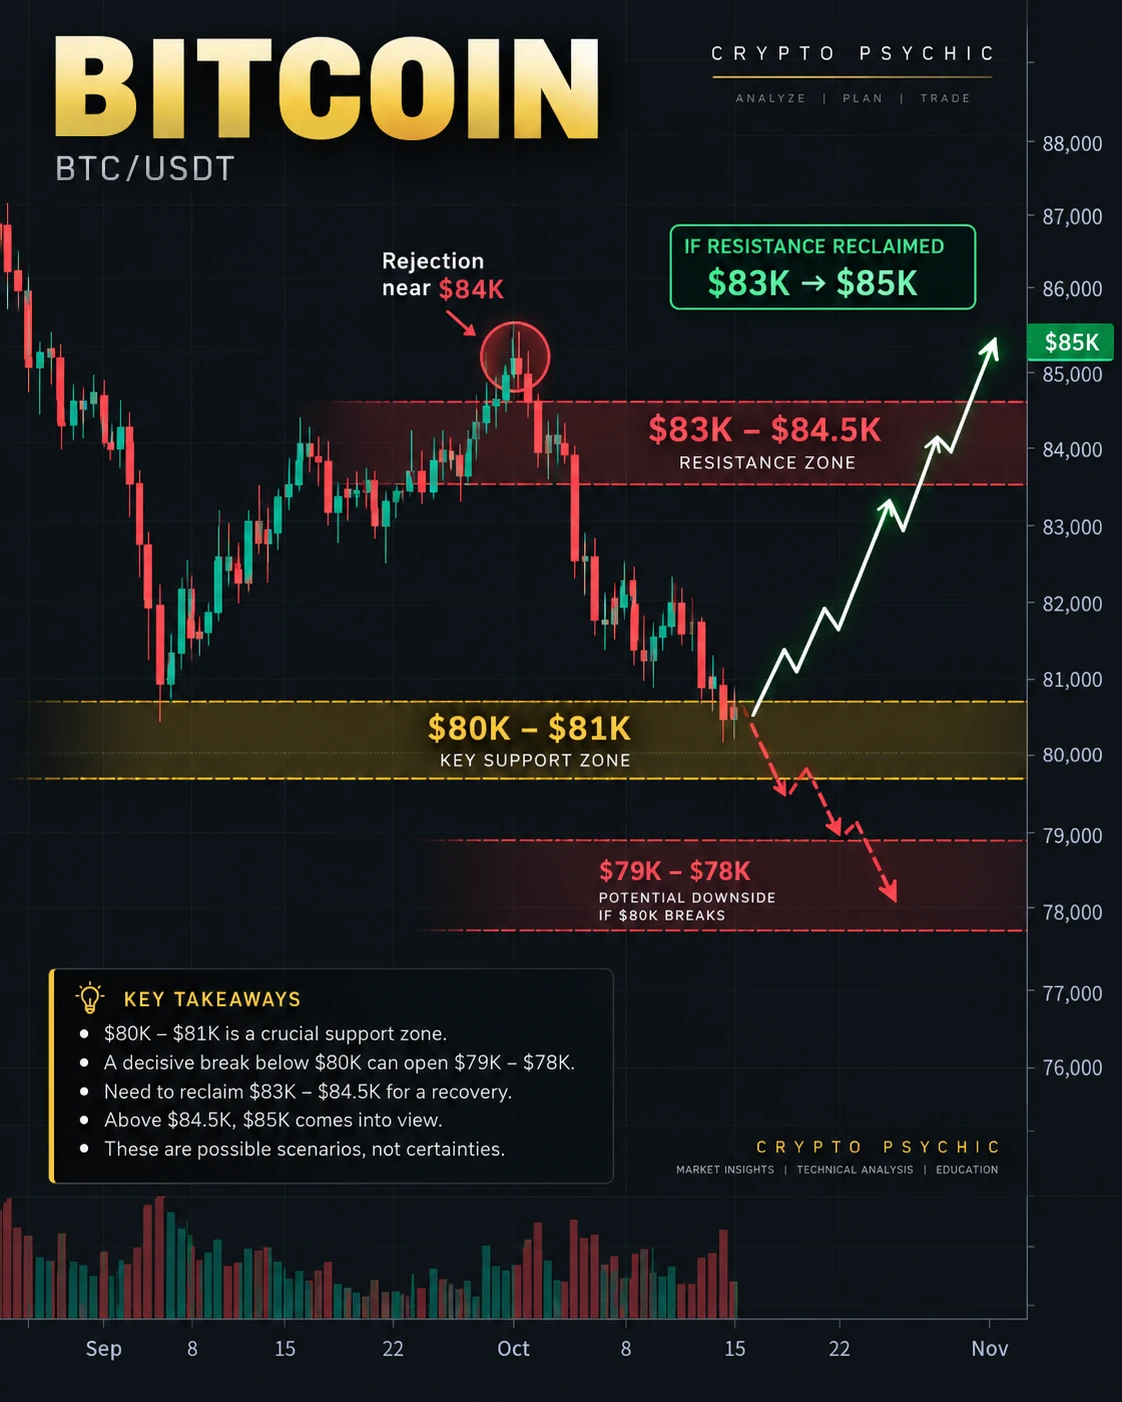
Bitcoin is struggling to maintain its bullish momentum after getting rejected from the $87,400 region. Since then, the price has been forming lower highs, and sellers are gradually pushing BTC toward the $79,000 support zone.
Looking at the daily chart, BTC is trading below its major moving averages, with the short-term averages sloping downward. The MACD is also in negative territory, suggesting that bearish momentum is still dominating.
Here's what I'm watching next 👇
🔴 Bearish scenario: If BTC loses the $79,000–$79,500 support zone, we could