



Share your thoughts
placeholder
Article
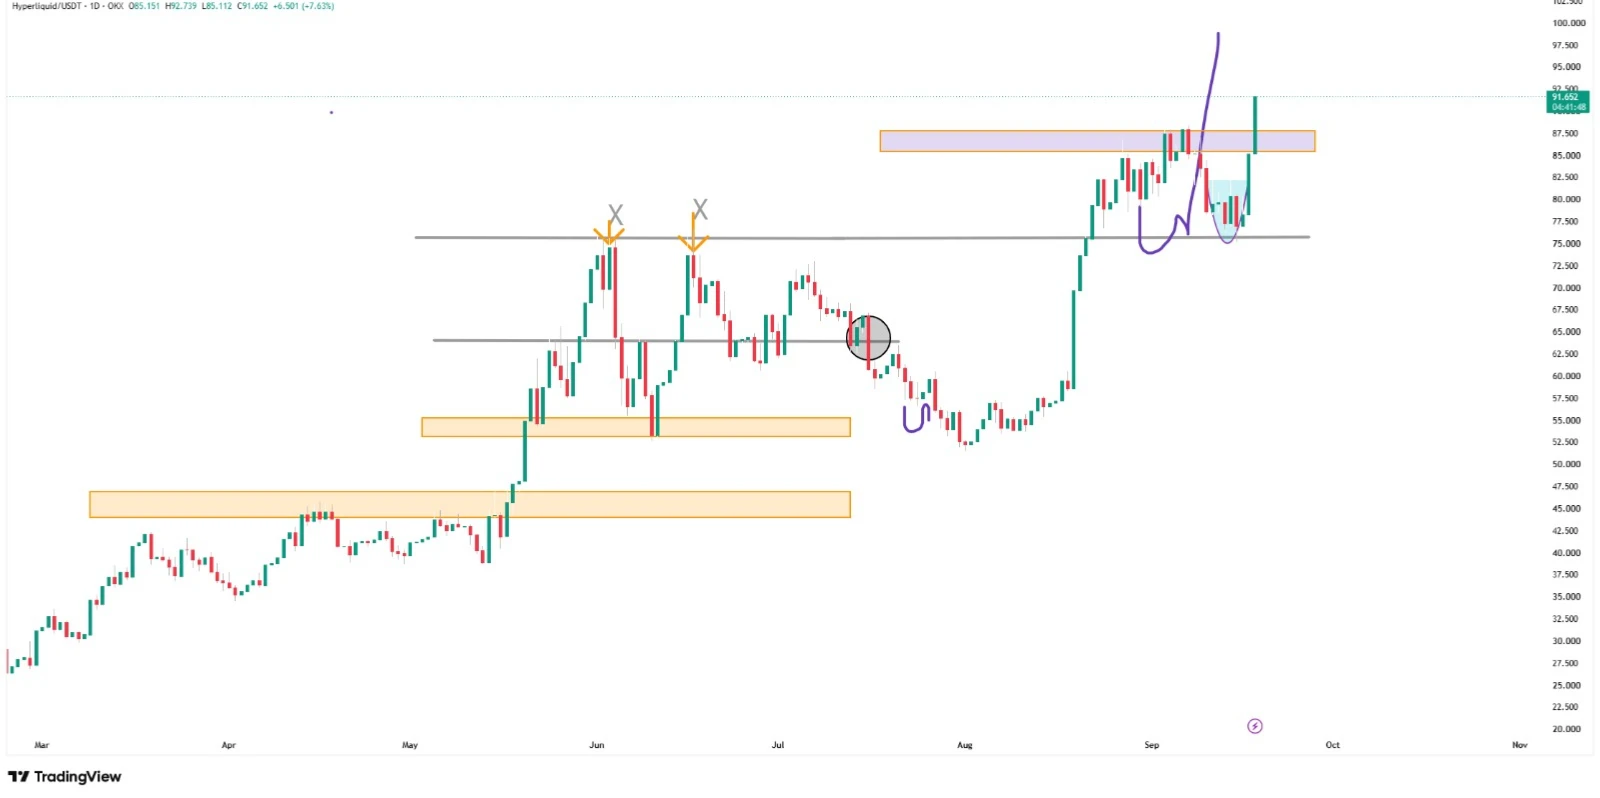
$HYPE just did what I wanted to see.
Clean reclaim of the $86–88 resistance zone, followed by a strong push above it.
Now the chart is giving a pretty clear setup:
Hold above $88 → bulls stay in control.
Lose it → I’d expect a deeper retest.
If $HYPE keeps this momentum, $95 → $100 becomes the next area I’m watching.
No chasing after a +7% candle.
Let the retest come to us.
$HYPE looks like it’s entering the next leg.
post-image
HYPE+10.17%
#eth Opened a short at 2640. Hopefully it drops so the guys can take some gains. I couldn't stay awake any longer, so I'm going to sleep and check tomorrow. The stop-loss is set at the previous high +1; the loss is still acceptable. Always use a stop-loss. Whether we're eating instant noodles or picking up models depends on today.😂
post-image
ETH+7.16%
  • 1
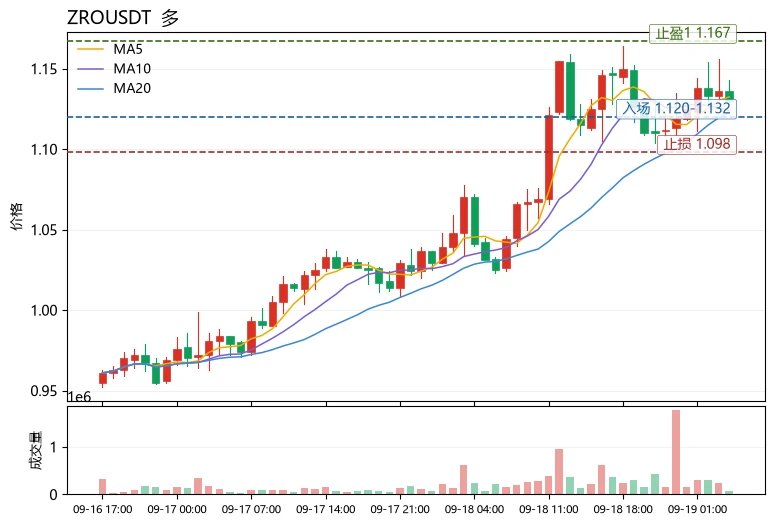
$ZRO Today's most unusual detail: it rose 7.31% over 24h, yet the MACD histogram remains bearish at -0.00294, with the price surging while the momentum indicator diverges—this is a typical “price leads, indicator lags” structure, rather than a trend that has already run its course.
Breaking it down: MA5=1.1324 has crossed above MA20=1.1226, with the short-term moving average structure turning bullish; RSI=60.1 is in the strong but not overbought range, leaving room for further upside; the Bollinger upper band at 1.16727 is the first resistance, while the lower band at 1.07793 and MA20 form dua
post-image
ZRO+7.62%
TRUMP+7.76%
ZEC+0.02%
Watching the chart nonstop gets exhausting; turning it off actually made things clearer, and I stopped panicking when I wasn't staring at it.
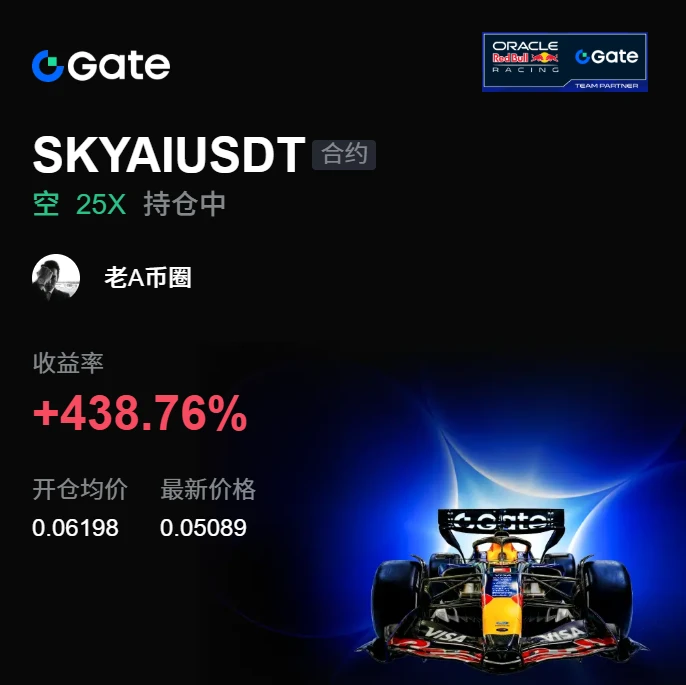
During the repeated intraday swings, resistance was obvious above $SKYAI , with no buyers on the way up, so I suggested setting up a short position. From 0.06198 to 0.05089, +438.76%—that was a satisfying bite.
Close 80% first, and move the remaining 20% to the entry price for protection. Don't get greedy for the last bite.
Don't let profits inflate your ego, and don't despair over drawdowns. Have a strategy before the market opens, discipline during tra
post-image
SKYAI-2.38%
ETH+7.16%
BTC+5.74%
btc market chart
live-cover
LIVE74
Honestly, the fact that this trade has survived until now still feels unbelievable to me; luck played a significant part.
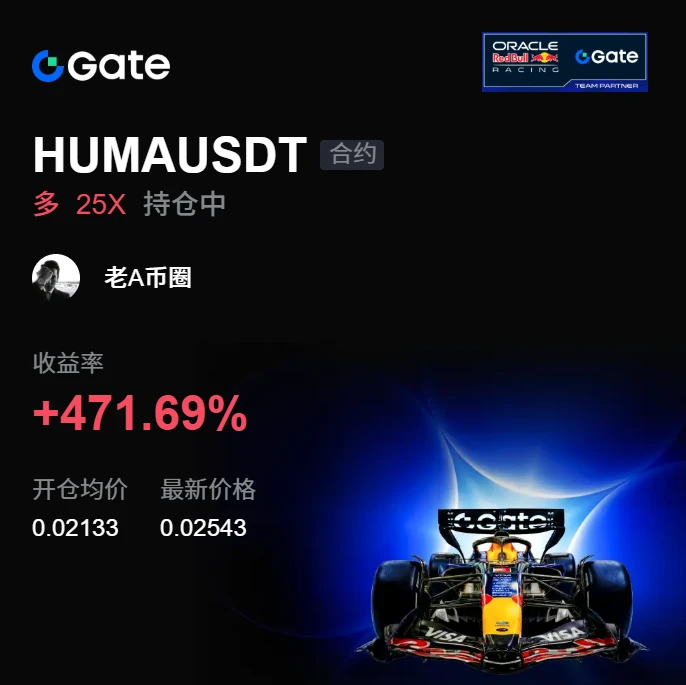
A few days ago, I was watching $HUMA in the early hours of the morning. The key level held, and it stabilized again after the pullback. I only gave one signal at the time: open a long. I didn’t expect it to really come through.
From 0.02133 all the way to 0.02543, +471.69%—that says it all. This was a satisfying bite of profit, and staying up late was worth it.
You wait for the market to come around, and you hold on to profits. Putting risk management first is rational; cut
post-image
HUMA+4.31%
ETH+7.16%
XRP+7.97%
$ZEC 🔥 Breaks $1,500 What’s Behind the Privacy Coin Rally?
Zcash has suddenly become one of the biggest stories in crypto.
ZEC pushed above $1,500, reaching around $1,527 on Sept. 18 before pulling back. Recent data shows the move has been accompanied by strong trading activity and renewed attention around Zcash’s privacy narrative.
But this rally isn’t only about price.
🔐 Privacy is back in focus
Zcash allows shielded transactions using zero-knowledge technology, giving users the ability to verify transactions without publicly exposing certain transaction details.
⚡ NU7 is another catalyst
ZEC+0.02%
  • 6
  • 1
INJ jumps 17.1% in one day, but pulls back after the news lands: who is cashing out
Well, $INJ jumped 17.1% in one day, with a volume ratio of 2.672, but after the news landed, it slipped from 6.747 to 6.641. I’m bullish but won’t chase—buy the dip at 6.153, and cut losses below 5.967.

The event in one sentence: WallStreetBets posted that Injective is bringing stocks, RWA, and institutional trading on-chain—the finance-specific chain is hitting the target, and 24h volume of 25510398 USDT is real money.

Leverage isn’t overheated: the 0.0001 funding rate is neutral, and the long-short ratio
INJ+15.43%
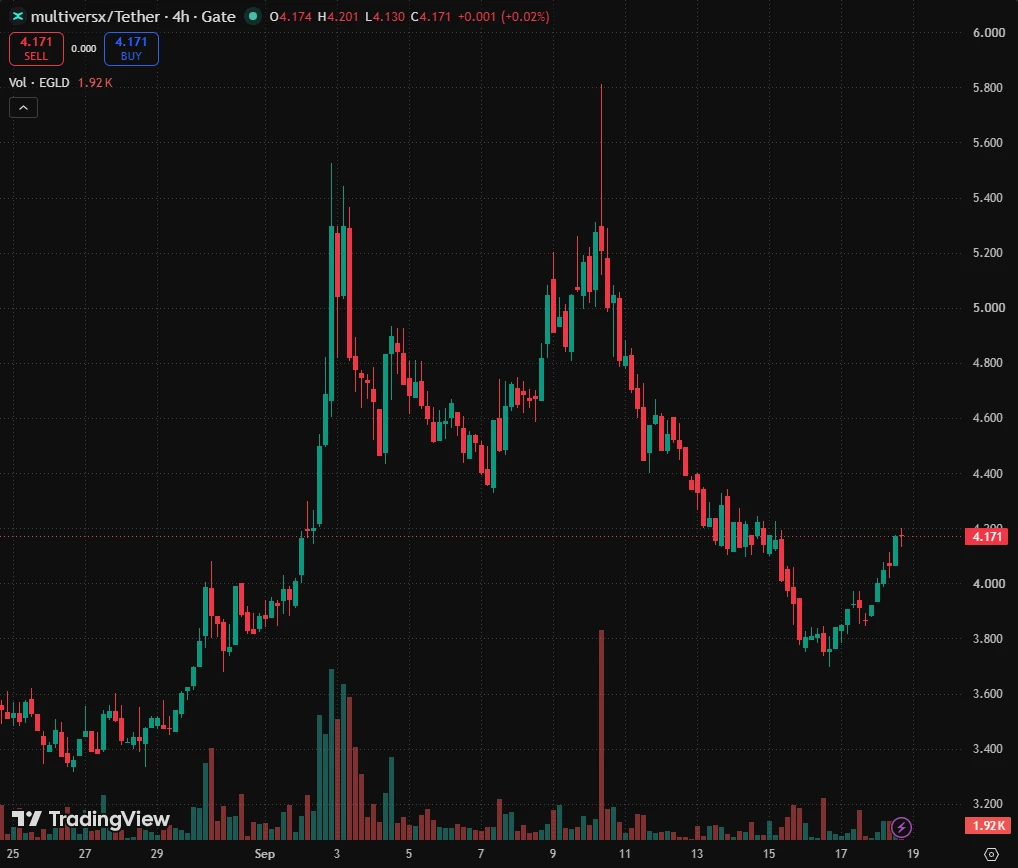
$EGLD EGLD— Short-Term Setup After the Breakout
EGLD— Short-Term Setup After the Breakout
EGLD
EGLD has finally started to change its short-term structure.
After reacting strongly from an important support zone, price managed to break the key downtrend that had been controlling the previous move lower.
This is the first part of the setup I was waiting for.
The important thing now is not simply that the trendline was broken. I want to see whether buyers can defend the breakout and turn this into a proper higher-low structure.
Trading Setup
Direction: Long
Entry:
Wait for a pullback toward the b
post-image
EGLD+7.83%
I didn’t make any particular judgment; I just held it a little longer and didn’t expect it to really cooperate.

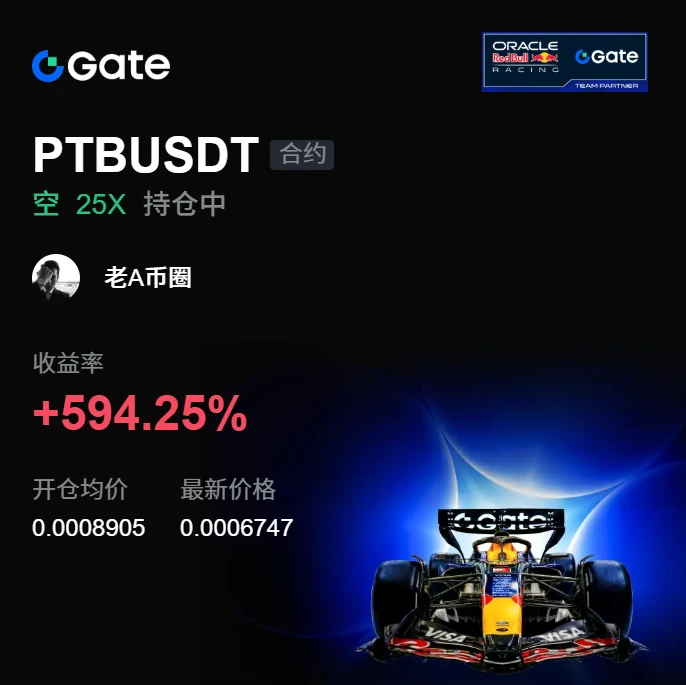
During the repeated intraday swings, I watched $PTB . There were no buyers on the way up, selling pressure was strong, and trading volume was low, so I advised shorting at high levels and waiting for a breakdown.

Opened a short at 0.0008905; it fell to 0.000675, with unrealized gains of +594.25%. That was a satisfying bite of profit—it was worth the wait.

Take 80% off first, and protect the remaining 20% at the breakeven price. Even if it rebounds, don’t give the profits back; i
post-image
PTB+4.94%
BTC+5.74%
DOGE+7.41%
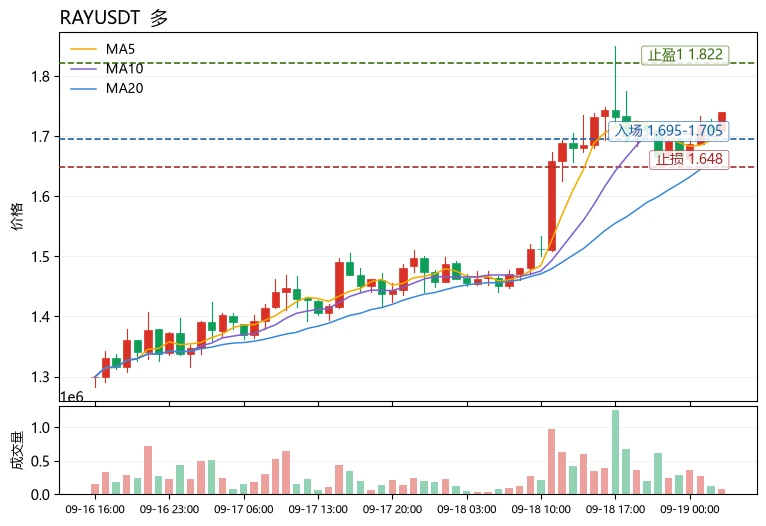
$RAY Conclusion first: Short-term longs have the edge, but the upside has entered a high-wick zone, making the risk of chasing highs greater than buying on a pullback.
From a funding perspective, $RAY 's funding rate is +0.0000%. Longs are not paying a premium, indicating that this 24h +18.80% rally was not driven by piled-up leveraged longs. Shorts have also not become crowded, making this a spot-driven rise with a solid support base still in place after a pullback. MA5=1.70278 has crossed above MA20=1.67108, confirming a bullish alignment. RSI=66.7 is strong but has not entered the overbough
post-image
RAY+18.18%
LSK+0.25%
Today Market talk
live-cover
LIVE56
The AI sector is in turmoil, with $AI in the gate meme section stuck at 0.018: I’m choosing to buy the dip
Nearly an hour ago, a Twitter KOL took stock of the AI sector: it took 3 to 5 attempts to break the previous high, and it withstood two rounds of seven-figure intensity tests, yet remained verbally somewhat skeptical. $AI is stuck at 0.018. I’ll say it plainly: bullish; hold as long as 0.0176 holds.

Current price: 0.018 (24h +4.05%, intraday 0.0172–0.0187). The volume ratio is 1.362, holding sideways after the volume expansion. Since the event, it has gone from 0.018 to 0.018. The narr
AI+4.80%
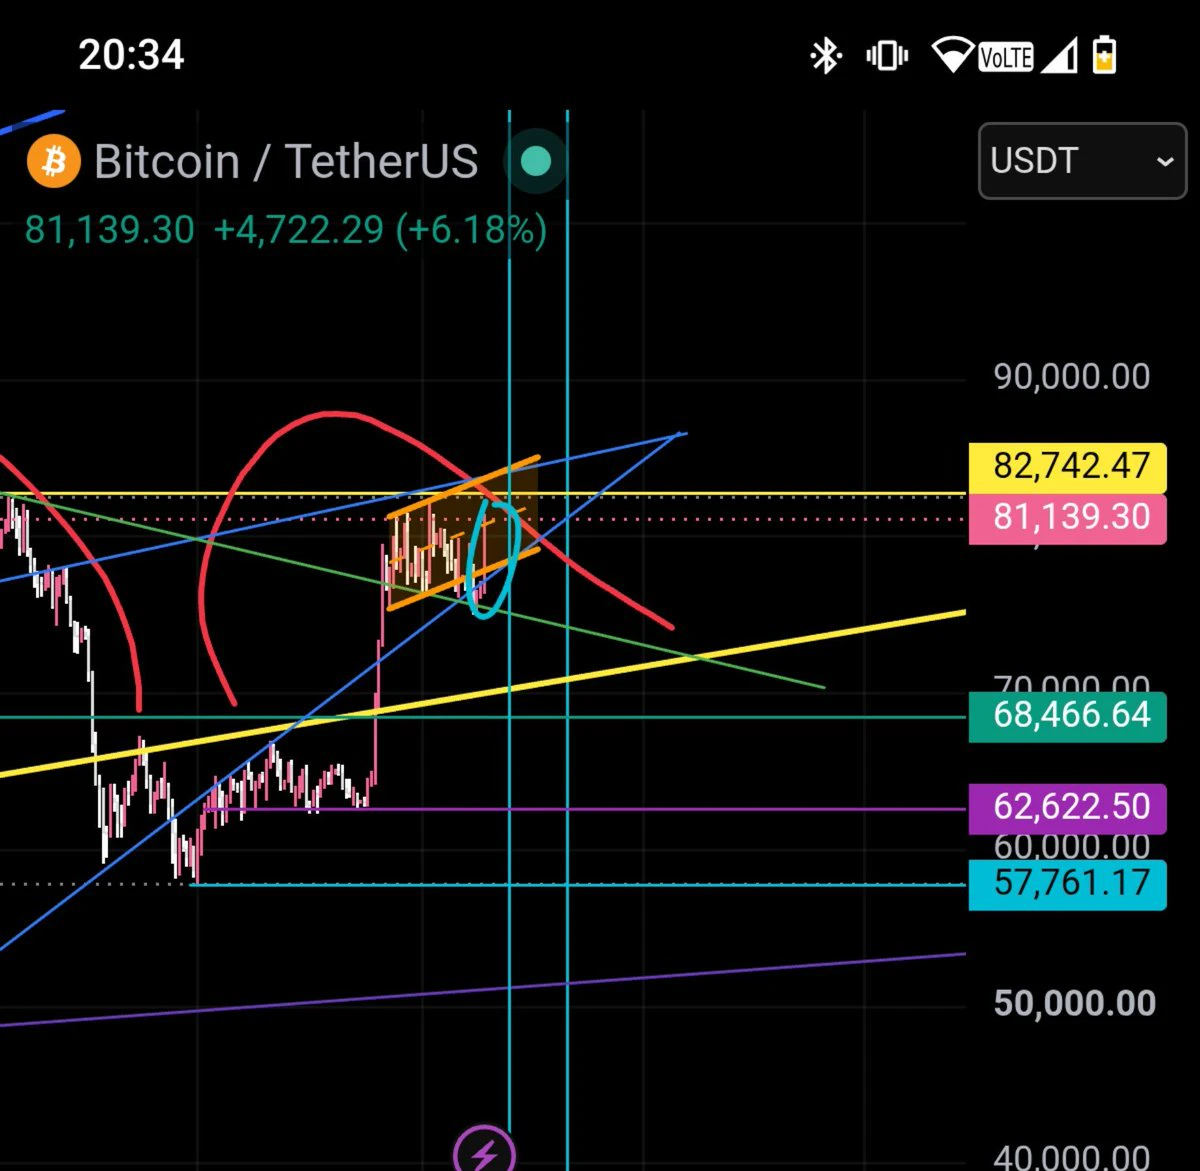
$BTC should go to 60k next
🐻🪜🎶🕯️🍂
post-image
BTC+5.69%
Follow the AI Infrastructure
The next AI winner may not be the company with the loudest AI story.
It may be the company supplying the infrastructure that makes the entire ecosystem possible.
So where does the real economic value sit beneath the AI boom?
The latest market action provides an important clue.
Arm jumped 8.57%, Astera Labs gained 9.06%, Supermicro rose 9.50%, while semiconductor stocks broadly outperformed. The Philadelphia Semiconductor Index climbed 3.14%.
This tells us something about how the market is viewing AI.
Artificial intelligence is not simply a software trend.
Every AI
post-image
xxx40xxx
The Liquidity Test Behind the AI Rally
The AI narrative is powerful—but even the strongest narrative must answer to liquidity.
The Fed just raised rates while Treasury yields pushed toward 5%.
Can AI stocks continue climbing when capital is becoming more expensive?
This is where the rebound becomes genuinely interesting.
On September 16, the Federal Reserve raised its benchmark rate by 25 basis points to 3.75%–4.00%, its first rate increase since 2023. The latest projections also point toward the possibility of another increase before the end of 2026.
At the same time, the 10-year Treasury yield has moved around the 5% area, keeping pressure on growth-oriented assets.
Normally, this creates a difficult environment for companies whose valuations depend heavily on future growth.
Yet AI stocks bounced aggressively.
That contradiction is the key.
The market appears to be weighing two forces against each other: higher discount rates versus stronger expectations for AI-related earnings and capital expenditure.
This is remarkably similar to crypto.
In Web3, traders watch stablecoin liquidity, exchange flows, funding rates and on-chain activity to understand whether capital is actually entering the ecosystem.
Equity markets have different instruments, but the underlying question is similar:
Is there enough liquidity and conviction to absorb higher risk?
If AI stocks can continue gaining while yields remain elevated, that would suggest investors are assigning substantial importance to AI demand and corporate spending.
If the rally fades as yields rise again, the market may be showing that macro conditions still dominate.
Therefore, the AI story is no longer only a technology story.
It has become a liquidity story.
And that takes us directly to the next question: where exactly is all this AI capital being deployed?
Is AI demand strong enough to overcome higher rates—or will liquidity ultimately determine the next chapter?
This content is not investment advice. Always perform your own research before making financial decisions.
$BTC $GT $ETH
#GateSquareMidAutumnReunion
#USAIConceptStocksReboundAcrossTheBoard #Gate广场中秋团圆局 #美股AI概念股全线反弹 #JapanRealEstatePowerChipStocksRise

repost-content-media
BTC+5.69%
GT+6.29%
ETH+7.11%
  • 8
  • 1
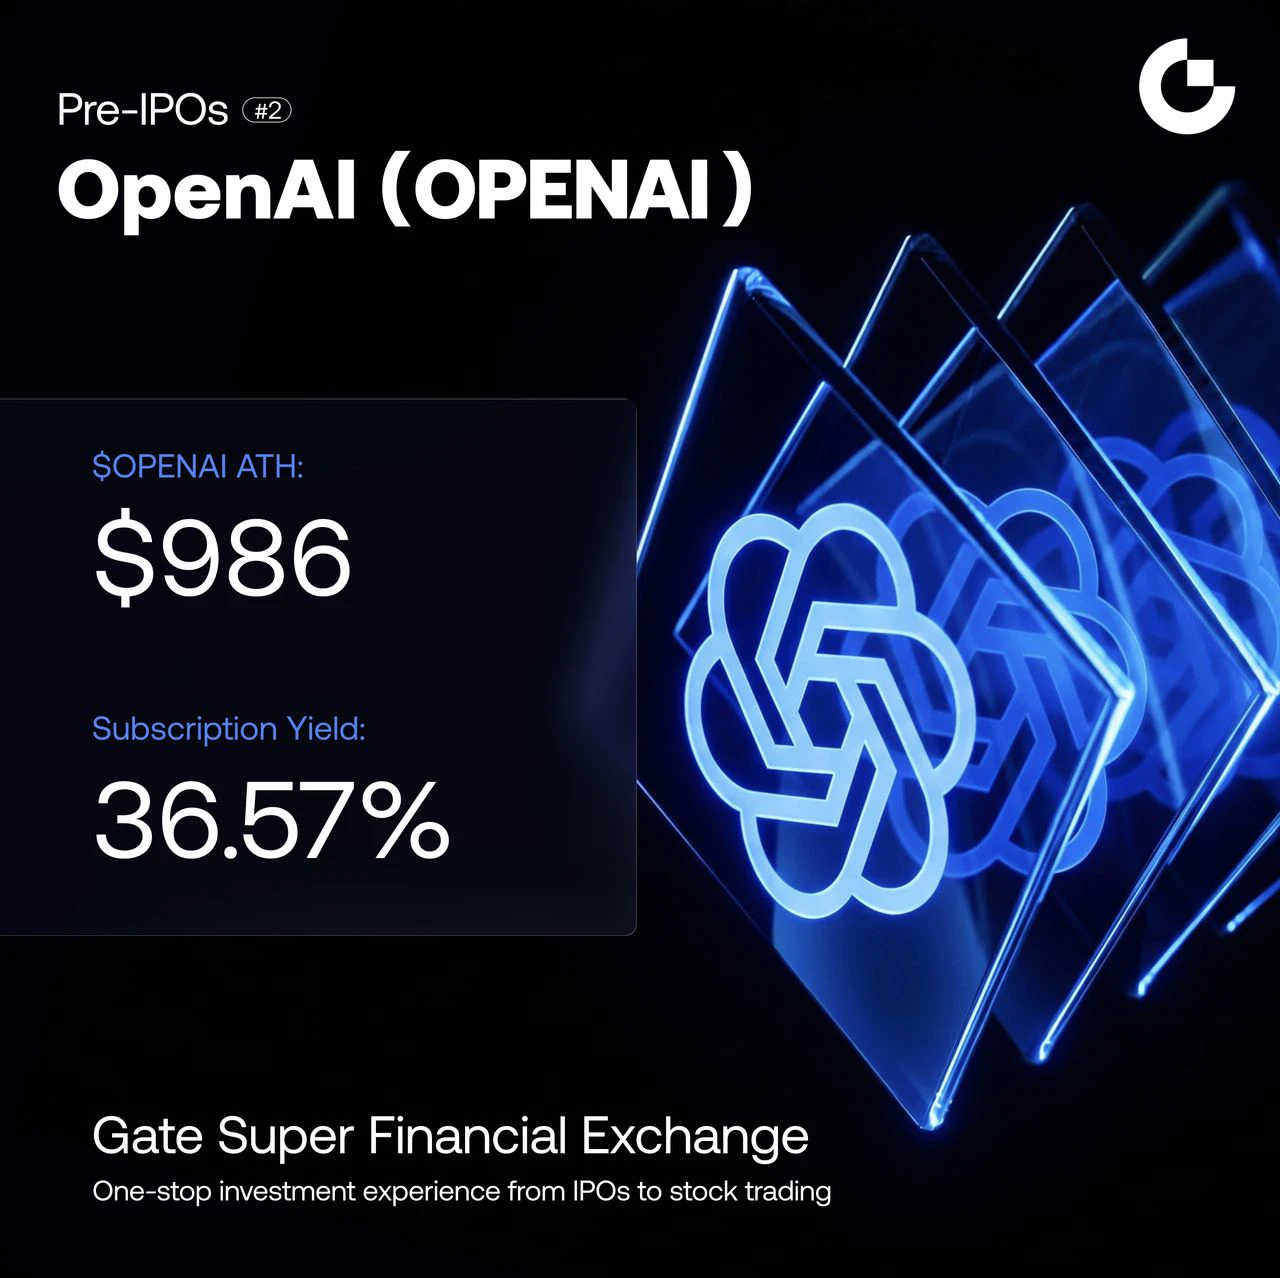
$OPENAI is moving.
Gate Pre-IPOs #2 OpenAI (OPENAI) asset certificates are now 100% unlocked, following subscription returns of up to 36.57% and a high above $986.
OpenAI is one of the names the market can’t stop watching. Now, you can trade its price moves on Gate Pre-IPOs.
https://www.gate.com/trade/OPENAI_USDT
$OPENAI ‌
#GateSquareMidAutumnReunion #ShareWeekly
post-image
OPENAI+2.36%
$15.6B Fed Purchases ≠ QE
The headline looks bullish for $BTC , but the mechanics matter.
The New York Fed plans roughly $15.6B in Treasury reinvestments through Oct. 14, with zero reserve-management purchases.
That means no fresh QE injection. The main effect is preventing further balance-sheet contraction.
The real liquidity signal comes next: will reserve-management purchases appear?
For $BTC , the Fed’s next move may matter more than the $15.6B headline.
#BTC #Liquidity #Fed
post-image
BTC+5.69%
Everyone's hunting a breakout but SYMBOL is begging to drop further.

$SUI /USDT - SHORT

Trade Plan:
Entry: 0.811 – 0.817
SL: 0.848
TP1: 0.788
TP2: 0.771
TP3: 0.746

Why this setup?
Why now? The daily trend is still just range-bound, so a short bias carries real weight at a 77.4 confidence score. The 15m RSI at 58.76 shows room to cool before any real relief rally starts. With the 1h ATR sitting at 0.010951, the entry zone between 0.811 and 0.817 is tight enough to get filled near the 0.814 reference. First target is 0.788, the second sits at 0.771, and the line in the sand is 0.749.

Deb
SUI+10.40%
ZEC | Bearish bias 🔴 | 15-minute trend pullback/continuation · Confidence: 81/100 Watch: 1454.11 Invalidation: 1484.62 (2.10%) Targets: 1415.97 / 1393.08 / 1362.57 RSI14: 43.8 · ADX14: 35.4 · Volume: 0.36x Invalidated if a 15-minute candle closes below the invalidation level. For educational purposes only; not financial advice. Leverage carries high risk.$ZE
post-image
ZEC+0.02%
Load More

Join 40 M users in our growing community

⚡️ Join 40 M users in the crypto craze discussion

💬 Engage with your favorite top creators

👍 See what interests you

Trending Topics

JapanRealEstatePowerChipStocksRise

58.65k Views3.58k Discussing

Japan's Nikkei extended gains on Sept 18, with real estate, power, and semiconductor sectors leading. Gate covers over 12,800 global stocks and ETFs, offering one-stop USDT trading across US, HK, Korean, and Japanese markets. [👉 Read more](https://www.odaily.news/en/newsflash/518749)

USAIConceptStocksRally

33.45k Views520 Discussing

GateTopsStockPerpetualCoverage

37.59k Views2.32k Discussing

View More