Square
Following
Hot
News
Profile
Share your thoughts
placeholder
Article
A certain Spirit Forged card has come across my desk and it may actually be gas in Ziggs. It's so troll, yet somehow quite synergistic with his play pattern.
Going to test more tonight!
post-image
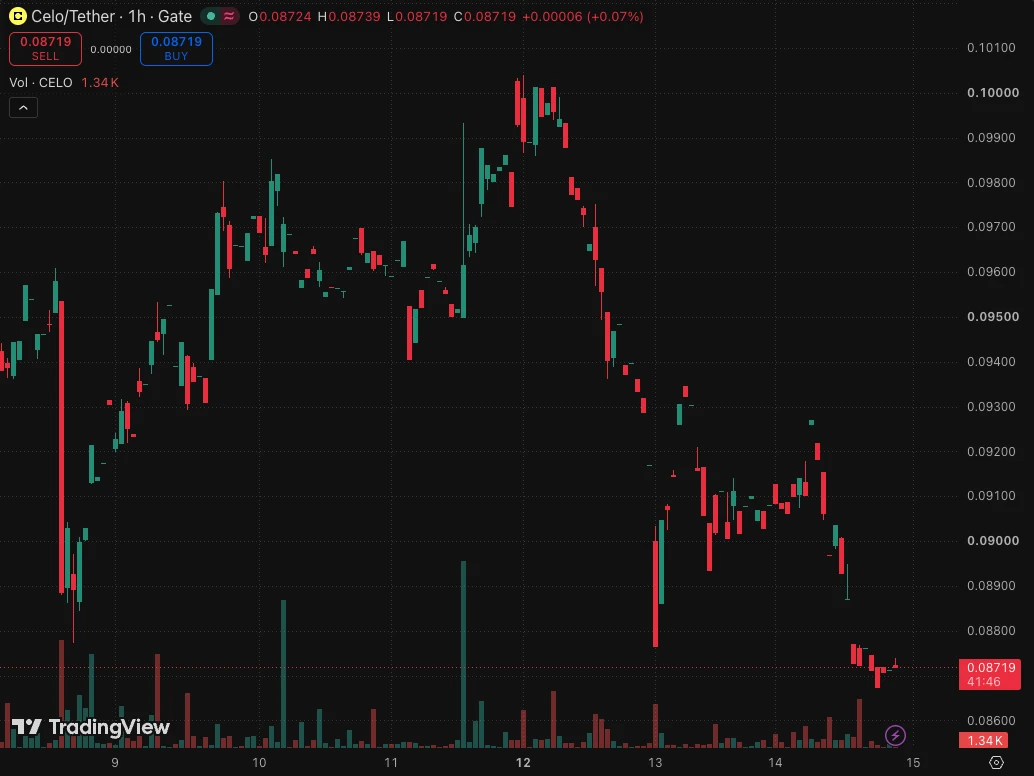
$CELO CELOUSDT Final Liquidity Zone Before Expansion?
The price is moving within a bearish channel on the 1-hour timeframe; it has reached the lower boundary and is poised for a rebound. A retest of this boundary is expected, supporting an upward move.
The Relative Strength Index (RSI) indicates a bearish trend, but an upward breakout is likely due to oversold conditions on the 1-hour timeframe.
An orange trend line supports the upward rebound.
There is initial support at 0.08515, acting as a primary support zone.
A key support zone (marked in green) exists at 0.08280; the price has bounced of
post-image
CELO-4.18%
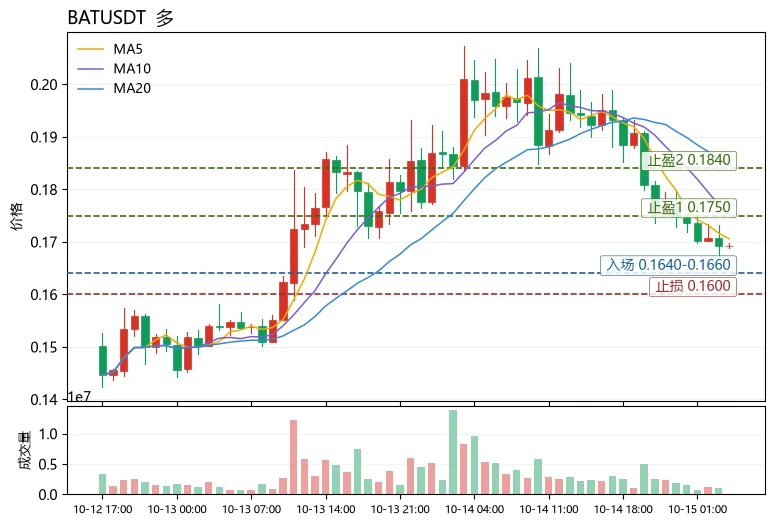
The most unusual detail in today’s market is not the decline, but the funding rate: $BAT fell 15.27% over 24 hours, yet the funding rate remains positive at +0.0010%. With the price collapsing while longs are still paying to hold positions, this indicates that shorts have not built up positions aggressively. The decline looks more like forced long unwinding and stop-loss liquidation than an active short attack. Under this structure, the risk of a wick is higher than the risk of trend continuation.
Technically, $BAT at the current price of 0.1693 has fallen below MA5 (0.1706) and MA20 (0.1844
post-image
eur
eureur
Gate.Fun
MC:$5.55KHolders:3
0.06%
BAT-12.09%
ZAMA-12.81%
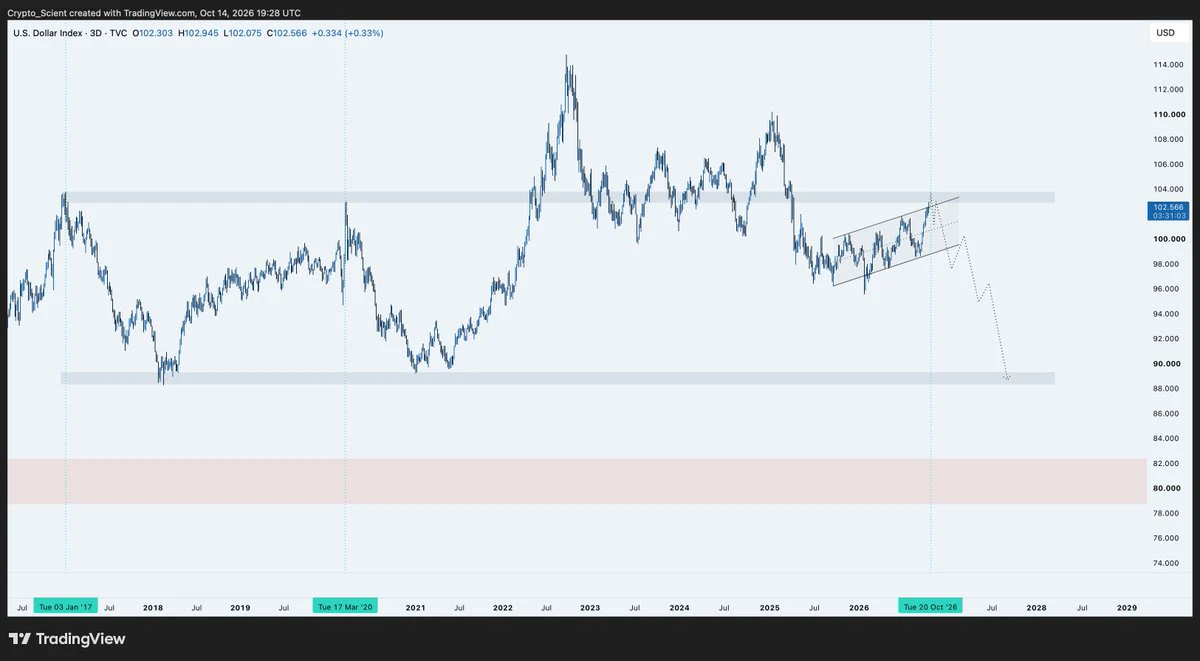
$DXY after falling back inside macro range that started back in 2017 is currently retesting the range highs as resistance while consolidating in a bearish rising wedge pattern.
Rejection from this 103 level started started the big bullruns of 2017 and 2020.
Current move is overextended imo in a beairsh rising wedge right into a key macro support.
As long price is unable to break above 103 level, this is where you get bullish not bearish.
post-image
MARKET OVERVIEW
live-cover
LIVE539
Frax, Beefy, Renzo, Metronome, Liquity and Inverse Finance plan to move liquidity to Aero, the merged Aerodrome and Velodrome DEX, at its October 21 launch. Frax plans to migrate its frxETH and FRAX protocol-owned liquidity.
@aeroxyz
FRAX-0.95%
REZ+0.00%
LQTY-5.28%
AERO-1.49%
What should we do, lets know
live-cover
LIVE629
$TLT
If this bottom attempt holds true then it provides a very nice R:R here. Daily shows at least 4% upside potential.
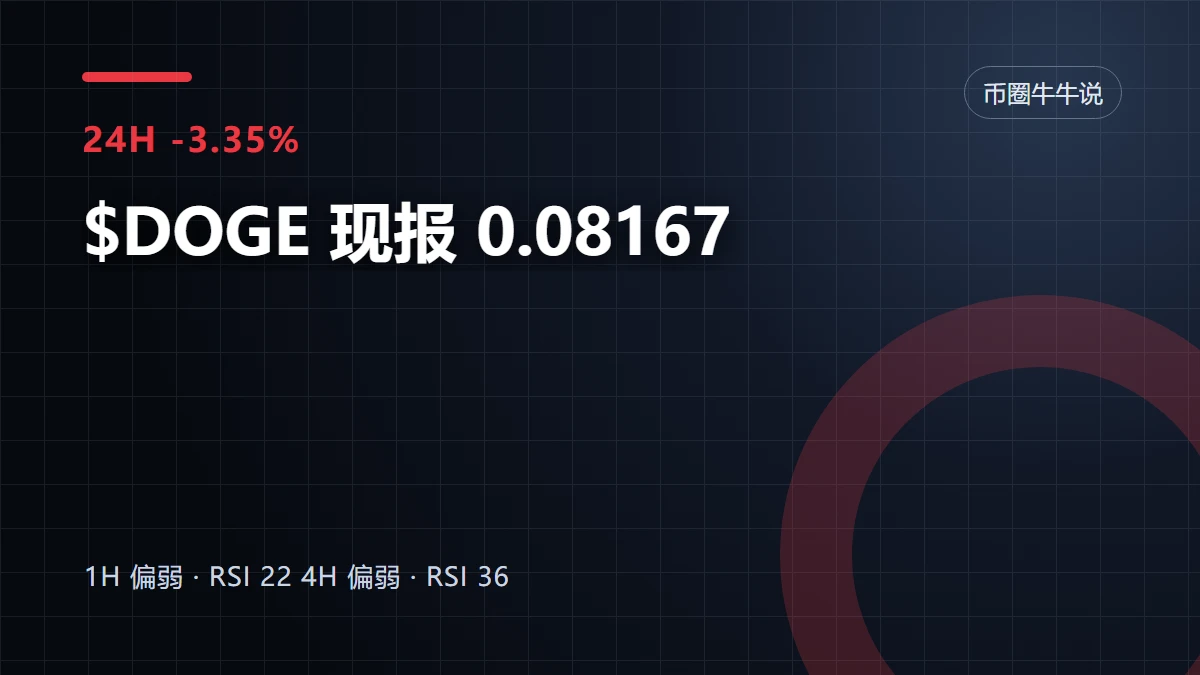
$DOGE has entered oversold territory, but “it’s time for a rebound” and “it has bottomed out” are entirely different things. I would rather lay out the bearish case first.
Bears see the risk after a break below 0.08131, while bulls need to prove that buyers remain after a break above 0.08567. Current volume is 0.26x.
The current price is 0.08167, about 0.44% from the one-hour support at 0.08131 and about 4.90% from the resistance at 0.08567. The position determines which side is more urgent, with the next level to watch shifting to 0.08004.
Letting the boundaries provide the answer is more re
post-image
DOGE-3.57%
XAU’s pullback continues to play out, with the bears maintaining their southward momentum! The cumulative downside has now reached 125 points🔥
Don’t let idle fantasies waste your opportunities; overthinking creates nothing but problems, while taking action provides the answers.
$XAU #美国9月CPI超预期
XAU-1.35%
#美股 #Gate股票
U.S. Stock Market at a Turning Point: Inflation, Bank Earnings, and Semiconductor Giants in Focus
The U.S. stock market continues to attract global attention as investors navigate changing inflation expectations, corporate earnings, and rapid advances in artificial intelligence. These forces are closely connected, making this an important period for understanding the direction of equities and the broader financial landscape.
Three major themes stand out: U.S. inflation data, quarterly earnings from leading Wall Street banks, and the financial outlook for semiconductor giants ASML
ASML-3.91%
TSM-3.35%
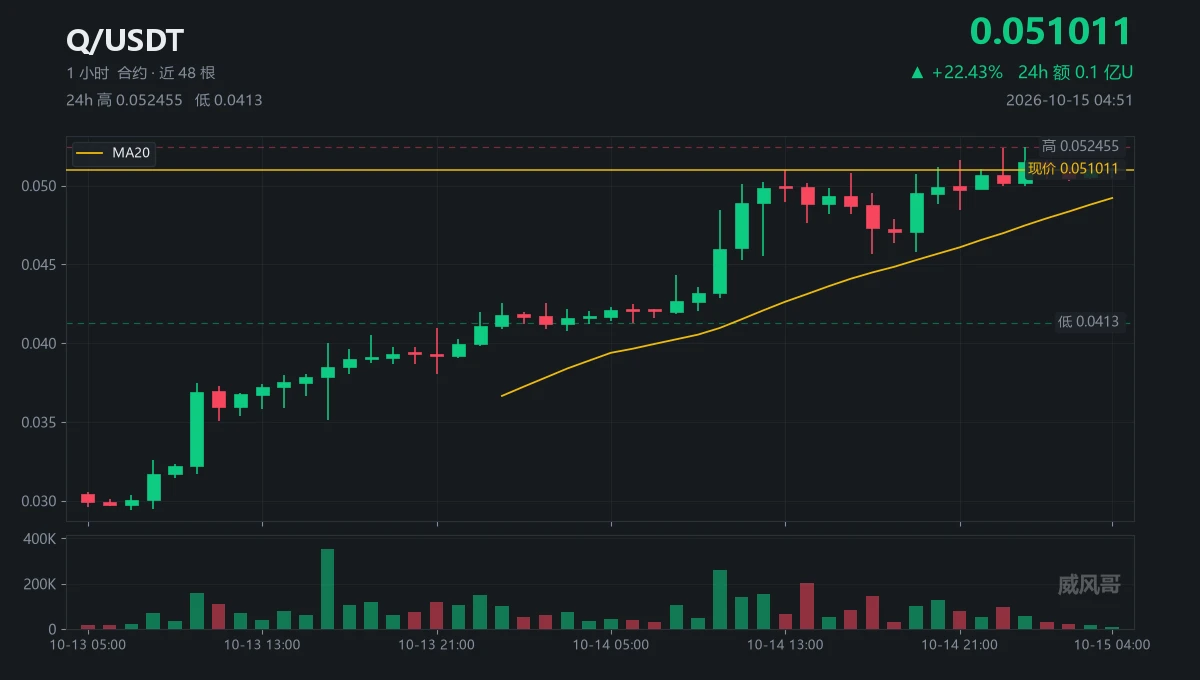
Contrast. 48 hours +78%, but the latest candle’s volume is only 0.11x.
Four acts. 0.051647, 0.051294, 0.051262, 0.051182.
The highs of the four hourly candles keep getting lower, while the volume ratio shrinks from 0.33 to 0.11.
Down below. The four lows are squeezed within 0.33%; none has broken through.
Overhead. 0.052399 and 0.052455 collided twice, with a 0.107% gap.
Both collisions were pushed back, and the volume on each top-side push was lower than the last.
Convergence. The upper bound presses down, the lower bound rises, and $Q is stuck at 0.051011.
The math. Chasing to the previous
post-image
Q+22.91%
Choose you Team !
Team 🅰️
$PEPE
$DOGE
#LUNC

Team 🅱️
$WKC
$SHIB
#FLOKI
🔄for Team 🅰️
❤️for Team 🅱️
post-image
PEPE-3.49%
DOGE-3.57%
LUNC-3.98%
WKC+2.43%
SHIB-3.12%
$ETH Bullish rebound pattern… Buyers re-enter
ETH is rebounding near the 2,415 support area. After heavy selling, buyers are beginning to regain control. Entry price: 2,420–2,440; Next target price: 2,480; Take profit 1: 2,520; Take profit 2: 2,560; Final target price: 2,600; Stop-loss: 2,330. As long as ETH holds its current rebound structure, I expect the price to strengthen further and recover to 2,520–2,600. A solid recovery above 2,500 would further strengthen this bullish pattern. Trade on $ETH
post-image
ETH-3.85%
BTC absolutely crushed it today!!
1. First, let's take a look: after the CPI data came out, BTC moved straight downward, breaking below the key level with volume—that is, 83132 for right-side trading! Just enter a short directly; even if it fails to reclaim the level during the rebound, you can still short directly!
2. BTC hit both of our take-profit targets perfectly. Reduce the position by 50% at the first take-profit target, and close the entire position at the second. Why? Taking profits in batches prevents profit retracement while maximizing profits!
3. Once the short position hits take p
BTC-1.99%
Robinhood season making a come back???
post-image
HOOD-8.51%
$SOXL It dropped 14.34% in a day, plunging from 130.82 to 109.22, with trading volume hitting $3.15 billion—this isn't a pullback; it's a triple-leveraged ETF being bled dry in the semiconductor sector.
Let's look at the data first: $SOXL currently at 109.72, with a 24-hour high of 130.82 and a low of 109.22, for a nearly 16% range. Trading volume was 3152.4M. What does that mean? A high-volume decline, not a low-volume grind down—people are genuinely fleeing, and others are genuinely buying the dip. A 3x long semiconductor position falling 14% corresponds to the underlying index dropping roug
SOXL-13.41%
SOXX-4.46%
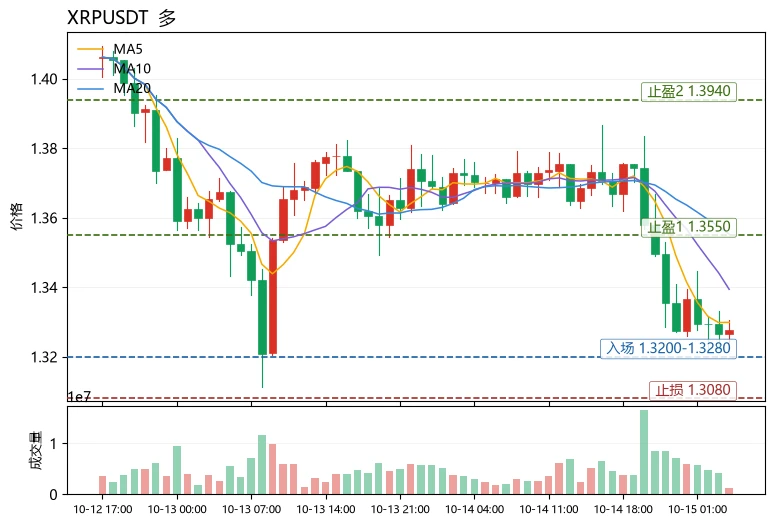
Coins with a bearish moving-average alignment—does that necessarily mean the trend is broken? Not necessarily—the key is to look at the price’s position within the Bollinger Bands and the direction of the funding rate.
$XR Current price 1.3277, down 3.45% in 24h. MA5=1.3299 is below MA20=1.35527, a standard bearish alignment; RSI=32.3 has entered oversold territory, while the MACD histogram=-0.003687 remains negative. But note two points: first, the price is already close to the lower Bollinger Band at 1.31659, so short-term downside room is limited; second, the funding rate is -0.0069%, mean
post-image
STX-1.88%
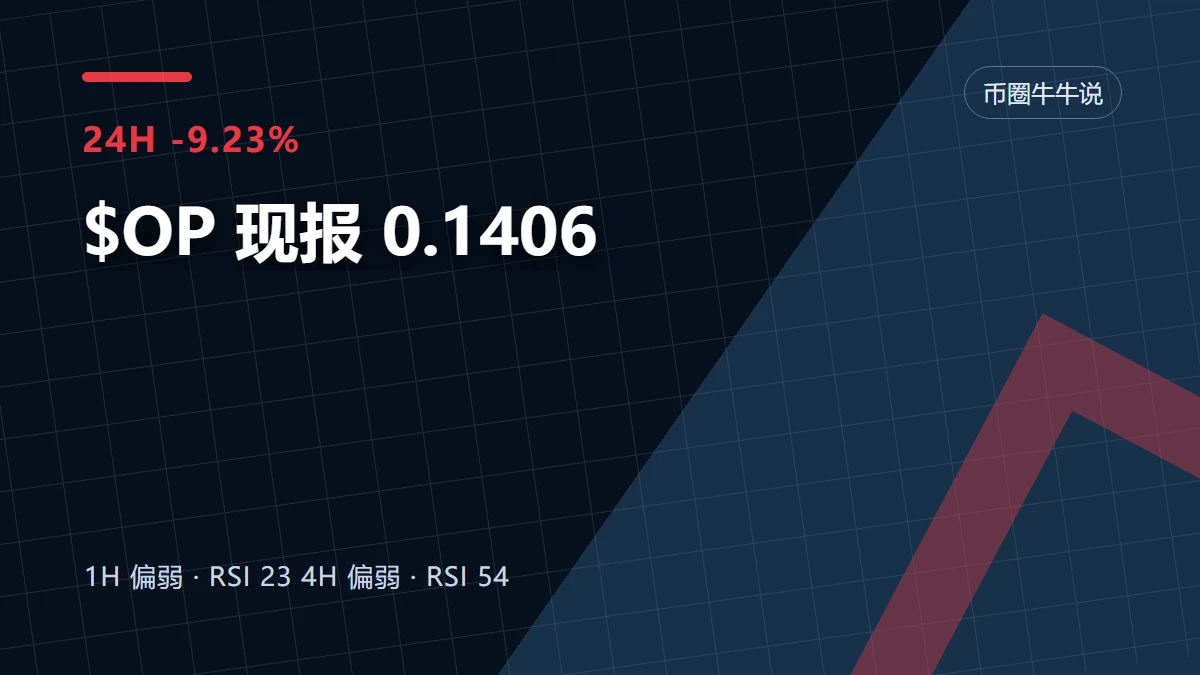
The low end of $OP is starting to attract attention, but a sense of cheapness can never replace evidence of a bottom. I would rather lay out the bearish case first.
The bears see the risk after a break below 0.1369, while the bulls need to prove that buyers remain after a break above 0.1625. Current volume is 0.03x.
The current price is 0.1406, about 2.63% from the one-hour support at 0.1369 and about 15.58% from the resistance at 0.1625. Positioning determines which side is more urgent, and the next level to watch shifts to 0.1259.
Waiting for the boundaries to provide an answer is more reli
post-image
OP-11.86%
Load More

Join 40 M users in our growing community

⚡️ Join 40 M users in the crypto craze discussion

💬 Engage with your favorite top creators

👍 See what interests you

Trending Topics

USSeptemberCPITopsEstimates

35.66k Views2.27k Discussing

US September CPI rose 3.7% YoY, above the 3.6% estimate; core CPI rose 2.6%, also above the 2.5% estimate. With inflation topping forecasts across the board, how will rate hike expectations shift? How will BTC react? Share your view.

DrLinHanSpeaksAtOxfordUnion

135.08k Views1.85k Discussing

GateWCTCS9GlobalTradingCompetition

37.4k Views6.12k Discussing

View More